21831 Mossy Field Ln · Houston, TX
Flood risk 1/10 · Minimal
- FEMA flood zone
- X (unshaded)
- Chance of flooding over 30 yrs
- 0.0%
- Est. flood insurance / yr
- $507 – $1,088
Fire risk 3/10 · Minor
- Est. fire insurance / yr
- $1,222 – $2,270
Heat risk 9/10 · Severe
- Hot days now (above 110°F)
- 7 days/yr
- Hot days in 30 yrs
- 24 days/yr
Wind risk 8/10 · Major
- Chance of severe wind over 30 yrs
- 99.0%
Air-quality risk 3/10 · Minor
- Unhealthy air days now
- 3 days/yr
- Unhealthy air days in 30 yrs
- 3 days/yr
Risk factors via First Street. Map © Google.
Why this score? — see what drove the D- grade
The composite is a weighted blend of 9 inputs, each scored 0–100. Each bar is that input's sub-score; the figure is the points it added to the 100-point composite (weight × sub-score).
- Cash flow +12.2/30.0
- ARV discount +7.0/15.0
- 1% rule +4.5/10.0
- Schools +4.1/10.0
- Livability +3.7/5.0
- DSCR +3.6/10.0
- Condition / age +2.5/5.0
- Rent growth +2.2/5.0
- Appreciation +0.0/10.0
$220,000
🖨 Deal sheet 📄 Offer letter ✓ Due diligence
Listing remarks MLS
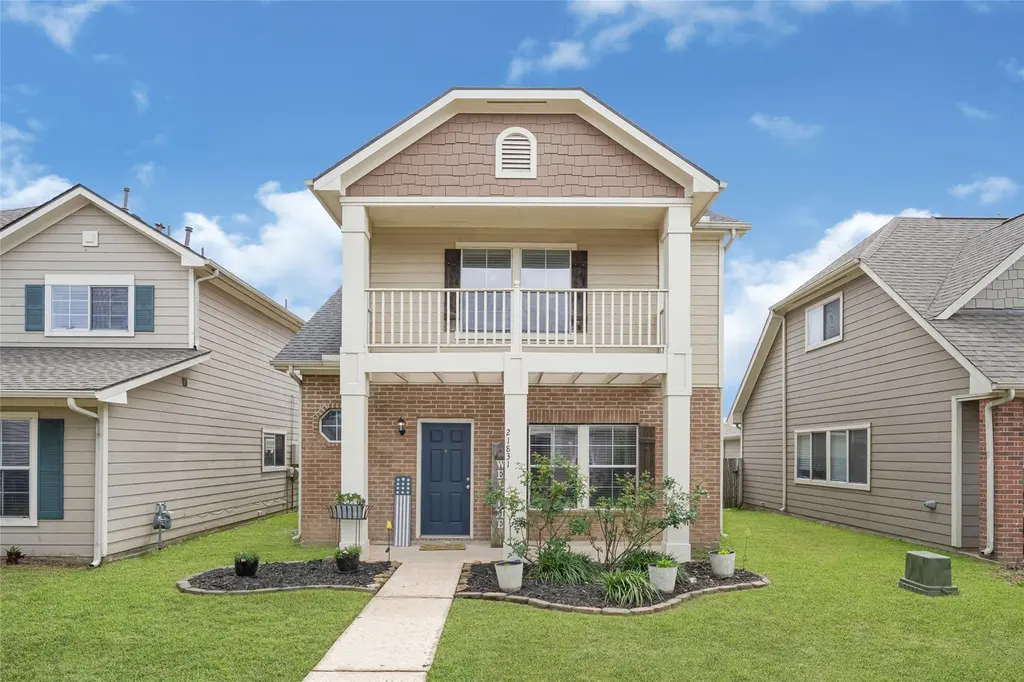
Charming, well-maintained two-story traditional home with a welcoming front porch, offering 3 bedrooms and 2.5 baths. The updated kitchen features a butcher block island and opens seamlessly to the family room, creating a functional and inviting space for everyday living and entertaining. Thoughtfully designed with great natural light throughout, the layout offers both comfort and practicality. A cleverly utilized under-stair space provides the perfect spot for a cozy pet area or additional storage. Conveniently located near shopping, dining, and everyday amenities, this home blends comfort, character, and functionality in a desirable setting.
Key facts
- Great natural light
- Butcher block island
- Cozy pet area
Tags
Neighborhood map
What this means for you Summary
Snapshot
- This is a 3-bed/1.5-bath single-family listed at $220k.
Deal economics
- At list price, monthly cash flow is $-44 ($-524/yr) — negative.
- To cash-flow at today's rent, offer at most $212k (3.5% below list).
- To meet the 1% rule (rent ≥ 1% of price), the offer needs to be $208k (5.5% below list).
- Recommended offer: $208k (5.5% below list) — sets the bar for 1% rule.
- Cap rate 6.1% vs local median 3.2% in Houston — top-decile yield for the area; either an underpriced asset or a hidden risk that comps aren't pricing in. Stress-test before assuming the spread holds.
Location & tenants
- Location reads 74/100 on livability (#184 in TX, #4,771 nationally) — a middle-class / working-renter tenant base. Strengths: amenities A+, cost of living A+, housing A+; Watch: schools D, crime F.
- Klein ISD (suburban): math 41% / reading 48% proficiency, ranked #213 of 826 in TX (top 26%) — families likely to look elsewhere, expect single-tenant / working-renter base with shorter leases.
- Market conditions: Rents soft (-1.1%/yr); 325 active listings in the ZIP; 20 comparable units currently listed for rent nearby; rentals leasing fast (median 11d on market — plan ~1-2 weeks tenant-placement turnaround); solid renter incomes; 29,883 units permitted in Harris County in 2024 (8,621 in 5+ unit buildings).
Forward outlook
- Local home prices are declining (-3.0%/yr); year-one equity from $2k of loan paydown is wiped out by about $7k of value loss. Plan a longer hold.
- Harris County population projected at +47% by 2050 — long-run rental-demand tailwind backs the buy-and-hold thesis.
Negotiation context
- It's been on market 27 days — a 2% lower offer ($217k) is reasonable based on typical stale-listing flexibility.
Risks & watch-outs
- Climate carrying-cost: severe wind risk, 99% chance of damaging wind over 30y; extreme-heat days projected 7→24/yr by 2055 (HVAC capex compounding) — expect insurance premiums to compound above CPI over the hold.
Questions for the listing agent
- What do current leases actually rent for vs. the listed asking? Can we see a recent rent roll and the last 12 months of T-12 income?
- What does the HOA fee cover, when was the last increase, and are there any pending special assessments or reserve-fund shortfalls?
- Is there a deadline driving the sale (1031 exchange, divorce, estate, relocation)? That informs how much negotiation room exists.
- Schools are D-rated, which usually means shorter tenancies and higher turnover. Who's the typical renter profile here, and what's been the actual vacancy rate?
- Crime grade is F in this area — have there been break-ins, vandalism, or insurance claims at this property in the last 3 years? What carrier currently insures it and at what premium?
- The area grade is low — what's the realistic commute time and amenity access for the typical tenant pool here? Any planned neighborhood developments (good or bad) we should know about?
- What's the average days-on-market for RENTAL listings here right now (not sales)? A rising rental-DOM trend means longer vacancies and softer asking-rent achievability than the comps imply.
- What's the recent tenant-quality profile in this submarket — average credit score on applications, eviction rate, late-payment / NSF rate, and stable-employment percentage? A property-management company in the area should have these aggregated.
- How much new for-sale + rental construction is in the pipeline within 1–3 miles? Heavy new supply typically softens prices + rents 12–24 months out; constrained supply supports both.
Investment metrics
- 1% rule
- 0.95% ✗
- Cap rate
- 6.05%
- Cash-on-cash
- -0.85%
- DSCR
- 0.96
- GRM
- 8.8
CMA / ARV
- ARV (median comp)
- $217,802
- List price
- $220,000
- Delta
- 1.01%
- Verdict
- FAIR
- Comps
- 20 within 1.0 mi
Show comp detail 12 sales within ~0.75 mi
| Address | Dist | Beds/Ba | Sqft | Sold | Price | $/sf | Match |
|---|---|---|---|---|---|---|---|
| 21831 Mossy Field Ln | 0.00mi | 3/2.5 | 1,271 (0%) | 0mo | $220,000 | $173 | 96 |
| 4071 Mossy Place Ln | 0.10mi | 3/2.0 | 1,199 (-6%) | 6mo | $200,000 | $167 | 79 |
| 21755 Mossy Field Ln | 0.06mi | 3/2.0 | 1,199 (-6%) | 9mo | $222,500 | $186 | 79 |
| 3962 Mossy Place Ln | 0.09mi | 3/2.5 | 1,388 (+9%) | 3mo | $199,900 | $144 | 74 |
| 3938 Falvel Shadow Creek Dr | 0.17mi | 3/2.0 | 1,394 (+10%) | 4mo | $229,500 | $165 | 71 |
| 21531 Roseville Dr | 0.44mi | 3/1.0 | 1,196 (-6%) | 6mo | $190,000 | $159 | 62 |
| 3927 Falvel Cove Dr | 0.45mi | 3/2.0 | 1,434 (+13%) | 4mo | $259,000 | $181 | 53 |
| 3327 Haydee Rd | 0.65mi | 3/2.0 | 1,335 (+5%) | 8mo | $224,900 | $168 | 52 |
| 21507 Meadowhill Dr | 0.66mi | 2/2.0 (-1) | 1,188 (-6%) | 2mo | $217,000 | $183 | 50 |
| 3702 Acorn Way Ln | 0.49mi | 3/2.0 | 1,435 (+13%) | 6mo | $249,000 | $174 | 49 |
| 3523 Nutwood Ln | 0.74mi | 2/1.0 (-1) | 1,134 (-11%) | 2mo | $190,000 | $168 | 39 |
| 3326 Hartfield Ln | 0.66mi | 3/2.0 | 1,452 (+14%) | 6mo | $230,000 | $158 | 39 |
Match score weights: distance 35% · size 25% · config 20% · recency 20%. Top-matched comps best support the ARV.
Projected returns pro-forma
-3.0% appreciation · 0.0% rent growth · sell at horizon
- IRR
- -21.4%
- Equity multiple
- 0.28×
- Total profit
- $-44,390
- Equity at exit
- $32,803
- IRR
- -25.8%
- Equity multiple
- -0.06×
- Total profit
- $-65,242
- Equity at exit
- $19,022
Cash invested: $61,600 (down + closing). Projections, not guarantees.
Landlord ↔ Tenant lean methodology
- Overall (STATE)
- 87 Strongly Landlord-Friendly
- State Texas
- 87 Strongly Landlord-Friendly · R+5
- County
- — inherits STATE
- City
- — inherits STATE
ZIP-level market 77388
- Home prices YoY
- -34.8%
- Rents YoY
- -1.1%
- Active inventory
- 325
- Price-to-rent
- 8.8×
Monthly cashflow live
- Estimated rent
- $2,079 high interval (Pro) →
- Mortgage (P&I)
- −$1,154
- Tax from tax record
- −$381 /mo · $4,573/yr
- Insurance
- −$92
- HOA
- −$60
- Vacancy / Maint / Mgmt
- −$437
- Net cashflow
- $-44
Break-even live
UW: 25.0% down · 7.5% · 30yr · 1.5% tax · 5.0% vac · 8.0% maint · 8.0% mgmt
Financing live
Cash to close
- Down payment
- $55,000
- Closing costs
- $6,600
- Reserves months
- —
- Total cash needed
- —
Loan-product check · same deal, 3 products live
Conventional
25% down · 7.5% · 30yr
- Down + closing
- —
- Monthly P&I
- —
- Monthly cashflow
- —
- DSCR
- —
- Eligible?
- —
Personal DTI + credit; lowest rate.
DSCR
20% down · 8.5% · 30yr
- Down + closing
- —
- Monthly P&I
- —
- Monthly cashflow
- —
- DSCR
- —
- Eligible?
- —
No personal income docs; deal must DSCR.
Hard money
10% down · 12.0% · 12mo
- Down + closing
- —
- Monthly P&I
- —
- Monthly cashflow
- —
- DSCR
- —
- Eligible?
- —
Short-term bridge; refi at stabilization.
Rent comps 20 comps
| Address | Beds | Baths | Sqft | Rent | $/sqft | DOM | Units | Dist |
|---|---|---|---|---|---|---|---|---|
| 21771 Mossy Field Ln Spring, TX | 3.0 | 3.0 | 1631 | $2,150 | $1.32 | 43d | 1 | 0.03mi |
| 4018 Falvel Shadow Creek Dr Spring, TX | 4.0 | 2.0 | 1458 | $1,960 | $1.34 | 11d | 1 | 0.18mi |
| 4209 Spring Stuebner Rd Unit 4242 Spring, TX | 3.0 | 2.0 | 1584 | $2,210 | $1.40 | 10d | 1 | 0.25mi |
| 4209 Spring Stuebner Rd Unit 4246 Spring, TX | 2.0 | 2.0 | 1277 | $1,990 | $1.56 | 10d | 1 | 0.25mi |
| 4209 Spring Stuebner Rd Unit 3228 Spring, TX | 3.0 | 2.0 | 1584 | $2,178 | $1.38 | 3d | 1 | 0.25mi |
| 4209 Spring Stuebner Rd Unit 424 Spring, TX | 2.0 | 2.0 | 1277 | $1,966 | $1.54 | 7d | 1 | 0.25mi |
| 4209 Spring Stuebner Rd Unit 2228 Spring, TX | 2.0 | 2.0 | 1277 | $1,958 | $1.53 | 3d | 1 | 0.25mi |
| 3402 Almondwood Dr Spring, TX | 3.0 | 2.0 | 1414 | $1,795 | $1.27 | 12d | 1 | 0.62mi |
| 3880 Farm to Market 2920 Spring, TX | 1.0–3.0 | 1.0–2.0 | 1037 | $2,536 | $2.45 | 2d | 29 | 0.67mi |
| 3607 Nutwood Ln Spring, TX | 3.0 | 3.0 | 1299 | $2,399 | $1.85 | 43d | 1 | 0.71mi |
| 3899 Farm to Market 2920 Unit 2920 Spring, TX | 2.0 | 2.0 | 1149 | $1,796 | $1.56 | 12d | 1 | 0.72mi |
| 3869 Farm to Market 2920 Unit 2920 Spring, TX | 2.0 | 2.0 | 1056 | $1,774 | $1.68 | 24d | 1 | 0.72mi |
| 4114 Farm to Market 2920 Spring, TX | 1.0–2.0 | 1.0–2.0 | 964 | $2,146 | $2.22 | 2d | 24 | 0.74mi |
| 21400 Big Spring Valley Ave Spring, TX | 1.0–3.0 | 1.0–2.5 | 1074 | $2,370 | $2.21 | 2d | 67 | 1.16mi |
| 2953 FM 2920 Rd Spring, TX | 1.0–3.0 | 1.0–2.0 | 996 | $2,280 | $2.29 | 2d | 23 | 1.26mi |
| 21330 N Tangle Creek Ln Spring, TX | 3.0 | 2.0 | 1231 | $1,836 | $1.49 | 43d | 1 | 1.37mi |
| 4703 Owens Creek Ln Spring, TX | 3.0 | 2.0 | 1662 | $1,920 | $1.16 | 19d | 1 | 1.40mi |
| 2555 Farm to Market 2920 Spring, TX | 1.0–2.0 | 1.0–2.0 | 935 | $1,941 | $2.07 | 2d | 12 | 1.42mi |
| 5222 Farm to Market 2920 Unit SOSG Spring, TX | 2.0 | 2.0 | 1173 | $1,548 | $1.32 | 12d | 1 | 1.47mi |
| 3223 Spring Cypress Rd Spring, TX | 1.0–2.0 | 1.0–2.0 | 999 | $1,739 | $1.74 | 43d | 1 | 1.48mi |
HOA detail
- Monthly dues
- $60 · $720/yr
Listing history 3 events
-
2026-05-12status Pending 657-char remark
Show marketing remark (657 chars)
Charming, well-maintained two-story traditional home with a welcoming front porch, offering 3 bedrooms and 2.5 baths. The updated kitchen features a butcher block island and opens seamlessly to the family room, creating a functional and inviting space for everyday living and entertaining. Thoughtfully designed with great natural light throughout, the layout offers both comfort and practicality. A cleverly utilized under-stair space provides the perfect spot for a cozy pet area or additional storage. Conveniently located near shopping, dining, and everyday amenities, this home blends comfort, character, and functionality in a desirable setting.
-
2026-05-11status Pending 657-char remark
Show marketing remark (657 chars)
Charming, well-maintained two-story traditional home with a welcoming front porch, offering 3 bedrooms and 2.5 baths. The updated kitchen features a butcher block island and opens seamlessly to the family room, creating a functional and inviting space for everyday living and entertaining. Thoughtfully designed with great natural light throughout, the layout offers both comfort and practicality. A cleverly utilized under-stair space provides the perfect spot for a cozy pet area or additional storage. Conveniently located near shopping, dining, and everyday amenities, this home blends comfort, character, and functionality in a desirable setting.
-
2026-04-15$220,000 Active 657-char remark
Show marketing remark (657 chars)
Charming, well-maintained two-story traditional home with a welcoming front porch, offering 3 bedrooms and 2.5 baths. The updated kitchen features a butcher block island and opens seamlessly to the family room, creating a functional and inviting space for everyday living and entertaining. Thoughtfully designed with great natural light throughout, the layout offers both comfort and practicality. A cleverly utilized under-stair space provides the perfect spot for a cozy pet area or additional storage. Conveniently located near shopping, dining, and everyday amenities, this home blends comfort, character, and functionality in a desirable setting.
ⓘ Source: listings_history table (triggers on properties + properties_extension) + one-shot
backfill from property_details.listing_events for pre-trigger history.
Tax reassessment forecast TX · Resets to sale price
- Current annual tax
- $4,573 · $381/mo
- Projected year-2 tax
- $4,573 · $381/mo
- Expected delta
- $0/yr ($0/mo · 0.0%)
ⓘ Screening estimate from a state-policy table — verify with the county assessor before closing.
Climate risk First Street
- Flood 1/10 Low FEMA zone X (unshaded) · 0% chance over 30 yrs
- Wildfire 3/10 Moderate
- Heat 9/10 Extreme 7 d/yr ≥110°F today · 24 d/yr by 30 yrs out
- Wind 8/10 Severe 99% chance of damaging wind over 30 yrs
- Air quality 3/10 Moderate 3 unhealthy d/yr today · 3 by 30 yrs out
Nearby sold comps map
Loading sold comps map…
Walkable amenities ~0.75 mi
Loading nearby amenities…
Taxation est. · year 1
- Rental income
- $24,954
- − Mortgage interest
- −$12,323
- − Property taxes
- −$4,573
- − Insurance
- −$1,100
- − Repairs & maintenance
- −$1,996
- − Management
- −$1,996
- − HOA
- −$720
- − Depreciation
- −$6,400
- Taxable loss
- −$4,155
- Est. tax savings @ 24.0%
- +$997
- After-tax cash flow
- $474/yr
For passive investors: Depreciation is non-cash, so a rental often shows a tax loss while cash-flowing — sheltering income. Rental losses are passive: they offset passive income freely, and up to $25,000/yr can offset ordinary (W-2) income if you actively participate and your MAGI is under $100k (phasing out to $0 by $150k); unused losses carry forward. On sale, claimed depreciation is recaptured at up to 25%, and gains may owe capital-gains tax (a 1031 exchange can defer both). Figures are a year-1 estimate at your 24.0% rate — not tax advice; consult a CPA.
Schools (NCES district)
- District
- Klein ISD
- NCES district ID
- 4825740
- Math proficiency
- 41% ▼ -12.00%
- Reading proficiency
- 48% ▼ -3.00%
- Median HH income
- $78,288
- Composite
- 40.91/100
- National rank
- #3615
- State rank
- #213 of 826 in TX
Livability — Houston
- Score
- 74/100
- State rank
- #184
- US rank
- #4771
Category grades
Schools grade is shown separately in the Schools card above.
Census & demographics
- County
- Harris County · 4,702,590 people
- City population
- 3,226,434
- Metro
- Houston-The Woodlands-Sugar Land, TX
- Population (ZIP)
- 53,425
- Household income
- $102,323
- Rent vs Own
- Severe rent burden
- 1419.0
Population outlook (Harris County) Hauer SSP2
- Today (2025)
- 5,571,493 people
- By 2030
- 6,089,821 · +9.3%
- By 2040
- 7,142,806 · +28.2%
- By 2050
- 8,185,864 · +46.9%
- By 2075
- 10,574,329 · +89.8%
- By 2100
- 12,109,958 · +117.4%
Race, ethnicity, and origin ACS 2023
- Neighborhood character
- Diverse neighborhood (Simpson 0.70)
- Race & ethnicity
- White 45% Hispanic / Latino 25% Black 18% Two or more races 12% Asian 8%
- Hispanic origin (detail)
- Mexican 15%
- Common ancestry
- Slovak 2% Lithuanian 2% Romanian 1%
- Foreign-born
- 15% · Canada, Vietnam, China
- Languages at home
- 74% English-only · Spanish 18% Other Indo-European 2% Other Asian/Pacific 1%
Political lean MEDSL · Harris
- 2024 margin
- Lean D (+5.5) · D 52.0% · R 46.4% · Other 1.6%
- 2008→2024 swing
- +3.9pp toward D · 2008: 1.6pp · 2024: 5.5pp
- All cycles
- 2024: D+5.5 2020: D+13.3 2016: D+12.4 2012: D+0.1 2008: D+1.6
Not yet ingested
- Civics
- —
Market trends
- HPI YoY
- ▼ -121.68%
- Current HPI
- 228.128
- Rent YoY
- ▼ -1.08%
- Metro
- Houston-The Woodlands-Sugar Land, TX
- State GDP YoY
- ▲ 3.95%
- F500 in state
- 110
Industry mix (Fortune 500 HQ in TX)
| Industry | F500 HQs | Revenue |
|---|---|---|
| Energy | 16 | $1,198B |
|
||
| Technology | 5 | $198B |
|
||
| Engineering / Construction | 4 | $72B |
|
||
| Energy Services | 3 | $60B |
|
||
| Utilities | 3 | $41B |
|
||
| Healthcare | 2 | $330B |
|
||
Price history
3 events — show timeline
- 2026-05-12 Pending — HARMLS
- 2026-05-11 Pending — HARMLS
- 2026-04-15 Listed $220,000 HARMLS
Property tax history
+2.6%/yrLatest (2025): $4,573 · -1.1% YoY. Source: county tax records.
Cash-flow waterfall
monthlySold comps — $/sqft
last 12 mo · ≤1 miLoading sold comps…