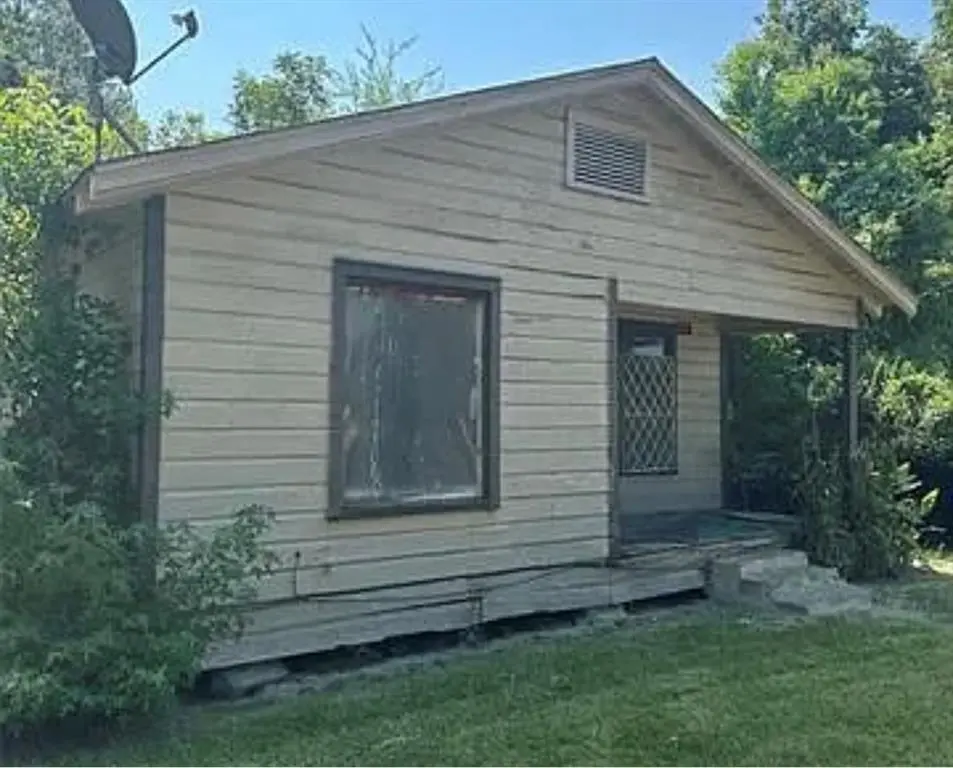
5705 Ellison St · Shreveport, LA
Flood risk 1/10 · Minimal
- FEMA flood zone
- X (unshaded)
- Chance of flooding over 30 yrs
- 0.0%
- Est. flood insurance / yr
- $507 – $1,088
Fire risk 1/10 · Minimal
- Est. fire insurance / yr
- $1,269 – $2,357
Heat risk 7/10 · Major
- Hot days now (above 110°F)
- 7 days/yr
- Hot days in 30 yrs
- 22 days/yr
Wind risk 6/10 · Moderate
- Chance of severe wind over 30 yrs
- 68.0%
Air-quality risk 2/10 · Minimal
- Unhealthy air days now
- 1 days/yr
- Unhealthy air days in 30 yrs
- 1 days/yr
Risk factors via First Street. Map © Google.
Why this score? — see what drove the D+ grade
The composite is a weighted blend of 9 inputs, each scored 0–100. Each bar is that input's sub-score; the figure is the points it added to the 100-point composite (weight × sub-score).
- Cash flow +15.0/30.0
- ARV discount +7.5/15.0
- 1% rule +5.0/10.0
- DSCR +5.0/10.0
- Appreciation +4.4/10.0
- Livability +3.0/5.0
- Rent growth +2.5/5.0
- Condition / age +2.5/5.0
- Schools +2.2/10.0
$5,500
🖨 Deal sheet (PDF) 📄 Offer letter ✓ Due diligence
Key facts
- 3,430 sq ft lot
- Built 1986
- Listed 31 days
Property features AI
Finance
- Other: Listed for sale (Active); Exclusive right to sell listing agreement; Possession at closing/funding
- Financial info: Treat as clear loan type; No second mortgage
- HOA & community: No association
Exterior
- Parking: On-street parking
- Utilities: City sewer; No municipal utility district
- Home design: Single-family residence; Residential property; Built in 1986
- Construction: Year built: 1986
- Exterior features: Lot in Washington Terrace Subdivision; Lot approximately 3,430 square feet
Interior
- Kitchen: No appliances included
- Bedrooms: 2 bedrooms (Primary bedroom on level 1)
- Bathrooms: 1 full bathroom
- Interior features: Open floorplan; One level
Neighborhood map
What this means for you Summary
Snapshot
- This is a 2-bed/1.0-bath single-family listed at $6k.
Deal economics
- At list price, monthly cash flow is $575 ($7k/yr) — positive.
- The deal already cash-flows at list — no discount required.
- Meets the 1% rule at list price ($791 rent vs $6k).
- Recommended offer: $5k (3.0% below list) — sets the bar for market timing.
- Cap rate 131.8% vs local median 5.6% in Shreveport — top-decile yield for the area; either an underpriced asset or a hidden risk that comps aren't pricing in. Stress-test before assuming the spread holds.
Location & tenants
- Location reads 59/100 on livability (#270 in LA) — a working-class tenant base; expect higher turnover. Strengths: cost of living A+, housing A; Watch: crime F, amenities F, commute F.
- Caddo Parish (urban): math 21% / reading 32% proficiency, ranked #53 of 98 in LA (top 54%) — low school quality limits family demand, transient renter base, plan for 1-2y turnover; 64% free/reduced lunch — lower-income household profile, screen leases tightly.
- Zoned schools: Oak Park Microsociety Elementary School (math 6% / reading 11%, grade F, #616 of 646 statewide, top 96%, 585 students, 90% FRL); Caddo Parish Middle Magnet School (math 79% / reading 93%, grade A+, #1 of 218 statewide, top 0%, 1,003 students, 23% FRL).
- Zoned-school proficiency averages 47% at this address vs 26% district-wide (+21 pts) — the actual schools serving this property are materially stronger than the Caddo Parish average implies; a family-tenant draw the district grade alone would hide.
- Market conditions: 125 active listings in the ZIP; 9 comparable units currently listed for rent nearby; rentals lingering (median 46d on market — plan ~5-8 weeks vacancy on turnover, expect pricing pressure); 56% of comp listings sitting > 30 days — soft ceiling on asking rent; lower-income renter base — watch delinquency; 221 units permitted in Caddo Parish in 2024 (0 in 5+ unit buildings).
Forward outlook
- Local home prices are declining (-1.2%/yr); year-one equity from $38 of loan paydown is wiped out by about $65 of value loss. Plan a longer hold.
- Caddo County population projected at -15% by 2050 — secular population decline; favor cash flow + early exit over multi-decade hold.
- At projected returns (-1.2% appreciation + 3.0% rent growth), your $2k cash investment doubles in ~1 year — after that, you're playing with house money.
Negotiation context
- It's been on market 32 days — a 3% lower offer ($5k) is reasonable based on typical stale-listing flexibility.
- 2 sale attempts since 3y ago with the ask held roughly flat each time — persistent listings suggest the price (not the market) is what's stuck; bring a comps-based counter.
Risks & watch-outs
- Watch-outs: property tax is 4.2% of price.
- Climate carrying-cost: major wind risk, 68% chance of damaging wind over 30y; extreme-heat days projected 7→22/yr by 2055 (HVAC capex compounding) — expect insurance premiums to compound above CPI over the hold.
Questions for the listing agent
- It's been on market 32 days. Have you received any prior offers? Is the seller open to a 3% concession, seller financing, or rate buy-down credit?
- Property tax is high relative to price — has the assessment been appealed recently, and will the sale trigger a re-assessment?
- Is there a deadline driving the sale (1031 exchange, divorce, estate, relocation)? That informs how much negotiation room exists.
- Schools are D-rated, which usually means shorter tenancies and higher turnover. Who's the typical renter profile here, and what's been the actual vacancy rate?
- Crime grade is F in this area — have there been break-ins, vandalism, or insurance claims at this property in the last 3 years? What carrier currently insures it and at what premium?
- The area grade is low — what's the realistic commute time and amenity access for the typical tenant pool here? Any planned neighborhood developments (good or bad) we should know about?
- What's the average days-on-market for RENTAL listings here right now (not sales)? A rising rental-DOM trend means longer vacancies and softer asking-rent achievability than the comps imply.
- What's the recent tenant-quality profile in this submarket — average credit score on applications, eviction rate, late-payment / NSF rate, and stable-employment percentage? A property-management company in the area should have these aggregated.
- How much new for-sale + rental construction is in the pipeline within 1–3 miles? Heavy new supply typically softens prices + rents 12–24 months out; constrained supply supports both.
Investment metrics
- 1% rule
- 14.39% ✓
- Cap rate
- 131.75%
- Cash-on-cash
- 448.07%
- DSCR
- 20.94
- GRM
- 0.6
CMA / ARV
- ARV (median comp)
- $33,136
- List price
- $5,500
- Delta
- -83.40%
- Verdict
- UNDERPRICED
- Comps
- 20 within 1.0 mi
Show comp detail 11 sales within ~0.75 mi
| Address | Dist | Beds/Ba | Sqft | Sold | Price | $/sf | Match |
|---|---|---|---|---|---|---|---|
| 3920 Murvon St | 0.15mi | 3/1.0 (+1) | 1,047 (+5%) | 10mo | $80,000 | $76 | 71 |
| 4131 Henry St | 0.53mi | 2/1.0 | 1,056 (+6%) | 0mo | $42,000 | $40 | 64 |
| 5114 Ellison St | 0.41mi | 3/1.0 (+1) | 1,014 (+2%) | 19mo | $41,500 | $41 | 56 |
| 3938 Mayfield St | 0.23mi | 3/1.0 (+1) | 860 (-13%) | 9mo | $8,000 | $9 | 54 |
| 3809 Morrow St | 0.20mi | 3/1.0 (+1) | 917 (-8%) | 22mo | $48,750 | $53 | 54 |
| 3938 Pixley Dr | 0.51mi | 3/1.0 (+1) | 1,047 (+5%) | 14mo | $70,000 | $67 | 50 |
| 3250 Wagner St | 0.74mi | 2/1.0 | 1,044 (+5%) | 8mo | $29,500 | $28 | 50 |
| 5415 Norton St | 0.27mi | 3/1.0 (+1) | 862 (-13%) | 19mo | $36,000 | $42 | 45 |
| 4144 Clover St | 0.52mi | 3/1.0 (+1) | 884 (-11%) | 10mo | $11,200 | $13 | 44 |
| 3929 Pixley | 0.54mi | 3/1.0 (+1) | 1,100 (+11%) | 19mo | $64,500 | $59 | 36 |
| 3721 Doris | 0.60mi | 2/1.0 | 856 (-14%) | 18mo | $45,000 | $53 | 34 |
Match score weights: distance 35% · size 25% · config 20% · recency 20%. Top-matched comps best support the ARV.
Projected returns pro-forma
-1.18% appreciation · 3.0% rent growth · sell at horizon
- IRR
- —
- Equity multiple
- 24.50×
- Total profit
- $36,184
- Equity at exit
- $1,280
- IRR
- —
- Equity multiple
- 52.40×
- Total profit
- $79,148
- Equity at exit
- $1,304
Cash invested: $1,540 (down + closing). Projections, not guarantees.
Landlord ↔ Tenant lean methodology
- Overall (STATE)
- 90 Strongly Landlord-Friendly
- State Louisiana
- 90 Strongly Landlord-Friendly · R+12
- County
- — inherits STATE
- City
- — inherits STATE
ZIP-level market 71109
- Home prices YoY
- -2.1%
- Active inventory
- 125
- Price-to-rent
- 0.6×
Monthly cashflow live
- Estimated rent
- $791 high interval (Pro) →
- Mortgage (P&I)
- −$29
- Tax from tax record
- −$19 /mo · $229/yr
- Insurance
- −$2
- HOA
- −$0
- Vacancy / Maint / Mgmt
- −$166
- Net cashflow
- $575
Break-even live
Sensitivity live
| Price | -10% $578 | -5% $577 | +0% $575 | +5% $573 | +10% $572 |
|---|---|---|---|---|---|
| Rent | -10% $513 | -5% $544 | +0% $575 | +5% $606 | +10% $638 |
| Rate | -1.0pp $578 | -0.5pp $576 | base $575 | +0.5pp $574 | +1.0pp $572 |
UW: 25.0% down · 7.5% · 30yr · 1.5% tax · 5.0% vac · 8.0% maint · 8.0% mgmt
Financing live
Cash to close
- Down payment
- $1,375
- Closing costs
- $165
- Reserves months
- —
- Total cash needed
- —
Loan-product check · same deal, 3 products live
Conventional
25% down · 7.5% · 30yr
- Down + closing
- —
- Monthly P&I
- —
- Monthly cashflow
- —
- DSCR
- —
- Eligible?
- —
Personal DTI + credit; lowest rate.
DSCR
20% down · 8.5% · 30yr
- Down + closing
- —
- Monthly P&I
- —
- Monthly cashflow
- —
- DSCR
- —
- Eligible?
- —
No personal income docs; deal must DSCR.
Hard money
10% down · 12.0% · 12mo
- Down + closing
- —
- Monthly P&I
- —
- Monthly cashflow
- —
- DSCR
- —
- Eligible?
- —
Short-term bridge; refi at stabilization.
Rent comps 9 comps
| Address | Beds | Baths | Sqft | Rent | $/sqft | DOM | Units | Dist |
|---|---|---|---|---|---|---|---|---|
| 3530 Pleasant Dr Shreveport, LA | 2.0 | 1.0 | 750 | $725 | $0.97 | 22d | 1 | 0.47mi |
| 3051 Amherst St Shreveport, LA | 3.0 | 1.0 | 994 | $595 | $0.60 | 45d | 1 | 0.97mi |
| 5306 Prentiss Ave Shreveport, LA | 3.0 | 1.0 | 957 | $975 | $1.02 | 45d | 1 | 1.08mi |
| 4025 Golf Links Blvd Shreveport, LA | 1.0 | 1.0 | 660 | $678 | $1.03 | 45d | 1 | 1.19mi |
| 4122 Cherokee St Apt 4 Shreveport, LA | 2.0 | 1.0 | 960 | $850 | $0.89 | 45d | 1 | 1.30mi |
| 4122 Cherokee St Apt 4 Shreveport, LA | 2.0 | 1.0 | 750 | $850 | $1.13 | 22d | 1 | 1.30mi |
| 2762 Marquette St Shreveport, LA | 3.0 | 1.0 | 1054 | $1,000 | $0.95 | 22d | 1 | 1.38mi |
| 2721 Sunnybrook St Shreveport, LA | 3.0 | 1.0 | 913 | $1,000 | $1.10 | 45d | 1 | 1.39mi |
| 2641 Valley Ridge Rd Shreveport, LA | 3.0 | 1.0 | 1045 | $725 | $0.69 | 22d | 1 | 1.39mi |
Listing history 7 events
-
2026-06-01days on market $5,500 Active 32 DOM
-
2026-05-31days on market $5,500 Active 31 DOM
-
2026-05-30days on market $5,500 Active 30 DOM
-
2026-04-30$5,500 Active
-
2024-02-27historical
-
2023-09-05$17,000 Active
-
2021-07-08soldstatus $40,000
ⓘ Source: listings_history table (triggers on properties + properties_extension) + one-shot
backfill from property_details.listing_events for pre-trigger history.
Tax reassessment forecast LA · Resets to sale price
- Current annual tax
- $229 · $19/mo
- Projected year-2 tax
- $229 · $19/mo
- Expected delta
- $0/yr ($0/mo · -0.0%)
ⓘ Screening estimate from a state-policy table — verify with the county assessor before closing.
Climate risk First Street
- Flood 1/10 Low FEMA zone X (unshaded) · 0% chance over 30 yrs
- Wildfire 1/10 Low
- Heat 7/10 Severe 7 d/yr ≥110°F today · 22 d/yr by 30 yrs out
- Wind 6/10 Major 68% chance of damaging wind over 30 yrs
- Air quality 2/10 Low 1 unhealthy d/yr today · 1 by 30 yrs out
Nearby sold comps map
Loading sold comps map…
Walkable amenities ~0.75 mi
Loading nearby amenities…
Taxation est. · year 1
- Rental income
- $9,497
- − Mortgage interest
- −$308
- − Property taxes
- −$229
- − Insurance
- −$28
- − Repairs & maintenance
- −$760
- − Management
- −$760
- − Depreciation
- −$160
- Taxable income
- $7,253
- Est. tax owed @ 24.0%
- −$1,741
- After-tax cash flow
- $5,160/yr
For passive investors: Depreciation is non-cash, so a rental often shows a tax loss while cash-flowing — sheltering income. Rental losses are passive: they offset passive income freely, and up to $25,000/yr can offset ordinary (W-2) income if you actively participate and your MAGI is under $100k (phasing out to $0 by $150k); unused losses carry forward. On sale, claimed depreciation is recaptured at up to 25%, and gains may owe capital-gains tax (a 1031 exchange can defer both). Figures are a year-1 estimate at your 24.0% rate — not tax advice; consult a CPA.
Schools (NCES district)
- District
- Caddo Parish
- NCES district ID
- 2200300
- Math proficiency
- 21% ▼ -33.00%
- Reading proficiency
- 32% ▼ -30.00%
- Median HH income
- $39,227
- Composite
- 22.23/100
- National rank
- #8148
- State rank
- #53 of 98 in LA
Livability — Shreveport
- Score
- 59/100
- State rank
- #270
- US rank
- #19730
Category grades
Schools grade is shown separately in the Schools card above.
Census & demographics
- Census place
- Shreveport, LA
- County
- Caddo Parish · 178,536 people
- City population
- 164,123
- Metro
- Shreveport-Bossier City, LA
- Population (ZIP)
- 17,412
- Household income
- $32,939
- Rent vs Own
- Severe rent burden
- 1265.0
Population outlook (Caddo County) Hauer SSP2
- Today (2025)
- 243,190 people
- By 2030
- 237,231 · -2.5%
- By 2040
- 222,502 · -8.5%
- By 2050
- 206,516 · -15.1%
- By 2075
- 165,706 · -31.9%
- By 2100
- 122,262 · -49.7%
Race, ethnicity, and origin ACS 2023
- Neighborhood character
- Predominantly Black (95%)
- Race & ethnicity
- Black 95% White 4%
- Common ancestry
- Lithuanian 1%
- Foreign-born
- 0%
Political lean MEDSL · Caddo
- 2024 margin
- Toss-up / Even · D 51.6% · R 47.0% · Other 1.4%
- 2008→2024 swing
- +1.6pp toward D · 2008: 3.0pp · 2024: 4.6pp
- All cycles
- 2024: D+4.6 2020: D+6.8 2016: D+4.2 2012: D+4.9 2008: D+3.0
Not yet ingested
- Civics
- —
Market trends
- HPI YoY
- ▼ -1.18%
- Current HPI
- 54.4158
- Rent YoY
- —
- Metro
- Shreveport-Bossier City, LA
- State GDP YoY
- ▲ 3.29%
- F500 in state
- 10
Industry mix (Fortune 500 HQ in LA)
| Industry | F500 HQs | Revenue |
|---|---|---|
| Telecommunications | 2 | $23B |
|
||
| Utilities | 1 | $12B |
|
||
| Wholesale / Distribution | 1 | $5B |
|
||
| Advertising | 1 | $2B |
|
||
Price history
-86.2% since first listed4 events — show timeline
- 2026-04-30 Listed $5,500 NTREIS
- 2024-02-27 Listing Removed — NTREIS
- 2023-09-05 Listed $17,000 NTREIS
- 2021-07-08 Sold (Public Records) $40,000 Public Records
Property tax history
+14.0%/yrLatest (2025): $229 · +0.4% YoY. Source: county tax records.
Cash-flow waterfall
monthlySold comps — $/sqft
last 12 mo · ≤1 miLoading sold comps…