26 Log Ln · Richland, WA
Flood risk 1/10 · Minimal
- FEMA flood zone
- X
- Chance of flooding over 30 yrs
- 0.0%
- Est. flood insurance / yr
- $507 – $1,088
Fire risk 5/10 · Moderate
- Est. fire insurance / yr
- $604 – $1,122
Heat risk 5/10 · Moderate
- Hot days now (above 99°F)
- 7 days/yr
- Hot days in 30 yrs
- 15 days/yr
Wind risk 1/10 · Minimal
- Chance of severe wind over 30 yrs
- —
Air-quality risk 7/10 · Major
- Unhealthy air days now
- 11 days/yr
- Unhealthy air days in 30 yrs
- 12 days/yr
Risk factors via First Street. Map © Google.
Why this score? — see what drove the B grade
The composite is a weighted blend of 9 inputs, each scored 0–100. Each bar is that input's sub-score; the figure is the points it added to the 100-point composite (weight × sub-score).
- Cash flow +30.0/30.0
- 1% rule +10.0/10.0
- DSCR +10.0/10.0
- ARV discount +7.5/15.0
- Schools +5.3/10.0
- Livability +4.0/5.0
- Rent growth +2.7/5.0
- Condition / age +2.5/5.0
- Appreciation +0.0/10.0
$32,000
🖨 Deal sheet (PDF) 📄 Offer letter ✓ Due diligence
Listing remarks MLS
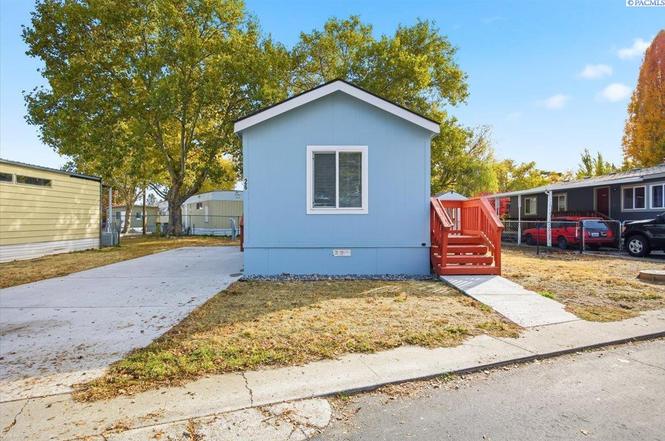
TWO BEDROOM TWO BATH DOUBLE WIDE HOME. BUILT IN CHINA HUTCH. THE HOME COMES WITH TWO STORAGE BUILDINGS AND A LARGE COVERED CARPOT. SHOW ANYTIME.
Key facts
- Bright living area
- Spacious bedroom
- New exterior paint
Tags
Neighborhood map
What this means for you Summary
Snapshot
- This is a 1-bed/1.0-bath single-family listed at $32k.
Deal economics
- At list price, monthly cash flow is $766 ($9k/yr) — positive.
- The deal already cash-flows at list — no discount required.
- Meets the 1% rule at list price ($1k rent vs $32k).
- Recommended offer: $28k (12.0% below list) — sets the bar for market timing.
- Cap rate 35.0% vs local median 2.8% in Richland — top-decile yield for the area; either an underpriced asset or a hidden risk that comps aren't pricing in. Stress-test before assuming the spread holds.
Location & tenants
- Location reads 79/100 on livability (#112 in WA, #2,258 nationally) — a middle-class / working-renter tenant base. Strengths: commute A+, housing A+, health & safety A+; Watch: cost of living C-, amenities F.
- Richland School District (urban): math 52% / reading 64% proficiency, ranked #61 of 291 in WA (top 21%) — acceptable for families but not a draw, mixed tenant base, ~2y average lease.
- Zoned schools: Sacajawea Elementary (458 students, 52% FRL); Chief Joseph Middle School (697 students, 67% FRL); Hanford High School (1,788 students, 35% FRL) — zoned schools average 51% FRL vs 29% district-wide (23 pts higher); higher-poverty schools than district average — tighter screening recommended.
- Market conditions: Rents flat; 132 active listings in the ZIP; 7 comparable units currently listed for rent nearby; rentals at typical pace (median 23d on market — plan ~3-4 weeks tenant-placement turnaround); solid renter incomes; 1,532 units permitted in Benton County in 2024 (389 in 5+ unit buildings).
- This rent is only 17% of the median local income ($92k/yr) — well below the 30% rent-burden line; pricing power to push rent on renewal without tenant pushback.
Forward outlook
- Local home prices are declining (-3.0%/yr); year-one equity from $221 of loan paydown is wiped out by about $960 of value loss. Plan a longer hold.
- Benton County population projected at +32% by 2050 — long-run rental-demand tailwind backs the buy-and-hold thesis.
- At projected returns (-3.0% appreciation + 0.6% rent growth), your $9k cash investment doubles in ~2 years — after that, you're playing with house money.
Negotiation context
- It's been on market 170 days — a 12% lower offer ($28k) is reasonable based on typical stale-listing flexibility.
- 2 sale attempts since 19y ago; this cycle's ask has dropped $20k (38%) from the opening price — seller is motivated, your offer sets the floor, not the list.
- Current owner paid $6k; list at $32k implies a 432% gain — meaningful room to come down on a strong offer.
Risks & watch-outs
- Climate carrying-cost: moderate wildfire risk; extreme-heat days projected 7→15/yr by 2055 (HVAC capex compounding) — expect insurance premiums to compound above CPI over the hold.
Questions for the listing agent
- It's been on market 170 days. Have you received any prior offers? Is the seller open to a 12% concession, seller financing, or rate buy-down credit?
- Why hasn't it sold? Are there any deal-killer items the seller is aware of (foundation, flood, title, zoning, code violations)?
- Is there a deadline driving the sale (1031 exchange, divorce, estate, relocation)? That informs how much negotiation room exists.
- Schools are A-rated — typically a magnet for longer-tenancy family renters. What's the average tenant stay here, and is there a school-zone premium baked into asking?
- What's the average days-on-market for RENTAL listings here right now (not sales)? A rising rental-DOM trend means longer vacancies and softer asking-rent achievability than the comps imply.
- What's the recent tenant-quality profile in this submarket — average credit score on applications, eviction rate, late-payment / NSF rate, and stable-employment percentage? A property-management company in the area should have these aggregated.
- How much new for-sale + rental construction is in the pipeline within 1–3 miles? Heavy new supply typically softens prices + rents 12–24 months out; constrained supply supports both.
Investment metrics
- 1% rule
- 3.98% ✓
- Cap rate
- 35.04%
- Cash-on-cash
- 102.65%
- DSCR
- 5.57
- GRM
- 2.1
CMA / ARV
No comps found within radius.
Projected returns pro-forma
-3.0% appreciation · 0.62% rent growth · sell at horizon
- IRR
- —
- Equity multiple
- 5.54×
- Total profit
- $40,686
- Equity at exit
- $4,771
- IRR
- —
- Equity multiple
- 10.68×
- Total profit
- $86,767
- Equity at exit
- $2,767
Cash invested: $8,960 (down + closing). Projections, not guarantees.
Landlord ↔ Tenant lean methodology
- Overall (STATE)
- 28 Tenant-Leaning
- State Washington
- 28 Tenant-Leaning · D+8
- County
- — inherits STATE
- City
- — inherits STATE
ZIP-level market 99354
- Rents YoY
- 0.6%
- Active inventory
- 132
- Price-to-rent
- 2.1×
Monthly cashflow live
- Estimated rent
- $1,272 high interval (Pro) →
- Mortgage (P&I)
- −$168
- Tax from tax record
- −$58 /mo · $691/yr
- Insurance
- −$13
- HOA
- −$0
- Vacancy / Maint / Mgmt
- −$267
- Net cashflow
- $766
Break-even live
Sensitivity live
| Price | -10% $785 | -5% $776 | +0% $766 | +5% $757 | +10% $748 |
|---|---|---|---|---|---|
| Rent | -10% $666 | -5% $716 | +0% $766 | +5% $817 | +10% $867 |
| Rate | -1.0pp $783 | -0.5pp $775 | base $766 | +0.5pp $758 | +1.0pp $750 |
UW: 25.0% down · 7.5% · 30yr · 1.5% tax · 5.0% vac · 8.0% maint · 8.0% mgmt
Financing live
Cash to close
- Down payment
- $8,000
- Closing costs
- $960
- Reserves months
- —
- Total cash needed
- —
Loan-product check · same deal, 3 products live
Conventional
25% down · 7.5% · 30yr
- Down + closing
- —
- Monthly P&I
- —
- Monthly cashflow
- —
- DSCR
- —
- Eligible?
- —
Personal DTI + credit; lowest rate.
DSCR
20% down · 8.5% · 30yr
- Down + closing
- —
- Monthly P&I
- —
- Monthly cashflow
- —
- DSCR
- —
- Eligible?
- —
No personal income docs; deal must DSCR.
Hard money
10% down · 12.0% · 12mo
- Down + closing
- —
- Monthly P&I
- —
- Monthly cashflow
- —
- DSCR
- —
- Eligible?
- —
Short-term bridge; refi at stabilization.
Rent comps 7 comps
| Address | Beds | Baths | Sqft | Rent | $/sqft | DOM | Units | Dist |
|---|---|---|---|---|---|---|---|---|
| 1900 Stevens Dr Richland, WA | 1.0–2.0 | 1.0 | 816 | $1,150 | $1.41 | 23d | 23 | 1.03mi |
| 1872 Alder Ave Unit A Richland, WA | 2.0 | 2.0 | 668 | $1,795 | $2.69 | 15d | 1 | 1.28mi |
| 2894 Salk Ave Richland, WA | 1.0–2.0 | 1.0–2.0 | 792 | $1,412 | $1.78 | 15d | 19 | 1.33mi |
| 200 Waldron St Richland, WA | 2.0 | 1.0 | 675 | $1,335 | $1.98 | 23d | 2 | 1.36mi |
| 1650 Mowry Sq Richland, WA | 1.0 | 1.0 | 643 | $1,260 | $1.96 | 23d | 1 | 1.44mi |
| 1621 George Washington Way Richland, WA | 1.0–3.0 | 1.0–2.0 | 907 | $999 | $1.10 | 23d | 1 | 1.47mi |
| 160 Van Giesen St Richland, WA | 1.0 | 1.0 | 636 | $1,115 | $1.75 | 23d | 1 | 1.48mi |
Listing history 9 events
-
2026-06-22statusdays on market $32,000 Active 170 DOM
-
2026-04-20status Pending
-
2026-03-02price $32,000
-
2026-01-28price $37,000
-
2026-01-05price $41,999
-
2025-12-02price $49,500
-
2025-11-03$52,000 Active
-
2007-06-12soldstatus $6,020 145-char remark
Show marketing remark (145 chars)
TWO BEDROOM TWO BATH DOUBLE WIDE HOME. BUILT IN CHINA HUTCH. THE HOME COMES WITH TWO STORAGE BUILDINGS AND A LARGE COVERED CARPOT. SHOW ANYTIME.
-
2007-05-19$4,900 145-char remark
Show marketing remark (145 chars)
TWO BEDROOM TWO BATH DOUBLE WIDE HOME. BUILT IN CHINA HUTCH. THE HOME COMES WITH TWO STORAGE BUILDINGS AND A LARGE COVERED CARPOT. SHOW ANYTIME.
ⓘ Source: listings_history table (triggers on properties + properties_extension) + one-shot
backfill from property_details.listing_events for pre-trigger history.
Tax reassessment forecast WA · Resets to sale price
- Current annual tax
- $691 · $58/mo
- Projected year-2 tax
- $691 · $58/mo
- Expected delta
- $0/yr ($0/mo · 0.0%)
ⓘ Screening estimate from a state-policy table — verify with the county assessor before closing.
Climate risk First Street
- Flood 1/10 Low FEMA zone X · 0% chance over 30 yrs
- Wildfire 5/10 Major
- Heat 5/10 Major 7 d/yr ≥99°F today · 15 d/yr by 30 yrs out
- Wind 1/10 Low
- Air quality 7/10 Severe 11 unhealthy d/yr today · 12 by 30 yrs out
Nearby sold comps map
Loading sold comps map…
Walkable amenities ~0.75 mi
Loading nearby amenities…
Taxation est. · year 1
- Rental income
- $15,269
- − Mortgage interest
- −$1,792
- − Property taxes
- −$691
- − Insurance
- −$160
- − Repairs & maintenance
- −$1,222
- − Management
- −$1,222
- − Depreciation
- −$931
- Taxable income
- $9,252
- Est. tax owed @ 24.0%
- −$2,220
- After-tax cash flow
- $6,977/yr
For passive investors: Depreciation is non-cash, so a rental often shows a tax loss while cash-flowing — sheltering income. Rental losses are passive: they offset passive income freely, and up to $25,000/yr can offset ordinary (W-2) income if you actively participate and your MAGI is under $100k (phasing out to $0 by $150k); unused losses carry forward. On sale, claimed depreciation is recaptured at up to 25%, and gains may owe capital-gains tax (a 1031 exchange can defer both). Figures are a year-1 estimate at your 24.0% rate — not tax advice; consult a CPA.
Schools (NCES district)
- District
- Richland School District
- NCES district ID
- 5307320
- Math proficiency
- 52% ▬ 0.00%
- Reading proficiency
- 64% ▼ -1.00%
- Median HH income
- $70,475
- Composite
- 53.04/100
- National rank
- #3244
- State rank
- #61 of 291 in WA
Livability — Richland
- Score
- 79/100
- State rank
- #112
- US rank
- #2258
Category grades
Schools grade is shown separately in the Schools card above.
Census & demographics
- Census place
- Richland, WA
- County
- Benton County · 186,895 people
- City population
- 62,989
- Metro
- Kennewick-Richland, WA
- Population (ZIP)
- 25,559
- Household income
- $91,933
- Rent vs Own
- Severe rent burden
- 545.0
Population outlook (Benton County) Hauer SSP2
- Today (2025)
- 219,421 people
- By 2030
- 233,813 · +6.6%
- By 2040
- 262,134 · +19.5%
- By 2050
- 290,100 · +32.2%
- By 2075
- 363,525 · +65.7%
- By 2100
- 418,667 · +90.8%
Race, ethnicity, and origin ACS 2023
- Neighborhood character
- Predominantly White (75%)
- Race & ethnicity
- White 75% Hispanic / Latino 14% Two or more races 10% Asian 4% Native American 1%
- Hispanic origin (detail)
- Mexican 12%
- Common ancestry
- Portuguese 4% Italian 4% Slovak 3%
- Foreign-born
- 6% · Canada, China, Vietnam
- Languages at home
- 89% English-only · Spanish 5% Russian/Polish/Slavic 1% Chinese 1%
Political lean MEDSL · Benton
- 2024 margin
- Strong R (+21.9) · D 37.7% · R 59.6% · Other 2.7%
- 2008→2024 swing
- +4.2pp toward D · 2008: -26.1pp · 2024: -21.9pp
- All cycles
- 2024: R+21.9 2020: R+21.0 2016: R+26.6 2012: R+27.0 2008: R+26.1
Not yet ingested
- Civics
- —
Market trends
- HPI YoY
- ▼ -353.00%
- Current HPI
- 235.9082
- Rent YoY
- ▲ 0.62%
- Metro
- Kennewick-Richland, WA
- State GDP YoY
- ▲ 4.65%
- F500 in state
- 22
Industry mix (Fortune 500 HQ in WA)
| Industry | F500 HQs | Revenue |
|---|---|---|
| Retail | 2 | $269B |
|
||
| Technology / Retail | 1 | $638B |
|
||
| Technology | 1 | $245B |
|
||
| Telecommunications | 1 | $38B |
|
||
| Food / Beverage | 1 | $36B |
|
||
| Automotive / Trucks | 1 | $34B |
|
||
Price history
+553.1% since first listed8 events — show timeline
- 2026-04-20 Pending — PACMLS
- 2026-03-02 Price Changed $32,000 PACMLS
- 2026-01-28 Price Changed $37,000 PACMLS
- 2026-01-05 Price Changed $41,999 PACMLS
- 2025-12-02 Price Changed $49,500 PACMLS
- 2025-11-03 Listed $52,000 PACMLS
- 2007-06-12 Sold (MLS) $6,020 PACMLS
- 2007-05-19 Listed $4,900 PACMLS
Property tax history
+16.8%/yrLatest (2026): $691 · -3.1% YoY. Source: county tax records.
Cash-flow waterfall
monthlySold comps — $/sqft
last 12 mo · ≤1 miLoading sold comps…