1112 Sir Henry Dr S · Ivanhoe, TX
Flood risk 1/10 · Minimal
- FEMA flood zone
- X (unshaded)
- Chance of flooding over 30 yrs
- 0.0%
- Est. flood insurance / yr
- $507 – $1,088
Fire risk 6/10 · Moderate
- Est. fire insurance / yr
- $1,222 – $2,270
Heat risk 8/10 · Major
- Hot days now (above 112°F)
- 7 days/yr
- Hot days in 30 yrs
- 24 days/yr
Wind risk 8/10 · Major
- Chance of severe wind over 30 yrs
- 99.0%
Air-quality risk 1/10 · Minimal
- Unhealthy air days now
- 0 days/yr
- Unhealthy air days in 30 yrs
- 0 days/yr
Risk factors via First Street. Map © Google.
Why this score? — see what drove the A- grade
The composite is a weighted blend of 9 inputs, each scored 0–100. Each bar is that input's sub-score; the figure is the points it added to the 100-point composite (weight × sub-score).
- Cash flow +30.0/30.0
- ARV discount +15.0/15.0
- DSCR +10.0/10.0
- Appreciation +10.0/10.0
- 1% rule +7.7/10.0
- Livability +3.1/5.0
- Schools +2.8/10.0
- Rent growth +2.5/5.0
- Condition / age +2.5/5.0
$110,000
🖨 Deal sheet 📄 Offer letter ✓ Due diligence
Listing remarks MLS
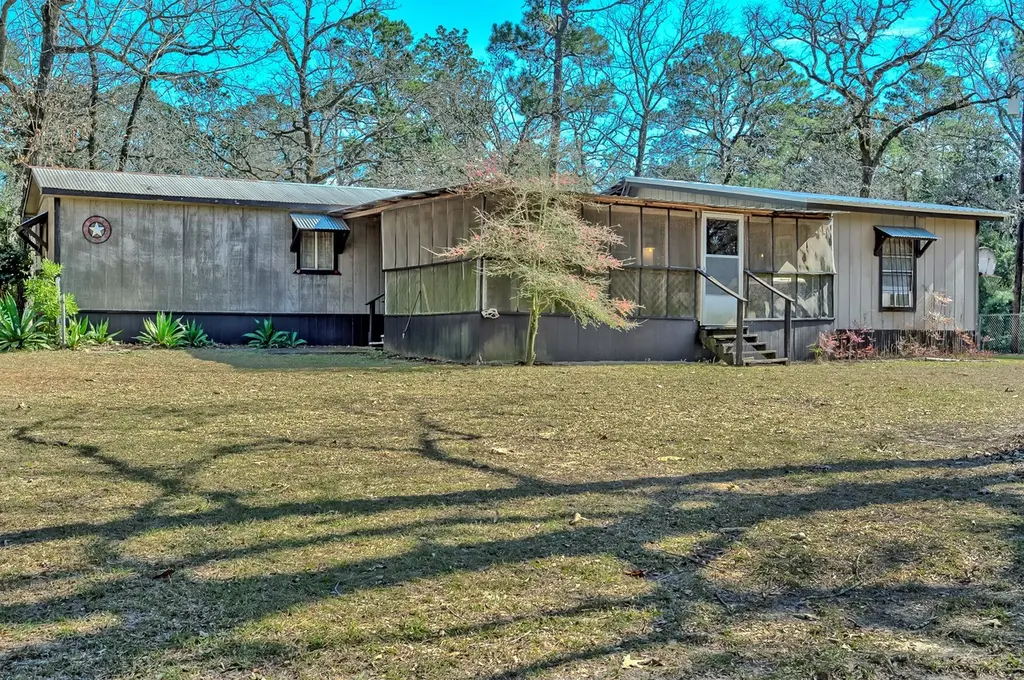
Tucked away in a quiet lakeside community, this charming retreat offers the kind of peace and escape that’s becoming harder to find. Whether you’re looking for a weekend getaway, a potential lake rental, or a full-time residence surrounded by nature, this property delivers the relaxed, unplugged lifestyle people dream about when they think “lake life.”
Key facts
- Durable metal roof
- Fully fenced yard
- 0.52 acre lot
Tags
Neighborhood map
What this means for you Summary
Snapshot
- This is a 3-bed/2.0-bath manufactured listed at $110k.
Deal economics
- At list price, monthly cash flow is $431 ($5k/yr) — positive.
- The deal already cash-flows at list — no discount required.
- Meets the 1% rule at list price ($1k rent vs $110k).
- Recommended offer: $97k (12.0% below list) — sets the bar for market timing.
- Cap rate 11.0% vs local median 3.5% in Ivanhoe — top-decile yield for the area; either an underpriced asset or a hidden risk that comps aren't pricing in. Stress-test before assuming the spread holds.
Location & tenants
- Location reads 62/100 on livability (#924 in TX) — a middle-class / working-renter tenant base. Strengths: cost of living A+, housing A+, crime A-; Watch: schools D, amenities F, commute F.
- Woodville ISD (town): math 34% / reading 34% proficiency, ranked #563 of 826 in TX (top 68%) — families likely to look elsewhere, expect single-tenant / working-renter base with shorter leases.
- Market conditions: 215 active listings in the ZIP; 5 units permitted in Tyler County in 2024 (0 in 5+ unit buildings).
- This rent runs 32% of the median local income ($52k/yr) — at the standard rent-burdened threshold; future hikes will face affordability resistance.
Forward outlook
- In year one you build about $12k of equity ($761 loan paydown + $11k appreciation (10.0% local appreciation)).
- Tyler County population projected at -12% by 2050 — secular population decline; favor cash flow + early exit over multi-decade hold.
- At projected returns (10.0% appreciation + 3.0% rent growth), your $31k cash investment doubles in ~2 years — after that, you're playing with house money.
- By year 4, paydown + projected appreciation supports a ~$42k cash-out refi (75% LTV) — recoverable capital for the next deal without selling this one.
Negotiation context
- It's been on market 142 days — a 12% lower offer ($97k) is reasonable based on typical stale-listing flexibility.
- 3 sale attempts since 2y ago; this cycle's ask has dropped $9k (8%) from the opening price — seller is motivated, your offer sets the floor, not the list.
Risks & watch-outs
- Climate carrying-cost: severe wind risk, 99% chance of damaging wind over 30y; major wildfire risk; extreme-heat days projected 7→24/yr by 2055 (HVAC capex compounding) — expect insurance premiums to compound above CPI over the hold.
Questions for the listing agent
- It's been on market 142 days. Have you received any prior offers? Is the seller open to a 12% concession, seller financing, or rate buy-down credit?
- What does the HOA fee cover, when was the last increase, and are there any pending special assessments or reserve-fund shortfalls?
- Why hasn't it sold? Are there any deal-killer items the seller is aware of (foundation, flood, title, zoning, code violations)?
- Is there a deadline driving the sale (1031 exchange, divorce, estate, relocation)? That informs how much negotiation room exists.
- Schools are D-rated, which usually means shorter tenancies and higher turnover. Who's the typical renter profile here, and what's been the actual vacancy rate?
- What's the average days-on-market for RENTAL listings here right now (not sales)? A rising rental-DOM trend means longer vacancies and softer asking-rent achievability than the comps imply.
- What's the recent tenant-quality profile in this submarket — average credit score on applications, eviction rate, late-payment / NSF rate, and stable-employment percentage? A property-management company in the area should have these aggregated.
- How much new for-sale + rental construction is in the pipeline within 1–3 miles? Heavy new supply typically softens prices + rents 12–24 months out; constrained supply supports both.
Investment metrics
- 1% rule
- 1.27% ✓
- Cap rate
- 10.99%
- Cash-on-cash
- 16.79%
- DSCR
- 1.75
- GRM
- 6.6
CMA / ARV
- ARV (median comp)
- $141,848
- List price
- $110,000
- Delta
- -22.45%
- Verdict
- UNDERPRICED
- Comps
- 1 within 2.0 mi
Projected returns pro-forma
10.0% appreciation · 3.0% rent growth · sell at horizon
- IRR
- 36.7%
- Equity multiple
- 3.83×
- Total profit
- $87,317
- Equity at exit
- $99,097
- IRR
- 31.6%
- Equity multiple
- 8.65×
- Total profit
- $235,489
- Equity at exit
- $213,706
Cash invested: $30,800 (down + closing). Projections, not guarantees.
Landlord ↔ Tenant lean methodology
- Overall (STATE)
- 87 Strongly Landlord-Friendly
- State Texas
- 87 Strongly Landlord-Friendly · R+5
- County
- — inherits STATE
- City
- — inherits STATE
ZIP-level market 75979
- Home prices YoY
- 20.6%
- Active inventory
- 215
- Price-to-rent
- 6.6×
Monthly cashflow live
- Estimated rent
- $1,396 medium interval (Pro) →
- Mortgage (P&I)
- −$577
- Tax from tax record
- −$49 /mo · $584/yr
- Insurance
- −$46
- HOA
- −$1
- Vacancy / Maint / Mgmt
- −$293
- Net cashflow
- $431
Break-even live
UW: 25.0% down · 7.5% · 30yr · 1.5% tax · 5.0% vac · 8.0% maint · 8.0% mgmt
Financing live
Cash to close
- Down payment
- $27,500
- Closing costs
- $3,300
- Reserves months
- —
- Total cash needed
- —
Loan-product check · same deal, 3 products live
Conventional
25% down · 7.5% · 30yr
- Down + closing
- —
- Monthly P&I
- —
- Monthly cashflow
- —
- DSCR
- —
- Eligible?
- —
Personal DTI + credit; lowest rate.
DSCR
20% down · 8.5% · 30yr
- Down + closing
- —
- Monthly P&I
- —
- Monthly cashflow
- —
- DSCR
- —
- Eligible?
- —
No personal income docs; deal must DSCR.
Hard money
10% down · 12.0% · 12mo
- Down + closing
- —
- Monthly P&I
- —
- Monthly cashflow
- —
- DSCR
- —
- Eligible?
- —
Short-term bridge; refi at stabilization.
HOA detail
- Monthly dues
- $1 · $12/yr
Listing history 24 events
-
2026-06-18days on market $110,000 Active 142 DOM
-
2026-06-17days on market $110,000 Active 141 DOM
-
2026-06-16days on market $110,000 Active 140 DOM
-
2026-06-15days on market $110,000 Active 139 DOM
-
2026-06-14days on market $110,000 Active 137 DOM
-
2026-06-10days on market $110,000 Active 134 DOM
-
2026-06-09days on market $110,000 Active 133 DOM
-
2026-06-08days on market $110,000 Active 132 DOM
-
2026-06-07days on market $110,000 Active 131 DOM
-
2026-06-03days on market $110,000 Active 127 DOM
-
2026-06-02days on market $110,000 Active 126 DOM
-
2026-06-01days on market $110,000 Active 125 DOM
-
2026-05-31days on market $110,000 Active 124 DOM
-
2026-05-31days on market $110,000 Active 123 DOM
-
2026-03-20price $110,000 378-char remark
Show marketing remark (378 chars)
Tucked away in a quiet lakeside community, this charming retreat offers the kind of peace and escape that’s becoming harder to find. Whether you’re looking for a weekend getaway, a potential lake rental, or a full-time residence surrounded by nature, this property delivers the relaxed, unplugged lifestyle people dream about when they think “lake life.”
-
2026-01-27$119,000 Active 378-char remark
Show marketing remark (378 chars)
Tucked away in a quiet lakeside community, this charming retreat offers the kind of peace and escape that’s becoming harder to find. Whether you’re looking for a weekend getaway, a potential lake rental, or a full-time residence surrounded by nature, this property delivers the relaxed, unplugged lifestyle people dream about when they think “lake life.”
-
2025-07-03historical
-
2024-10-23status Active
-
2024-10-12status Option Pending
-
2024-10-07status Pending
-
2024-09-06price $75,000
-
2024-09-06price $79,000
-
2024-08-30$75,000 Active
-
2005-06-17soldstatus
ⓘ Source: listings_history table (triggers on properties + properties_extension) + one-shot
backfill from property_details.listing_events for pre-trigger history.
Tax reassessment forecast TX · Resets to sale price
- Current annual tax
- $584 · $49/mo
- Projected year-2 tax
- $2,013 · $168/mo
- Expected delta
- +$1,429/yr (+$119/mo · 244.7%)
ⓘ Screening estimate from a state-policy table — verify with the county assessor before closing.
Climate risk First Street
- Flood 1/10 Low FEMA zone X (unshaded) · 0% chance over 30 yrs
- Wildfire 6/10 Major
- Heat 8/10 Severe 7 d/yr ≥112°F today · 24 d/yr by 30 yrs out
- Wind 8/10 Severe 99% chance of damaging wind over 30 yrs
- Air quality 1/10 Low 0 unhealthy d/yr today · 0 by 30 yrs out
Nearby sold comps map
Loading sold comps map…
Walkable amenities ~0.75 mi
Loading nearby amenities…
Taxation est. · year 1
- Rental income
- $16,757
- − Mortgage interest
- −$6,162
- − Property taxes
- −$584
- − Insurance
- −$550
- − Repairs & maintenance
- −$1,341
- − Management
- −$1,341
- − HOA
- −$12
- − Depreciation
- −$3,200
- Taxable income
- $3,569
- Est. tax owed @ 24.0%
- −$856
- After-tax cash flow
- $4,314/yr
For passive investors: Depreciation is non-cash, so a rental often shows a tax loss while cash-flowing — sheltering income. Rental losses are passive: they offset passive income freely, and up to $25,000/yr can offset ordinary (W-2) income if you actively participate and your MAGI is under $100k (phasing out to $0 by $150k); unused losses carry forward. On sale, claimed depreciation is recaptured at up to 25%, and gains may owe capital-gains tax (a 1031 exchange can defer both). Figures are a year-1 estimate at your 24.0% rate — not tax advice; consult a CPA.
Schools (NCES district)
- District
- Woodville ISD
- NCES district ID
- 4846440
- Math proficiency
- 34% ▼ -1.00%
- Reading proficiency
- 34% ▼ -3.00%
- Median HH income
- $36,581
- Composite
- 28.24/100
- National rank
- #6800
- State rank
- #563 of 826 in TX
Livability — Ivanhoe
- Score
- 62/100
- State rank
- #924
- US rank
- #16451
Category grades
Schools grade is shown separately in the Schools card above.
Census & demographics
- Census place
- Ivanhoe, TX
- County
- Tyler County · 11,273 people
- Metro
- nan
- Population (ZIP)
- 11,273
- Household income
- $51,594
- Rent vs Own
- Severe rent burden
- 117.0
Population outlook (Tyler County) Hauer SSP2
- Today (2025)
- 20,375 people
- By 2030
- 20,036 · -1.7%
- By 2040
- 19,150 · -6.0%
- By 2050
- 18,017 · -11.6%
- By 2075
- 15,300 · -24.9%
- By 2100
- 11,702 · -42.6%
Race, ethnicity, and origin ACS 2023
- Neighborhood character
- Predominantly White (68%)
- Race & ethnicity
- White 68% Black 17% Hispanic / Latino 12% Two or more races 7%
- Hispanic origin (detail)
- Mexican 10%
- Common ancestry
- Lithuanian 4% Slovak 1% Serbian 1%
- Foreign-born
- 5% · Canada, Vietnam
- Languages at home
- 90% English-only · Spanish 9%
Political lean MEDSL · Tyler
- 2024 margin
- Solid R (+73.5) · D 13.0% · R 86.5%
- 2008→2024 swing
- -29.5pp toward R · 2008: -44.0pp · 2024: -73.5pp
- All cycles
- 2024: R+73.5 2020: R+70.3 2016: R+67.2 2012: R+55.5 2008: R+44.0
Not yet ingested
- Civics
- —
Market trends
- HPI YoY
- ▲ 30.40%
- Current HPI
- 178.2196
- Rent YoY
- —
- Metro
- nan
- State GDP YoY
- ▲ 3.95%
- F500 in state
- 110
Industry mix (Fortune 500 HQ in TX)
| Industry | F500 HQs | Revenue |
|---|---|---|
| Energy | 16 | $1,198B |
|
||
| Technology | 5 | $198B |
|
||
| Engineering / Construction | 4 | $72B |
|
||
| Energy Services | 3 | $60B |
|
||
| Utilities | 3 | $41B |
|
||
| Healthcare | 2 | $330B |
|
||
Price history
+46.7% since first listed10 events — show timeline
- 2026-03-20 Price Changed $110,000 HARMLS
- 2026-01-27 Listed $119,000 HARMLS
- 2025-07-03 Listing Removed — HARMLS
- 2024-10-23 Relisted — HARMLS
- 2024-10-12 Pending — HARMLS
- 2024-10-07 Pending — HARMLS
- 2024-09-06 Price Changed $75,000 BBOR
- 2024-09-06 Price Changed $79,000 BBOR
- 2024-08-30 Listed $75,000 HARMLS
- 2005-06-17 Sold (Public Records) — Public Records
Property tax history
+4.4%/yrLatest (2025): $584 · +74.5% YoY. Source: county tax records.
Cash-flow waterfall
monthlySold comps — $/sqft
last 12 mo · ≤1 miLoading sold comps…