119 S Lagoon St · Rockaway Beach, OR
Flood risk 1/10 · Minimal
- FEMA flood zone
- X (unshaded)
- Chance of flooding over 30 yrs
- 0.0%
- Est. flood insurance / yr
- $507 – $1,088
Fire risk 2/10 · Minimal
- Est. fire insurance / yr
- $498 – $926
Heat risk 1/10 · Minimal
- Hot days now (above 76°F)
- 9 days/yr
- Hot days in 30 yrs
- 20 days/yr
Wind risk 1/10 · Minimal
- Chance of severe wind over 30 yrs
- —
Air-quality risk 6/10 · Moderate
- Unhealthy air days now
- 8 days/yr
- Unhealthy air days in 30 yrs
- 9 days/yr
Risk factors via First Street. Map © Google.
Why this score? — see what drove the B- grade
The composite is a weighted blend of 9 inputs, each scored 0–100. Each bar is that input's sub-score; the figure is the points it added to the 100-point composite (weight × sub-score).
- Cash flow +30.0/30.0
- DSCR +10.0/10.0
- 1% rule +8.4/10.0
- ARV discount +6.4/15.0
- Schools +4.2/10.0
- Livability +3.7/5.0
- Rent growth +2.5/5.0
- Condition / age +2.5/5.0
- Appreciation +0.0/10.0
$449,000
🖨 Deal sheet 📄 Offer letter ✓ Due diligence
Listing remarks MLS
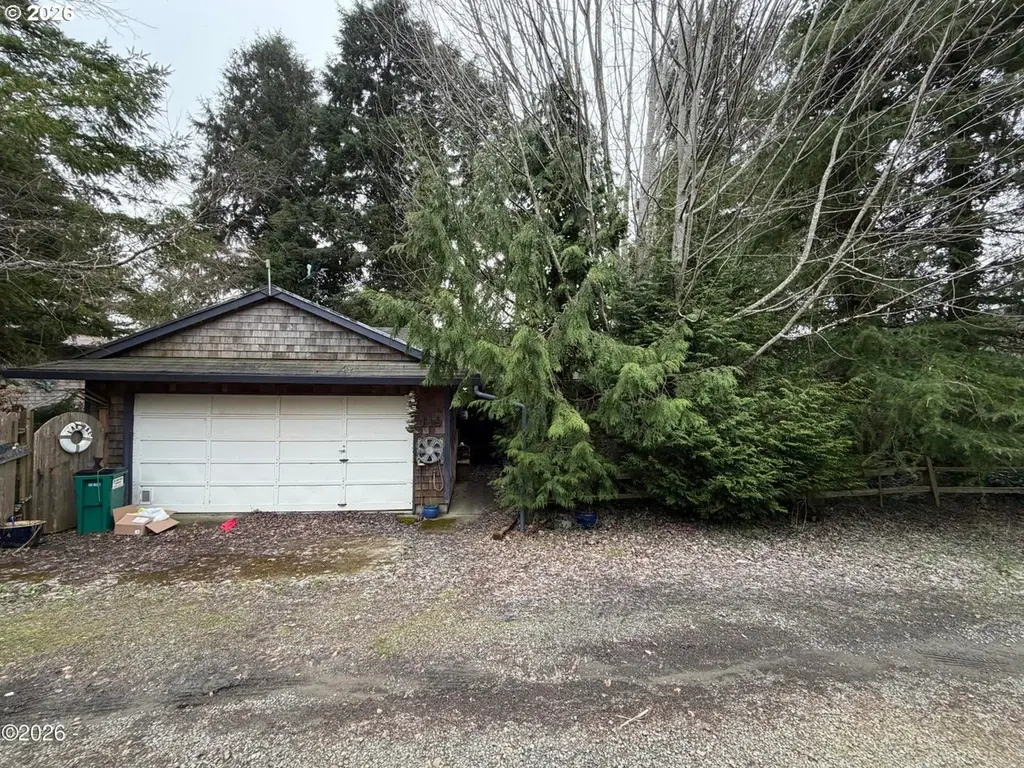
3 bedroom 2 bath home located in a private and quiet location of Rockaway Beach! The property features a 960 sqft shop with a woodstove. Newer cedar shingle siding and vinyl windows installed. Inside the house you'll find a beautiful brick hearth with a Fisher woodstove. Large .20 acre lot, which is made up of 5 city lots. Fully fenced private yard featuring a fire pit and hot tub. Property is located just blocks from public beach access. Showings are by appointment only. Call today for more details.
Key facts
- 960 sqft shop
- Hot tub
- Brick hearth
Tags
Neighborhood map
What this means for you Summary
Snapshot
- This is a 3-bed/2.0-bath single-family listed at $449k.
Deal economics
- At list price, monthly cash flow is $2k ($24k/yr) — positive.
- The deal already cash-flows at list — no discount required.
- Meets the 1% rule at list price ($6k rent vs $449k).
- Recommended offer: $395k (12.0% below list) — sets the bar for market timing.
- Cap rate 11.6% vs local median 6.6% in Rockaway Beach — top-decile yield for the area; either an underpriced asset or a hidden risk that comps aren't pricing in. Stress-test before assuming the spread holds.
Location & tenants
- Location reads 74/100 on livability (#94 in OR, #4,777 nationally) — a middle-class / working-renter tenant base. Strengths: crime A+, housing A+, cost of living A-; Watch: health & safety C-, employment D, amenities F.
- Neah-Kah-Nie SD 56 (rural): math 39% / reading 55% proficiency, ranked #62 of 183 in OR (top 34%) — families likely to look elsewhere, expect single-tenant / working-renter base with shorter leases.
- Market conditions: 126 active listings in the ZIP; 1 comparable units currently listed for rent nearby; 86 units permitted in Tillamook County in 2024 (0 in 5+ unit buildings).
Forward outlook
- Local home prices are declining (-3.0%/yr); year-one equity from $3k of loan paydown is wiped out by about $13k of value loss. Plan a longer hold.
- Tillamook County population projected at +3% by 2050 — modest demand growth; plan on rents tracking national, not racing it.
- At projected returns (-3.0% appreciation + 3.0% rent growth), your $126k cash investment doubles in ~7 years — after that, you're playing with house money.
Negotiation context
- It's been on market 131 days — a 12% lower offer ($395k) is reasonable based on typical stale-listing flexibility.
- 2 sale attempts; this cycle's ask has dropped $24k (5%) from the opening price — seller is motivated, your offer sets the floor, not the list.
Questions for the listing agent
- It's been on market 131 days. Have you received any prior offers? Is the seller open to a 12% concession, seller financing, or rate buy-down credit?
- Why hasn't it sold? Are there any deal-killer items the seller is aware of (foundation, flood, title, zoning, code violations)?
- Is there a deadline driving the sale (1031 exchange, divorce, estate, relocation)? That informs how much negotiation room exists.
- What's the average days-on-market for RENTAL listings here right now (not sales)? A rising rental-DOM trend means longer vacancies and softer asking-rent achievability than the comps imply.
- What's the recent tenant-quality profile in this submarket — average credit score on applications, eviction rate, late-payment / NSF rate, and stable-employment percentage? A property-management company in the area should have these aggregated.
- How much new for-sale + rental construction is in the pipeline within 1–3 miles? Heavy new supply typically softens prices + rents 12–24 months out; constrained supply supports both.
Investment metrics
- 1% rule
- 1.34% ✓
- Cap rate
- 11.57%
- Cash-on-cash
- 18.86%
- DSCR
- 1.84
- GRM
- 6.2
CMA / ARV
- ARV (median comp)
- $438,640
- List price
- $449,000
- Delta
- 2.36%
- Verdict
- FAIR
- Comps
- 20 within 1.0 mi
Show comp detail 12 sales within ~0.75 mi
| Address | Dist | Beds/Ba | Sqft | Sold | Price | $/sf | Match |
|---|---|---|---|---|---|---|---|
| 101 S Quadrant St | 0.17mi | 3/3.0 | 1,410 (+3%) | 6mo | $435,000 | $309 | 78 |
| 123 S Ocean St | 0.10mi | 2/2.0 (-1) | 1,308 (-4%) | 8mo | $407,000 | $311 | 76 |
| 126 N Ocean Ave | 0.17mi | 3/2.0 | 1,456 (+7%) | 7mo | $640,000 | $440 | 75 |
| 1430 N Cedar Creek Cir | 0.29mi | 3/2.0 | 1,408 (+3%) | 10mo | $508,000 | $361 | 73 |
| 407 S 2nd Ave | 0.26mi | 2/2.0 (-1) | 1,327 (-3%) | 6mo | $314,000 | $237 | 73 |
| 115 N Miller St Unit 303 I | 0.43mi | 2/2.0 (-1) | 1,320 (-3%) | 3mo | $43,250 | $33 | 67 |
| 115 N Miller St #103 | 0.43mi | 2/2.0 (-1) | 1,320 (-3%) | 4mo | $32,000 | $24 | 67 |
| 115 N Miller St Unit 103 I | 0.43mi | 2/2.0 (-1) | 1,320 (-3%) | 4mo | $32,000 | $24 | 66 |
| 115 N Miller St Unit 103 Trk H | 0.43mi | 2/2.0 (-1) | 1,320 (-3%) | 8mo | $29,900 | $23 | 63 |
| 115 N Miller St #103 | 0.43mi | 2/2.0 (-1) | 1,320 (-3%) | 8mo | $29,900 | $23 | 63 |
| 247 S Dolphin St | 0.32mi | 4/1.0 (+1) | 1,272 (-7%) | 9mo | $349,000 | $274 | 58 |
| 633 N Pacific St | 0.62mi | 4/2.0 (+1) | 1,514 (+11%) | 3mo | $795,000 | $525 | 45 |
Match score weights: distance 35% · size 25% · config 20% · recency 20%. Top-matched comps best support the ARV.
Projected returns pro-forma
-3.0% appreciation · 3.0% rent growth · sell at horizon
- IRR
- 10.7%
- Equity multiple
- 1.42×
- Total profit
- $52,957
- Equity at exit
- $66,947
- IRR
- 19.7%
- Equity multiple
- 2.65×
- Total profit
- $207,665
- Equity at exit
- $38,821
Cash invested: $125,720 (down + closing). Projections, not guarantees.
Landlord ↔ Tenant lean methodology
- Overall (STATE)
- 28 Tenant-Leaning
- State Oregon
- 28 Tenant-Leaning · D+6
- County
- — inherits STATE
- City
- — inherits STATE
ZIP-level market 97136
- Home prices YoY
- -34.6%
- Active inventory
- 126
- Price-to-rent
- 6.2×
Monthly cashflow live
- Estimated rent
- $6,000 medium interval (Pro) →
- Mortgage (P&I)
- −$2,355
- Tax from tax record
- −$223 /mo · $2,672/yr
- Insurance
- −$187
- HOA
- −$0
- Vacancy / Maint / Mgmt
- −$1,260
- Net cashflow
- $1,976
Break-even live
UW: 25.0% down · 7.5% · 30yr · 1.5% tax · 5.0% vac · 8.0% maint · 8.0% mgmt
Financing live
Cash to close
- Down payment
- $112,250
- Closing costs
- $13,470
- Reserves months
- —
- Total cash needed
- —
Loan-product check · same deal, 3 products live
Conventional
25% down · 7.5% · 30yr
- Down + closing
- —
- Monthly P&I
- —
- Monthly cashflow
- —
- DSCR
- —
- Eligible?
- —
Personal DTI + credit; lowest rate.
DSCR
20% down · 8.5% · 30yr
- Down + closing
- —
- Monthly P&I
- —
- Monthly cashflow
- —
- DSCR
- —
- Eligible?
- —
No personal income docs; deal must DSCR.
Hard money
10% down · 12.0% · 12mo
- Down + closing
- —
- Monthly P&I
- —
- Monthly cashflow
- —
- DSCR
- —
- Eligible?
- —
Short-term bridge; refi at stabilization.
Rent comps 1 comps
| Address | Beds | Baths | Sqft | Rent | $/sqft | DOM | Units | Dist |
|---|---|---|---|---|---|---|---|---|
| 145 N Dolphin St Rockaway Beach, OR | 2.0 | 2.0 | 1020 | $6,000 | $5.88 | 44d | 1 | 0.27mi |
Listing history 18 events
-
2026-06-18days on market $449,000 Active 131 DOM
-
2026-06-17days on market $449,000 Active 130 DOM
-
2026-06-16days on market $449,000 Active 129 DOM
-
2026-06-15days on market $449,000 Active 128 DOM
-
2026-06-13days on market $449,000 Active 126 DOM
-
2026-06-12days on market $449,000 Active 125 DOM
-
2026-06-09days on market $449,000 Active 122 DOM
-
2026-06-08days on market $449,000 Active 121 DOM
-
2026-06-08days on market $449,000 Active 120 DOM
-
2026-06-07pricedays on market $449,000 Active 119 DOM
-
2026-06-04days on market $460,000 Active 116 DOM
-
2026-06-02days on market $460,000 Active 115 DOM
-
2026-06-01days on market $460,000 Active 114 DOM
-
2026-05-31days on market $460,000 Active 113 DOM
-
2026-04-03price $460,000 505-char remark
Show marketing remark (505 chars)
3 bedroom 2 bath home located in a private and quiet location of Rockaway Beach! The property features a 960 sqft shop with a woodstove. Newer cedar shingle siding and vinyl windows installed. Inside the house you'll find a beautiful brick hearth with a Fisher woodstove. Large .20 acre lot, which is made up of 5 city lots. Fully fenced private yard featuring a fire pit and hot tub. Property is located just blocks from public beach access. Showings are by appointment only. Call today for more details.
-
2026-02-07$473,000 Active 505-char remark
Show marketing remark (505 chars)
3 bedroom 2 bath home located in a private and quiet location of Rockaway Beach! The property features a 960 sqft shop with a woodstove. Newer cedar shingle siding and vinyl windows installed. Inside the house you'll find a beautiful brick hearth with a Fisher woodstove. Large .20 acre lot, which is made up of 5 city lots. Fully fenced private yard featuring a fire pit and hot tub. Property is located just blocks from public beach access. Showings are by appointment only. Call today for more details.
ⓘ Source: listings_history table (triggers on properties + properties_extension) + one-shot
backfill from property_details.listing_events for pre-trigger history.
Tax reassessment forecast OR · Resets to sale price
- Current annual tax
- $2,672 · $223/mo
- Projected year-2 tax
- $4,355 · $363/mo
- Expected delta
- +$1,684/yr (+$140/mo · 63.0%)
ⓘ Screening estimate from a state-policy table — verify with the county assessor before closing.
Climate risk First Street
- Flood 1/10 Low FEMA zone X (unshaded) · 0% chance over 30 yrs
- Wildfire 2/10 Low
- Heat 1/10 Low 9 d/yr ≥76°F today · 20 d/yr by 30 yrs out
- Wind 1/10 Low
- Air quality 6/10 Major 8 unhealthy d/yr today · 9 by 30 yrs out
Nearby sold comps map
Loading sold comps map…
Walkable amenities ~0.75 mi
Loading nearby amenities…
Taxation est. · year 1
- Rental income
- $72,000
- − Mortgage interest
- −$25,151
- − Property taxes
- −$2,672
- − Insurance
- −$2,245
- − Repairs & maintenance
- −$5,760
- − Management
- −$5,760
- − Depreciation
- −$13,062
- Taxable income
- $17,351
- Est. tax owed @ 24.0%
- −$4,164
- After-tax cash flow
- $19,544/yr
For passive investors: Depreciation is non-cash, so a rental often shows a tax loss while cash-flowing — sheltering income. Rental losses are passive: they offset passive income freely, and up to $25,000/yr can offset ordinary (W-2) income if you actively participate and your MAGI is under $100k (phasing out to $0 by $150k); unused losses carry forward. On sale, claimed depreciation is recaptured at up to 25%, and gains may owe capital-gains tax (a 1031 exchange can defer both). Figures are a year-1 estimate at your 24.0% rate — not tax advice; consult a CPA.
Schools (NCES district)
- District
- Neah-Kah-Nie SD 56
- NCES district ID
- 4108650
- Math proficiency
- 39% ▼ -4.00%
- Reading proficiency
- 55% ▼ -4.00%
- Median HH income
- $42,437
- Composite
- 41.68/100
- National rank
- #7205
- State rank
- #62 of 183 in OR
Livability — Rockaway Beach
- Score
- 74/100
- State rank
- #94
- US rank
- #4777
Category grades
Schools grade is shown separately in the Schools card above.
Census & demographics
- Census place
- Rockaway Beach, OR
- Population (ZIP)
- 2,422
Population outlook (Tillamook County) Hauer SSP2
- Today (2025)
- 26,318 people
- By 2030
- 26,603 · +1.1%
- By 2040
- 26,898 · +2.2%
- By 2050
- 27,129 · +3.1%
- By 2075
- 27,858 · +5.9%
- By 2100
- 26,212 · -0.4%
Race, ethnicity, and origin ACS 2023
- Neighborhood character
- Predominantly White (94%)
- Race & ethnicity
- White 94% Hispanic / Latino 2% Two or more races 2% Asian 1%
- Common ancestry
- Slovak 4% Iranian 4% Portuguese 3%
- Foreign-born
- 2% · Canada
- Languages at home
- 93% English-only · Spanish 4% French/Haitian/Cajun 1% Other Indo-European 1%
Political lean MEDSL · Tillamook
- 2024 margin
- Toss-up / Even · D 47.9% · R 49.2% · Other 2.9%
- 2008→2024 swing
- -11.2pp toward R · 2008: 9.9pp · 2024: -1.4pp
- All cycles
- 2024: R+1.4 2020: R+1.7 2016: R+5.9 2012: D+4.7 2008: D+9.9
Not yet ingested
- Civics
- —
Market trends
- HPI YoY
- ▼ -121.02%
- Current HPI
- 228.3227
- Rent YoY
- —
- Metro
- —
- State GDP YoY
- ▲ 2.05%
- F500 in state
- 2
Industry mix (Fortune 500 HQ in OR)
| Industry | F500 HQs | Revenue |
|---|---|---|
| Consumer Goods | 1 | $51B |
|
||
Price history
-2.7% since first listed4 events — show timeline
- 2026-04-03 Price Changed $460,000 RMLS
- 2026-04-03 Price Changed $460,000 OCMLS
- 2026-02-07 Listed $473,000 OCMLS
- 2026-02-07 Listed $473,000 RMLS
Property tax history
+3.0%/yrLatest (2025): $2,672 · +8.6% YoY. Source: county tax records.
Cash-flow waterfall
monthlySold comps — $/sqft
last 12 mo · ≤1 miLoading sold comps…