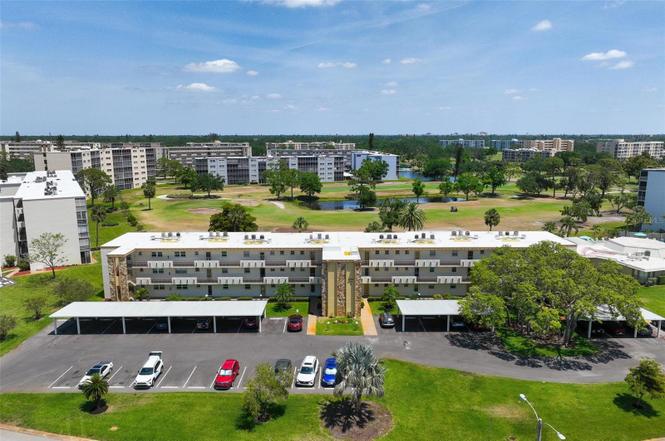
4200 Ironwood Cir Unit 203B · Bradenton, FL
Flood risk 1/10 · Minimal
- FEMA flood zone
- X (unshaded)
- Chance of flooding over 30 yrs
- 0.0%
- Est. flood insurance / yr
- $507 – $1,088
Fire risk 1/10 · Minimal
- Est. fire insurance / yr
- $947 – $1,759
Heat risk 10/10 · Severe
- Hot days now (above 106°F)
- 7 days/yr
- Hot days in 30 yrs
- 30 days/yr
Wind risk 10/10 · Severe
- Chance of severe wind over 30 yrs
- 99.0%
Air-quality risk 3/10 · Minor
- Unhealthy air days now
- 2 days/yr
- Unhealthy air days in 30 yrs
- 2 days/yr
Risk factors via First Street. Map © Google.
Why this score? — see what drove the C- grade
The composite is a weighted blend of 9 inputs, each scored 0–100. Each bar is that input's sub-score; the figure is the points it added to the 100-point composite (weight × sub-score).
- Cash flow +16.1/30.0
- 1% rule +10.0/10.0
- ARV discount +7.5/15.0
- DSCR +5.0/10.0
- Schools +4.4/10.0
- Livability +4.0/5.0
- Condition / age +2.5/5.0
- Rent growth +2.4/5.0
- Appreciation +0.0/10.0
$110,000
🖨 Deal sheet 📄 Offer letter ✓ Due diligence
Listing remarks
Priced to sell - seller welcomes all offers. Totally updated throughout. This beautifully updated 1-bedroom, 1.5-bath condo offering sweeping views of the lush community golf course and a lifestyle of comfort convenience. ! From the moment you step inside, you'll appreciate the thoughtful upgrades throughout. The kitchen features- granite countertops and custom solid wood cabinets & all smart appliances. Both bathrooms have been tastefully updated as well. The bright open living space flows seamlessly, creating a welcoming atmosphere for both everyday living and entertaining. Enjoy your morning coffee with tranquil golf course views, then take a short stroll to the nearby resort styl
Key facts
- Smart appliances
- Scenic nature trails
- Updated bathrooms
Tags
Property features AI
Finance
- Other: Association fee includes cable TV, pool, management, and recreational facilities
- Financial info: Total annual association fees $7,128; Lease restrictions apply
- HOA & community: Monthly condo fee (HOA) $594; Association management by Gulf Coast Association Mgmt.; Association approval required; Association amenities: clubhouse, fitness center, pool, recreation facilities, tennis courts, golf course access, laundry, storage, cable TV, maintenance; vehicle restrictions; Community features: buyer approval required, deed restrictions, fitness center, golf allowed (golf carts OK), pool, tennis courts, street lights, special community restrictions; Pets allowed: cats and dogs; Full-time management
Exterior
- Parking: Assigned parking; Off-street parking
- Security: Smoke detector(s)
- Utilities: Public water; Public sewer; Cable available and connected; BB/HS internet available; Electricity available and connected; Water and sewer available and connected
- Home design: Residential condominium; Located on 2nd floor of a 5-story building; Faces southwest; One-level living within the unit; Entry on level: One
- Construction: Concrete and stucco construction; Built-up roof; Block foundation; Building identified as 4200
- Exterior features: Lighting; Private mailbox; Storage; Tennis court(s); Outdoor kitchen; Storage (additional); Near/on golf course; Sidewalks; Mature landscaping; Paved roads
Interior
- Kitchen: Cooktop; Range; Dishwasher; Disposal; Refrigerator
- Bedrooms: 1 bedroom (located on floor 2)
- Flooring: Hardwood; Tile
- Bathrooms: 1 full bath; 1 half bath
- Heating & cooling: Central heating (electric); Central air conditioning
- Interior features: Built-in features; Eat-in kitchen; Living room/dining room combo; Open floorplan; Solid surface and stone counters; Solid wood cabinets; Walk-in closet(s); Window treatments (blinds, drapes, rods); Smoke detector(s)
- Laundry & utility: Common area laundry; Electric water heater
Neighborhood map
What this means for you Summary
Snapshot
- This is a 1-bed/1.5-bath condo listed at $110k.
Deal economics
- At list price, monthly cash flow is $56 ($673/yr) — positive.
- The deal already cash-flows at list — no discount required.
- Meets the 1% rule at list price ($2k rent vs $110k).
- Recommended offer: $97k (12.0% below list) — sets the bar for market timing.
- Cap rate 6.9% vs local median 3.6% in Bradenton — top-decile yield for the area; either an underpriced asset or a hidden risk that comps aren't pricing in. Stress-test before assuming the spread holds.
Location & tenants
- Location reads 81/100 on livability (#101 in FL, #1,528 nationally) — a professional / high-income tenant draw. Strengths: commute A+, cost of living A+, housing A+; Watch: employment D+, crime D, amenities F.
- Manatee (suburban): math 54% / reading 50% proficiency, ranked #26 of 73 in FL (top 36%) — acceptable for families but not a draw, mixed tenant base, ~2y average lease.
- Market conditions: Rents soft (-0.3%/yr); 510 active listings in the ZIP; 40 comparable units currently listed for rent nearby; rentals at typical pace (median 16d on market — plan ~3-4 weeks tenant-placement turnaround); solid renter incomes; 7,472 units permitted in Manatee County in 2024 (1,782 in 5+ unit buildings).
Forward outlook
- Local home prices are declining (-3.0%/yr); year-one equity from $761 of loan paydown is wiped out by about $3k of value loss. Plan a longer hold.
- Manatee County population projected at +43% by 2050 — long-run rental-demand tailwind backs the buy-and-hold thesis.
Negotiation context
- It's been on market 206 days — a 12% lower offer ($97k) is reasonable based on typical stale-listing flexibility.
- 8 sale attempts since 19y ago; this cycle's ask has dropped $30k (21%) from the opening price — seller is motivated, your offer sets the floor, not the list.
Risks & watch-outs
- Watch-outs: HOA is 33% of rent.
- Climate carrying-cost: severe wind risk, 99% chance of damaging wind over 30y; extreme-heat days projected 7→30/yr by 2055 (HVAC capex compounding) — expect insurance premiums to compound above CPI over the hold.
Questions for the listing agent
- It's been on market 206 days. Have you received any prior offers? Is the seller open to a 12% concession, seller financing, or rate buy-down credit?
- Built in 1971 — when were the roof, HVAC, electrical panel, plumbing, and water heater last replaced?
- What does the HOA fee cover, when was the last increase, and are there any pending special assessments or reserve-fund shortfalls?
- Any open or pending special assessments — roof, HVAC, plumbing, elevator, façade? What's the per-unit balance and payoff schedule, and is the seller paying it off at close or rolling it to the buyer?
- Why hasn't it sold? Are there any deal-killer items the seller is aware of (foundation, flood, title, zoning, code violations)?
- Is there a deadline driving the sale (1031 exchange, divorce, estate, relocation)? That informs how much negotiation room exists.
- Crime grade is D in this area — have there been break-ins, vandalism, or insurance claims at this property in the last 3 years? What carrier currently insures it and at what premium?
- What's the average days-on-market for RENTAL listings here right now (not sales)? A rising rental-DOM trend means longer vacancies and softer asking-rent achievability than the comps imply.
- What's the recent tenant-quality profile in this submarket — average credit score on applications, eviction rate, late-payment / NSF rate, and stable-employment percentage? A property-management company in the area should have these aggregated.
- How much new apartment / multifamily construction is in the pipeline within 1–3 miles? Heavy new supply (>2% of stock underway) typically softens rents 12–24 months out; light construction supports rent growth.
Investment metrics
- 1% rule
- 1.66% ✓
- Cap rate
- 6.90%
- Cash-on-cash
- 2.18%
- DSCR
- 1.10
- GRM
- 5.0
CMA / ARV
No comps found within radius.
Projected returns pro-forma
-3.0% appreciation · 0.0% rent growth · sell at horizon
- IRR
- -18.6%
- Equity multiple
- 0.38×
- Total profit
- $-19,185
- Equity at exit
- $16,401
- IRR
- -29.9%
- Equity multiple
- -0.01×
- Total profit
- $-31,080
- Equity at exit
- $9,511
Cash invested: $30,800 (down + closing). Projections, not guarantees.
Landlord ↔ Tenant lean methodology
- Overall (STATE)
- 87 Strongly Landlord-Friendly
- State Florida
- 87 Strongly Landlord-Friendly · R+3
- County
- — inherits STATE
- City
- — inherits STATE
ZIP-level market 34209
- Rents YoY
- -0.3%
- Active inventory
- 510
- Price-to-rent
- 5.0×
Monthly cashflow live
- Estimated rent
- $1,822 high interval (Pro) →
- Mortgage (P&I)
- −$577
- Tax from tax record
- −$167 /mo · $2,003/yr
- Insurance
- −$46
- HOA
- −$594
- Vacancy / Maint / Mgmt
- −$383
- Net cashflow
- $56
Break-even live
UW: 25.0% down · 7.5% · 30yr · 1.5% tax · 5.0% vac · 8.0% maint · 8.0% mgmt
Financing live
Cash to close
- Down payment
- $27,500
- Closing costs
- $3,300
- Reserves months
- —
- Total cash needed
- —
Loan-product check · same deal, 3 products live
Conventional
25% down · 7.5% · 30yr
- Down + closing
- —
- Monthly P&I
- —
- Monthly cashflow
- —
- DSCR
- —
- Eligible?
- —
Personal DTI + credit; lowest rate.
DSCR
20% down · 8.5% · 30yr
- Down + closing
- —
- Monthly P&I
- —
- Monthly cashflow
- —
- DSCR
- —
- Eligible?
- —
No personal income docs; deal must DSCR.
Hard money
10% down · 12.0% · 12mo
- Down + closing
- —
- Monthly P&I
- —
- Monthly cashflow
- —
- DSCR
- —
- Eligible?
- —
Short-term bridge; refi at stabilization.
Rent comps 40 comps
| Address | Beds | Baths | Sqft | Rent | $/sqft | DOM | Units | Dist |
|---|---|---|---|---|---|---|---|---|
| 4210 Ironwood Cir Unit 103J Bradenton, FL | 1.0 | 1.0 | 750 | $1,800 | $2.40 | 23d | 1 | 0.06mi |
| 4460 Ironwood Cir Unit 501A Bradenton, FL | 1.0 | 1.5 | 840 | $2,595 | $3.09 | 23d | 1 | 0.08mi |
| 4040 Ironwood Cir Unit 404F Bradenton, FL | 2.0 | 2.0 | 1008 | $1,750 | $1.74 | 11d | 1 | 0.09mi |
| 4040 Ironwood Cir Unit 406F Bradenton, FL | 2.0 | 2.0 | 1008 | $1,675 | $1.66 | 15d | 1 | 0.09mi |
| 4240 Ironwood Cir #404 Bradenton, FL | 2.0 | 2.0 | 1008 | $2,495 | $2.48 | 23d | 1 | 0.10mi |
| 4460 Ironwood Cir Unit 406 Bradenton, FL | 1.0 | 1.0 | 750 | $1,600 | $2.13 | 1d | 1 | 0.10mi |
| 4460 Ironwood Cir Unit 406 Bradenton, FL | 1.0 | 1.0 | 750 | $1,600 | $2.13 | 21d | 1 | 0.10mi |
| 4480 Ironwood Cir Unit 309 Bradenton, FL | 1.0 | 1.0 | 600 | $1,800 | $3.00 | 23d | 1 | 0.12mi |
| 4480 Ironwood Cir Unit 213A Bradenton, FL | 1.0 | 1.0 | 600 | $1,425 | $2.38 | 14d | 1 | 0.12mi |
| 4550 47th St W Bradenton, FL | 1.0–3.0 | 1.0–2.0 | 930 | $1,330 | $1.43 | 1d | 27 | 0.39mi |
| 4457 45th Ave W #211 Bradenton, FL | 2.0 | 2.0 | 912 | $1,950 | $2.14 | 15d | 1 | 0.44mi |
| 4802 51st St W Bradenton, FL | 1.0–2.0 | 1.0–2.0 | 1007 | $1,200 | $1.19 | 3d | 13 | 0.50mi |
| 4802 51st St W Bradenton, FL | 1.0–2.0 | 1.0–2.0 | 1007 | $1,249 | $1.24 | 15d | 15 | 0.50mi |
| 4801 47th Ave W Bradenton, FL | 1.0–3.0 | 1.0–2.0 | 1016 | $1,415 | $1.39 | 1d | 32 | 0.53mi |
| 4325 40th St W Bradenton, FL | 1.0–2.0 | 1.0–2.0 | 775 | $1,325 | $1.71 | 10d | 9 | 0.58mi |
| 4850 51st St W Bradenton, FL | 1.0–2.0 | 1.0–2.0 | 800 | $1,200 | $1.50 | 14d | 3 | 0.58mi |
| 4850 51st St W Bradenton, FL | 1.0–2.0 | 1.0–2.0 | 800 | $1,199 | $1.50 | 3d | 2 | 0.58mi |
| 4118 59th St W Bradenton, FL | 2.0 | 1.0 | 756 | $1,800 | $2.38 | 15d | 1 | 0.60mi |
| 4449 46th Ave W Unit 4449 Bradenton, FL | 2.0 | 1.0 | 1110 | $3,200 | $2.88 | 23d | 1 | 0.65mi |
| 5907 36th Ave Cir W #5907 Bradenton, FL | 2.0 | 2.0 | 937 | $2,800 | $2.99 | 23d | 1 | 0.68mi |
| 4880 51st St W Bradenton, FL | 1.0–4.0 | 1.0–3.0 | 1019 | $1,295 | $1.27 | 3d | 11 | 0.73mi |
| 4116 62nd St W Bradenton, FL | 2.0 | 2.0 | 840 | $1,650 | $1.96 | 3d | 1 | 0.80mi |
| 5909 30th Ave W Bradenton, FL | 1.0–2.0 | 1.0–2.0 | 788 | $1,465 | $1.86 | 1d | 6 | 0.84mi |
| 4112 66th Street Cir W Bradenton, FL | 2.0 | 2.0 | 1100 | $1,960 | $1.78 | 19d | 1 | 0.93mi |
| 4601 66th St W Bradenton, FL | 3.0 | 1.0–2.0 | 917 | $1,716 | $1.87 | 1d | 24 | 0.98mi |
| 4209 66th Street Cir W Bradenton, FL | 2.0 | 2.0 | 1044 | $2,900 | $2.78 | 23d | 1 | 1.01mi |
| 4161 66th Street Cir W Bradenton, FL | 2.0 | 2.0 | 1044 | $1,800 | $1.72 | 15d | 1 | 1.01mi |
| 586 Lakeside Dr Unit 586 Bradenton, FL | 2.0 | 2.0 | 940 | $3,200 | $3.40 | 23d | 1 | 1.01mi |
| 5933 28th Ave W Bradenton, FL | 1.0–2.0 | 1.0–2.0 | 945 | $1,250 | $1.32 | 1d | 6 | 1.03mi |
| 2926 63rd St W Bradenton, FL | 2.0 | 2.0 | 946 | $2,100 | $2.22 | 3d | 1 | 1.08mi |
| 2903 63rd St W Bradenton, FL | 1.0 | 1.0 | 693 | $2,000 | $2.89 | 3d | 1 | 1.08mi |
| 206 Lakewood Dr Unit 206 Bradenton, FL | 2.0 | 2.0 | 940 | $2,700 | $2.87 | 23d | 1 | 1.14mi |
| 184 Pineneedle Dr Bradenton, FL | 2.0 | 2.0 | 940 | $2,100 | $2.23 | 23d | 1 | 1.14mi |
| 6711 45th Ave W Unit A Bradenton, FL | 2.0 | 2.0 | 1100 | $1,700 | $1.55 | 15d | 1 | 1.20mi |
| 4501 71st St W Bradenton, FL | 1.0–2.0 | 1.0–2.0 | 850 | $1,280 | $1.51 | 1d | 28 | 1.35mi |
| 6304 Pointe West Blvd Unit A309 Bradenton, FL | 2.0 | 2.0 | 1042 | $1,795 | $1.72 | 10d | 1 | 1.35mi |
| 5027 31st St W Bradenton, FL | 2.0 | 2.0 | 972 | $3,600 | $3.70 | 21d | 1 | 1.37mi |
| 4148 53rd Ave W Unit 1210 Bradenton, FL | 2.0 | 2.0 | 1071 | $1,932 | $1.80 | 3d | 1 | 1.37mi |
| 4148 53rd Ave W Unit 0314 Bradenton, FL | 2.0 | 2.0 | 1071 | $1,967 | $1.84 | 23d | 1 | 1.37mi |
| 4148 53rd Ave W Bradenton, FL | 1.0–3.0 | 1.0–2.0 | 989 | $1,451 | $1.47 | 1d | 1 | 1.37mi |
HOA detail condo
- Monthly dues
- $594 · $7,128/yr
- Assessments
- None detected in remarks — confirm with the listing agent.
Listing history 37 events
-
2026-06-08statusdays on market $110,000 Pending 206 DOM
-
2026-06-08days on market $110,000 Active 205 DOM
-
2026-06-03days on market $110,000 Active 201 DOM
-
2026-06-02days on market $110,000 Active 200 DOM
-
2026-06-01days on market $110,000 Active 199 DOM
-
2026-05-31days on market $110,000 Active 198 DOM
-
2026-05-07price $110,000
-
2026-01-19price $127,000
-
2025-11-14$139,900 Active
-
2025-06-09historical
-
2025-04-28$169,900 Active
-
2024-08-22historical
-
2024-07-25price $212,000
-
2024-03-22$229,000 Active
-
2022-12-07soldstatus $145,000
-
2022-12-06soldstatus $145,000 Closed
-
2022-11-29status Pending
-
2022-11-24price $149,000
-
2022-11-15price $152,000
-
2022-11-11price $156,000
-
2022-11-04status Active
-
2022-10-27status Pending
-
2022-10-22$159,000 Active
-
2022-09-26historical
-
2022-09-22price $165,000
-
2022-09-21price $180,000
-
2022-07-29$169,000 Active
-
2015-08-17soldstatus $61,000
-
2015-08-14soldstatus $61,000 Sold
-
2015-07-21status Pending
-
2015-07-11historical Active with Contract
-
2015-07-07$61,000 Active
-
2008-03-17historical
-
2007-09-18$112,000
-
2001-10-22soldstatus $63,000
-
2001-08-13soldstatus $52,000
-
1987-11-03soldstatus $37,500
ⓘ Source: listings_history table (triggers on properties + properties_extension) + one-shot
backfill from property_details.listing_events for pre-trigger history.
Tax reassessment forecast FL · Resets to sale price
- Current annual tax
- $2,003 · $167/mo
- Projected year-2 tax
- $2,003 · $167/mo
- Expected delta
- $0/yr ($0/mo · 0.0%)
ⓘ Screening estimate from a state-policy table — verify with the county assessor before closing.
Climate risk First Street
- Flood 1/10 Low FEMA zone X (unshaded) · 0% chance over 30 yrs
- Wildfire 1/10 Low
- Heat 10/10 Extreme 7 d/yr ≥106°F today · 30 d/yr by 30 yrs out
- Wind 10/10 Extreme 99% chance of damaging wind over 30 yrs
- Air quality 3/10 Moderate 2 unhealthy d/yr today · 2 by 30 yrs out
Nearby sold comps map
Loading sold comps map…
Walkable amenities ~0.75 mi
Loading nearby amenities…
Taxation est. · year 1
- Rental income
- $21,868
- − Mortgage interest
- −$6,162
- − Property taxes
- −$2,003
- − Insurance
- −$550
- − Repairs & maintenance
- −$1,749
- − Management
- −$1,749
- − HOA
- −$7,128
- − Depreciation
- −$3,200
- Taxable loss
- −$673
- Est. tax savings @ 24.0%
- +$162
- After-tax cash flow
- $834/yr
For passive investors: Depreciation is non-cash, so a rental often shows a tax loss while cash-flowing — sheltering income. Rental losses are passive: they offset passive income freely, and up to $25,000/yr can offset ordinary (W-2) income if you actively participate and your MAGI is under $100k (phasing out to $0 by $150k); unused losses carry forward. On sale, claimed depreciation is recaptured at up to 25%, and gains may owe capital-gains tax (a 1031 exchange can defer both). Figures are a year-1 estimate at your 24.0% rate — not tax advice; consult a CPA.
Schools (NCES district)
- District
- Manatee
- NCES district ID
- 1201230
- Math proficiency
- 54% ▼ -6.00%
- Reading proficiency
- 50% ▼ -2.00%
- Median HH income
- $49,607
- Composite
- 44.43/100
- National rank
- #2806
- State rank
- #26 of 73 in FL
Livability — Bradenton
- Score
- 81/100
- State rank
- #101
- US rank
- #1528
Category grades
Schools grade is shown separately in the Schools card above.
Census & demographics
- Census place
- Bradenton, FL
- County
- Manatee County · 416,364 people
- City population
- 227,091
- Metro
- North Port-Sarasota-Bradenton, FL
- Population (ZIP)
- 33,224
- Household income
- $81,728
- Rent vs Own
- Severe rent burden
- 1126.0
Population outlook (Manatee County) Hauer SSP2
- Today (2025)
- 447,342 people
- By 2030
- 488,911 · +9.3%
- By 2040
- 567,934 · +27.0%
- By 2050
- 637,995 · +42.6%
- By 2075
- 781,970 · +74.8%
- By 2100
- 848,272 · +89.6%
Race, ethnicity, and origin ACS 2023
- Neighborhood character
- Predominantly White (84%)
- Race & ethnicity
- White 84% Hispanic / Latino 11% Two or more races 6% Black 2% Asian 1%
- Hispanic origin (detail)
- Puerto Rican 4% Cuban 3%
- Common ancestry
- Romanian 3% Slovak 3% Lithuanian 3%
- Foreign-born
- 9% · Canada, Jamaica, China
- Languages at home
- 90% English-only · Spanish 6% Russian/Polish/Slavic 1% Other Indo-European 1%
Political lean MEDSL · Manatee
- 2024 margin
- Strong R (+23.5) · D 37.9% · R 61.4%
- 2008→2024 swing
- -16.5pp toward R · 2008: -7.0pp · 2024: -23.5pp
- All cycles
- 2024: R+23.5 2020: R+16.1 2016: R+17.1 2012: R+12.5 2008: R+7.0
Not yet ingested
- Civics
- —
Market trends
- HPI YoY
- ▼ -360.34%
- Current HPI
- 320.0061
- Rent YoY
- ▼ -0.30%
- Metro
- North Port-Sarasota-Bradenton, FL
- State GDP YoY
- ▲ 3.28%
- F500 in state
- 36
Industry mix (Fortune 500 HQ in FL)
| Industry | F500 HQs | Revenue |
|---|---|---|
| Industrial Technology | 2 | $29B |
|
||
| Insurance | 2 | $17B |
|
||
| Retail | 1 | $60B |
|
||
| Technology Distribution | 1 | $58B |
|
||
| Homebuilding | 1 | $35B |
|
||
| Technology Manufacturing | 1 | $35B |
|
||
Price history
+193.3% since first listed31 events — show timeline
- 2026-05-07 Price Changed $110,000 Stellar MLS as Distributed by MLS Grid
- 2026-01-19 Price Changed $127,000 Stellar MLS as Distributed by MLS Grid
- 2025-11-14 Listed $139,900 Stellar MLS as Distributed by MLS Grid
- 2025-06-09 Listing Removed — Stellar MLS as Distributed by MLS Grid
- 2025-04-28 Listed $169,900 Stellar MLS as Distributed by MLS Grid
- 2024-08-22 Listing Removed — Stellar MLS as Distributed by MLS Grid
- 2024-07-25 Price Changed $212,000 Stellar MLS as Distributed by MLS Grid
- 2024-03-22 Listed $229,000 Stellar MLS as Distributed by MLS Grid
- 2022-12-07 Sold (Public Records) $145,000 Public Records
- 2022-12-06 Sold (MLS) $145,000 Stellar MLS as Distributed by MLS Grid
- 2022-11-29 Pending — Stellar MLS as Distributed by MLS Grid
- 2022-11-24 Price Changed $149,000 Stellar MLS as Distributed by MLS Grid
- 2022-11-15 Price Changed $152,000 Stellar MLS as Distributed by MLS Grid
- 2022-11-11 Price Changed $156,000 Stellar MLS as Distributed by MLS Grid
- 2022-11-04 Relisted — Stellar MLS as Distributed by MLS Grid
- 2022-10-27 Pending — Stellar MLS as Distributed by MLS Grid
- 2022-10-22 Listed $159,000 Stellar MLS as Distributed by MLS Grid
- 2022-09-26 Listing Removed — Stellar MLS as Distributed by MLS Grid
- 2022-09-22 Price Changed $165,000 Stellar MLS as Distributed by MLS Grid
- 2022-09-21 Price Changed $180,000 Stellar MLS as Distributed by MLS Grid
- 2022-07-29 Listed $169,000 Stellar MLS as Distributed by MLS Grid
- 2015-08-17 Sold (Public Records) $61,000 Public Records
- 2015-08-14 Sold (MLS) $61,000 Stellar MLS as Distributed by MLS Grid
- 2015-07-21 Pending — Stellar MLS as Distributed by MLS Grid
- 2015-07-11 Contingent — Stellar MLS as Distributed by MLS Grid
- 2015-07-07 Listed $61,000 Stellar MLS as Distributed by MLS Grid
- 2008-03-17 Listing Removed — Stellar MLS as Distributed by MLS Grid
- 2007-09-18 Listed $112,000 Stellar MLS as Distributed by MLS Grid
- 2001-10-22 Sold (Public Records) $63,000 Public Records
- 2001-08-13 Sold (Public Records) $52,000 Public Records
- 1987-11-03 Sold (Public Records) $37,500 Public Records
Property tax history
+20.9%/yrLatest (2025): $2,003 · -23.1% YoY. Source: county tax records.
Cash-flow waterfall
monthlySold comps — $/sqft
last 12 mo · ≤1 miLoading sold comps…