2640 W Diamond St #16 · Flowing Wells, AZ
Flood risk 1/10 · Minimal
- FEMA flood zone
- X (unshaded)
- Chance of flooding over 30 yrs
- 0.0%
- Est. flood insurance / yr
- $507 – $1,088
Fire risk 5/10 · Moderate
- Est. fire insurance / yr
- $610 – $1,132
Heat risk 8/10 · Major
- Hot days now (above 107°F)
- 7 days/yr
- Hot days in 30 yrs
- 17 days/yr
Wind risk 1/10 · Minimal
- Chance of severe wind over 30 yrs
- —
Air-quality risk 1/10 · Minimal
- Unhealthy air days now
- 0 days/yr
- Unhealthy air days in 30 yrs
- 0 days/yr
Risk factors via First Street. Map © Google.
Why this score? — see what drove the D grade
The composite is a weighted blend of 9 inputs, each scored 0–100. Each bar is that input's sub-score; the figure is the points it added to the 100-point composite (weight × sub-score).
- Cash flow +15.0/30.0
- ARV discount +7.5/15.0
- 1% rule +5.0/10.0
- DSCR +5.0/10.0
- Livability +3.7/5.0
- Rent growth +2.6/5.0
- Condition / age +2.5/5.0
- Schools +2.2/10.0
- Appreciation +0.0/10.0
$15,000
🖨 Deal sheet 📄 Offer letter ✓ Due diligence
Listing remarks
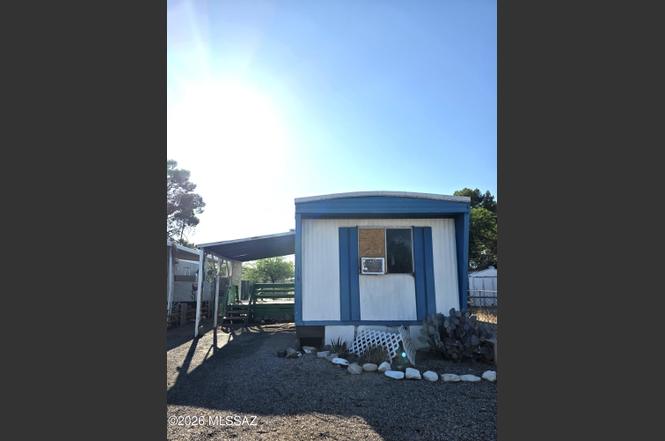
Affordable Tucson living at its best! Own your own cozy home in a convenient location close to shopping, dining, schools, and everyday essentials. This charming 2-bedroom, 1-bath home features a fully fenced yard, a spacious kitchen, in-home laundry hookups, and a covered carport to help protect your vehicle from the Arizona sun. Add your own personal touches and this delightful home is ready to shine. Don't miss the opportunity to make this charming house your very own home sweet home!
Key facts
- Covered carport
- Spacious kitchen
- Fully fenced yard
Tags
Property features AI
Finance
- Other: Zoned Tucson - CMH2
- HOA & community: Paved street within community
Exterior
- Parking: Attached garage; 1 covered/carport space
- Utilities: Public water; Sewer connected
- Home design: Mobile home; Single-story
- Construction: Metal siding; Membrane roof; Built living area 780
- Exterior features: Covered patio and deck; Chain link fencing; Paved street access; North/South exposure lot
Interior
- Kitchen: Gas range; Gas oven
- Bathrooms: 1 full bathroom
- Heating & cooling: Forced air heating; Ceiling fans pre-wired; Window cooling units
- Interior features: Gas range and gas oven (gas hookup available); Laundry closet
- Laundry & utility: Laundry closet
Neighborhood map
What this means for you Summary
Snapshot
- This is a 2-bed/1.0-bath manufactured listed at $15k.
Deal economics
- At list price, monthly cash flow is $834 ($10k/yr) — positive.
- The deal already cash-flows at list — no discount required.
- Meets the 1% rule at list price ($1k rent vs $15k).
- Cap rate 73.0% vs local median 6.1% in Flowing Wells — top-decile yield for the area; either an underpriced asset or a hidden risk that comps aren't pricing in. Stress-test before assuming the spread holds.
Location & tenants
- Location reads 73/100 on livability (#21 in AZ) — a middle-class / working-renter tenant base. Strengths: commute A+, cost of living A+, health & safety A+; Watch: crime F, amenities F, employment F.
- Flowing Wells Unified District (4405) (suburban): math 23% / reading 30% proficiency, ranked #143 of 249 in AZ (top 57%) — low school quality limits family demand, transient renter base, plan for 1-2y turnover; 64% free/reduced lunch — lower-income household profile, screen leases tightly.
- Zoned schools: Centennial Elementary School (math 25% / reading 32%, grade F, #580 of 1,109 statewide, top 53%, 448 students, 81% FRL); Flowing Wells Junior High School (math 24% / reading 28%, grade F, #100 of 218 statewide, top 47%, 818 students, 74% FRL); Flowing Wells High School (math 22% / reading 24%, grade F, #208 of 381 statewide, top 55%, 1,694 students, 65% FRL).
- Market conditions: Rents flat; 177 active listings in the ZIP; 7 comparable units currently listed for rent nearby; rentals at typical pace (median 20d on market — plan ~3-4 weeks tenant-placement turnaround); 43% of comp listings sitting > 30 days — soft ceiling on asking rent; lower-income renter base — watch delinquency; 5,268 units permitted in Pima County in 2024 (996 in 5+ unit buildings).
- This rent runs 38% of the median local income ($37k/yr) — at the standard rent-burdened threshold; future hikes will face affordability resistance.
Forward outlook
- Local home prices are declining (-3.0%/yr); year-one equity from $104 of loan paydown is wiped out by about $450 of value loss. Plan a longer hold.
- Pima County population projected at +8% by 2050 — modest demand growth; plan on rents tracking national, not racing it.
- At projected returns (-3.0% appreciation + 0.3% rent growth), your $4k cash investment doubles in ~1 year — after that, you're playing with house money.
Negotiation context
- Only 2 days on market — expect competitive offers; lowballing is unlikely to land.
Risks & watch-outs
- Climate carrying-cost: moderate wildfire risk; extreme-heat days projected 7→17/yr by 2055 (HVAC capex compounding) — expect insurance premiums to compound above CPI over the hold.
Questions for the listing agent
- Is there a deadline driving the sale (1031 exchange, divorce, estate, relocation)? That informs how much negotiation room exists.
- Schools are D-rated, which usually means shorter tenancies and higher turnover. Who's the typical renter profile here, and what's been the actual vacancy rate?
- Crime grade is F in this area — have there been break-ins, vandalism, or insurance claims at this property in the last 3 years? What carrier currently insures it and at what premium?
- The area grade is low — what's the realistic commute time and amenity access for the typical tenant pool here? Any planned neighborhood developments (good or bad) we should know about?
- What's the average days-on-market for RENTAL listings here right now (not sales)? A rising rental-DOM trend means longer vacancies and softer asking-rent achievability than the comps imply.
- What's the recent tenant-quality profile in this submarket — average credit score on applications, eviction rate, late-payment / NSF rate, and stable-employment percentage? A property-management company in the area should have these aggregated.
- How much new for-sale + rental construction is in the pipeline within 1–3 miles? Heavy new supply typically softens prices + rents 12–24 months out; constrained supply supports both.
Investment metrics
- 1% rule
- 7.91% ✓
- Cap rate
- 73.00%
- Cash-on-cash
- 238.25%
- DSCR
- 11.60
- GRM
- 1.1
CMA / ARV
- ARV (on-the-fly)
- $78,780
- Comps found
- 8
Show comp detail 8 sales within ~0.75 mi
| Address | Dist | Beds/Ba | Sqft | Sold | Price | $/sf | Match |
|---|---|---|---|---|---|---|---|
| 2725 W Kimberley St | 0.14mi | 3/2.0 (+1) | 768 (-2%) | 2mo | $80,000 | $104 | 81 |
| 2475 W Kessler Pl | 0.22mi | 2/1.0 | 840 (+8%) | 7mo | $85,000 | $101 | 71 |
| 2925 W Sago Cir W | 0.42mi | 1/1.0 (-1) | 790 (+1%) | 3mo | $135,000 | $171 | 71 |
| 2384 W Diamond St #41 | 0.33mi | 3/1.0 (+1) | 768 (-2%) | 8mo | $15,000 | $20 | 70 |
| 5011 N Davis Ave | 0.23mi | 2/2.0 | 896 (+15%) | 1mo | $60,000 | $67 | 60 |
| 2420 W Calle Comodo | 0.28mi | 2/2.0 | 896 (+15%) | 5mo | $103,500 | $116 | 54 |
| 5451 N Royal Palm Dr | 0.53mi | 2/1.5 | 887 (+14%) | 6mo | $88,000 | $99 | 46 |
| 5445 N Shannon Rd #7 | 0.68mi | 3/1.5 (+1) | 884 (+13%) | 6mo | $47,600 | $54 | 34 |
Match score weights: distance 35% · size 25% · config 20% · recency 20%. Top-matched comps best support the ARV.
Projected returns pro-forma
-3.0% appreciation · 0.3% rent growth · sell at horizon
- IRR
- —
- Equity multiple
- 12.32×
- Total profit
- $47,557
- Equity at exit
- $2,237
- IRR
- —
- Equity multiple
- 24.25×
- Total profit
- $97,667
- Equity at exit
- $1,297
Cash invested: $4,200 (down + closing). Projections, not guarantees.
Landlord ↔ Tenant lean methodology
- Overall (STATE)
- 87 Strongly Landlord-Friendly
- State Arizona
- 87 Strongly Landlord-Friendly · R+3
- County
- — inherits STATE
- City
- — inherits STATE
ZIP-level market 85705
- Rents YoY
- 0.3%
- Active inventory
- 177
- Price-to-rent
- 1.1×
Monthly cashflow live
- Estimated rent
- $1,187 high interval (Pro) →
- Mortgage (P&I)
- −$79
- Tax est. 1.5%
- −$19 /mo · $225/yr
- Insurance
- −$6
- HOA
- −$0
- Vacancy / Maint / Mgmt
- −$249
- Net cashflow
- $834
Break-even live
UW: 25.0% down · 7.5% · 30yr · 1.5% tax · 5.0% vac · 8.0% maint · 8.0% mgmt
Financing live
Cash to close
- Down payment
- $3,750
- Closing costs
- $450
- Reserves months
- —
- Total cash needed
- —
Loan-product check · same deal, 3 products live
Conventional
25% down · 7.5% · 30yr
- Down + closing
- —
- Monthly P&I
- —
- Monthly cashflow
- —
- DSCR
- —
- Eligible?
- —
Personal DTI + credit; lowest rate.
DSCR
20% down · 8.5% · 30yr
- Down + closing
- —
- Monthly P&I
- —
- Monthly cashflow
- —
- DSCR
- —
- Eligible?
- —
No personal income docs; deal must DSCR.
Hard money
10% down · 12.0% · 12mo
- Down + closing
- —
- Monthly P&I
- —
- Monthly cashflow
- —
- DSCR
- —
- Eligible?
- —
Short-term bridge; refi at stabilization.
Rent comps 7 comps
| Address | Beds | Baths | Sqft | Rent | $/sqft | DOM | Units | Dist |
|---|---|---|---|---|---|---|---|---|
| 4957 N Sunrise Ave Unit 2 Tucson, AZ | 2.0 | 1.0 | 803 | $1,075 | $1.34 | 14d | 1 | 0.11mi |
| 2774 W Firebrook Rd Tucson, AZ | 2.0 | 2.0 | 1066 | $1,550 | $1.45 | 3d | 1 | 0.83mi |
| 2531 W Glenbrook Way Tucson, AZ | 2.0 | 2.0 | 1066 | $1,795 | $1.68 | 43d | 1 | 0.89mi |
| 1925 W River Rd Tucson, AZ | 1.0–3.0 | 1.0–2.0 | 1049 | $1,856 | $1.77 | 1d | 32 | 0.94mi |
| 1990 W Amy Pl Unit B Tucson, AZ | 1.0 | 1.0 | 600 | $900 | $1.50 | 20d | 1 | 1.17mi |
| 3001 W Coriander Dr Tucson, AZ | 2.0 | 2.0 | 1090 | $1,650 | $1.51 | 43d | 1 | 1.28mi |
| 1865 W La Osa St Tucson, AZ | 2.0 | 1.0 | 821 | $1,450 | $1.77 | 43d | 1 | 1.38mi |
Listing history 3 events
-
2026-06-18days on market $15,000 Active 2 DOM
-
2026-06-16remarks 491-char remark
-
2026-06-16$15,000 Active 1 DOM
ⓘ Source: listings_history table (triggers on properties + properties_extension) + one-shot
backfill from property_details.listing_events for pre-trigger history.
Climate risk First Street
- Flood 1/10 Low FEMA zone X (unshaded) · 0% chance over 30 yrs
- Wildfire 5/10 Major
- Heat 8/10 Severe 7 d/yr ≥107°F today · 17 d/yr by 30 yrs out
- Wind 1/10 Low
- Air quality 1/10 Low 0 unhealthy d/yr today · 0 by 30 yrs out
Nearby sold comps map
Loading sold comps map…
Walkable amenities ~0.75 mi
Loading nearby amenities…
Taxation est. · year 1
- Rental income
- $14,241
- − Mortgage interest
- −$840
- − Property taxes
- −$225
- − Insurance
- −$75
- − Repairs & maintenance
- −$1,139
- − Management
- −$1,139
- − Depreciation
- −$436
- Taxable income
- $10,386
- Est. tax owed @ 24.0%
- −$2,493
- After-tax cash flow
- $7,514/yr
For passive investors: Depreciation is non-cash, so a rental often shows a tax loss while cash-flowing — sheltering income. Rental losses are passive: they offset passive income freely, and up to $25,000/yr can offset ordinary (W-2) income if you actively participate and your MAGI is under $100k (phasing out to $0 by $150k); unused losses carry forward. On sale, claimed depreciation is recaptured at up to 25%, and gains may owe capital-gains tax (a 1031 exchange can defer both). Figures are a year-1 estimate at your 24.0% rate — not tax advice; consult a CPA.
Schools (NCES district)
- District
- Flowing Wells Unified District (4405)
- NCES district ID
- 0403010
- Math proficiency
- 23% ▼ -19.00%
- Reading proficiency
- 30% ▼ -14.00%
- Median HH income
- $33,361
- Composite
- 21.69/100
- National rank
- #8271
- State rank
- #143 of 249 in AZ
Livability — Flowing Wells
- Score
- 73/100
- State rank
- #21
- US rank
- #5288
Category grades
Schools grade is shown separately in the Schools card above.
Census & demographics
- Census place
- Flowing Wells, AZ
- County
- Pima County · 1,012,107 people
- Metro
- Tucson, AZ
- Population (ZIP)
- 54,700
- Household income
- $37,194
- Rent vs Own
- Severe rent burden
- 4240.0
Population outlook (Pima County) Hauer SSP2
- Today (2025)
- 1,066,056 people
- By 2030
- 1,086,684 · +1.9%
- By 2040
- 1,117,160 · +4.8%
- By 2050
- 1,149,778 · +7.9%
- By 2075
- 1,271,480 · +19.3%
- By 2100
- 1,321,160 · +23.9%
Race, ethnicity, and origin ACS 2023
- Neighborhood character
- Diverse neighborhood (Simpson 0.63)
- Race & ethnicity
- Hispanic / Latino 45% White 41% Two or more races 18% Asian 4% Black 3% Native American 3%
- Hispanic origin (detail)
- Mexican 41%
- Common ancestry
- Portuguese 2% Romanian 2% Lithuanian 2%
- Foreign-born
- 18% · Canada, China, Vietnam
- Languages at home
- 65% English-only · Spanish 30% Chinese 1% Vietnamese 1%
Political lean MEDSL · Pima
- 2024 margin
- D (+15.2) · D 57.0% · R 41.8% · Other 1.2%
- 2008→2024 swing
- +9.1pp toward D · 2008: 6.1pp · 2024: 15.2pp
- All cycles
- 2024: D+15.2 2020: D+18.7 2016: D+13.5 2012: D+5.8 2008: D+6.1
Not yet ingested
- Civics
- —
Market trends
- HPI YoY
- ▼ -163.31%
- Current HPI
- 283.0647
- Rent YoY
- ▲ 0.30%
- Metro
- Tucson, AZ
- State GDP YoY
- ▲ 4.54%
- F500 in state
- 20
Industry mix (Fortune 500 HQ in AZ)
| Industry | F500 HQs | Revenue |
|---|---|---|
| Technology | 2 | $13B |
|
||
| Mining / Metals | 1 | $23B |
|
||
| Environmental Services | 1 | $16B |
|
||
| Metals / Steel | 1 | $14B |
|
||
| Technology Distribution | 1 | $9B |
|
||
| Homebuilding | 1 | $8B |
|
||
Price history
1 event — show timeline
- 2026-06-16 Listed $15,000 MLSSAZ
Cash-flow waterfall
monthlySold comps — $/sqft
last 12 mo · ≤1 miLoading sold comps…