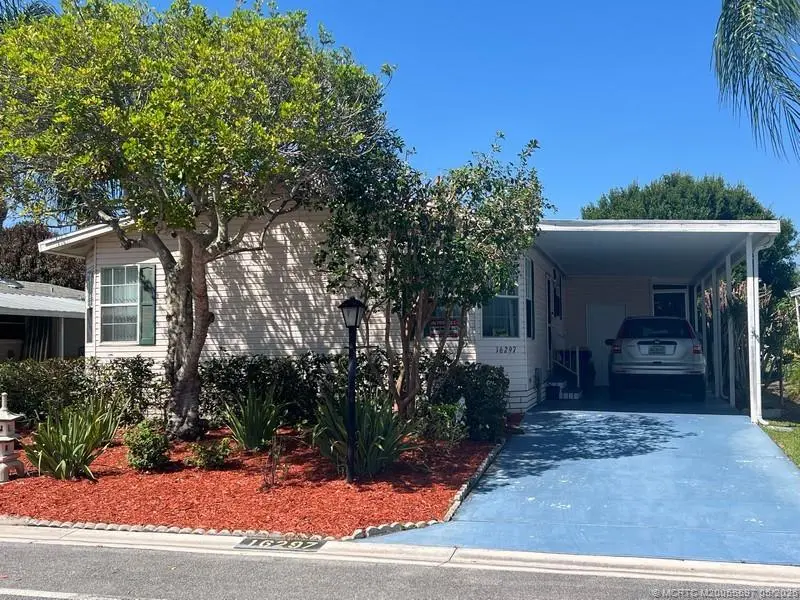
16297 SW Indianwood Cir SW Unit O-24 · Indiantown, FL
Flood risk 1/10 · Minimal
- FEMA flood zone
- X (unshaded)
- Chance of flooding over 30 yrs
- 0.0%
- Est. flood insurance / yr
- $507 – $1,088
Fire risk 5/10 · Moderate
- Est. fire insurance / yr
- $947 – $1,759
Heat risk 9/10 · Severe
- Hot days now (above 108°F)
- 7 days/yr
- Hot days in 30 yrs
- 24 days/yr
Wind risk 10/10 · Severe
- Chance of severe wind over 30 yrs
- 99.0%
Air-quality risk 2/10 · Minimal
- Unhealthy air days now
- 0 days/yr
- Unhealthy air days in 30 yrs
- 1 days/yr
Risk factors via First Street. Map © Google.
Why this score? — see what drove the C- grade
The composite is a weighted blend of 9 inputs, each scored 0–100. Each bar is that input's sub-score; the figure is the points it added to the 100-point composite (weight × sub-score).
- Cash flow +15.0/30.0
- Appreciation +8.3/10.0
- ARV discount +5.2/15.0
- 1% rule +5.0/10.0
- DSCR +5.0/10.0
- Schools +4.5/10.0
- Livability +3.0/5.0
- Rent growth +2.5/5.0
- Condition / age +2.5/5.0
$32,000
🖨 Deal sheet (PDF) 📄 Offer letter ✓ Due diligence
Listing remarks
This home is in a lovely 55 plus community with variety of activities, clubs & Holiday celebrations. Enjoy this RARE SPLIT 3 BEDROOM HOME. large open island kitchen with mutable kitchen cabinets for all your storage needs. Wide open living and dining area for those family gatherings. Two guest bedrooms and separate full bath for those grand children or visiting guess. Master suite accommodates a king size bedroom set. Open Bath with soak tub & shower area. Nice separate laundry room. Nicely landscape front and back yard makes this home welcoming.
Key facts
- Master suite
- Open island kitchen
- Separate full bath
Tags
Property features AI
Finance
- Other: Pets allowed with number limits
- HOA & community: Has homeowners association; HOA covers grounds maintenance; HOA fee applies; Senior community; Community amenities include billiard room, bocce court, clubhouse, dog park, fitness center, golf, game room, kitchen facilities, library, non-gated community, pickleball, on-site property manager, pool, putting green, restaurant, shuffleboard, storage facilities, and tennis courts
Exterior
- Parking: 2 total parking spaces; 2 covered parking spaces
- Utilities: Electricity connected (110V and 220V)
- Home design: Single-story manufactured home; Resale unit; Made by MERIT
- Construction: Manufactured construction
- Exterior features: Community pool
Interior
- Bathrooms: 2 full bathrooms
- Heating & cooling: Central heating; Central air conditioning
- Interior features: Unfurnished
Neighborhood map
What this means for you Summary
Snapshot
- This is a 3-bed/2.0-bath manufactured listed at $32k.
Deal economics
- At list price, monthly cash flow is $678 ($8k/yr) — positive.
- The deal already cash-flows at list — no discount required.
- Meets the 1% rule at list price ($3k rent vs $32k).
- Recommended offer: $31k (3.0% below list) — sets the bar for market timing.
- Cap rate 31.7% vs local median 10.9% in Indiantown — top-decile yield for the area; either an underpriced asset or a hidden risk that comps aren't pricing in. Stress-test before assuming the spread holds.
Location & tenants
- Location reads 59/100 on livability (#829 in FL) — a working-class tenant base; expect higher turnover. Strengths: cost of living A+, housing A+; Watch: amenities F, commute F, employment F.
- Martin (suburban): math 52% / reading 53% proficiency, ranked #24 of 73 in FL (top 33%) — acceptable for families but not a draw, mixed tenant base, ~2y average lease.
- Zoned schools: Warfield Elementary School (math 22% / reading 19%, grade F, #2,094 of 2,144 statewide, top 98%, 686 students, 79% FRL); Indiantown Middle School (math 42% / reading 29%, grade F, #414 of 571 statewide, top 73%, 646 students, 75% FRL); South Fork High School (math 36% / reading 48%, grade F, #275 of 667 statewide, top 42%, 1,810 students, 51% FRL) — zoned schools average 68% FRL vs 41% district-wide (27 pts higher); higher-poverty schools than district average — tighter screening recommended.
- Zoned-school proficiency averages 33% at this address vs 52% district-wide (-20 pts) — the specific schools serving this property underperform the Martin average; the district grade overstates school quality for this exact location.
- Market conditions: 136 active listings in the ZIP; 4 comparable units currently listed for rent nearby; rentals at typical pace (median 16d on market — plan ~3-4 weeks tenant-placement turnaround); 737 units permitted in Martin County in 2024 (167 in 5+ unit buildings).
Forward outlook
- In year one you build about $2k of equity ($221 loan paydown + $2k appreciation (6.7% local appreciation)).
- Martin County population projected at +19% by 2050 — long-run rental-demand tailwind backs the buy-and-hold thesis.
- At projected returns (6.7% appreciation + 3.0% rent growth), your $9k cash investment doubles in ~1 year — after that, you're playing with house money.
Negotiation context
- It's been on market 33 days — a 3% lower offer ($31k) is reasonable based on typical stale-listing flexibility.
Risks & watch-outs
- Watch-outs: HOA is 47% of rent.
- Climate carrying-cost: severe wind risk, 99% chance of damaging wind over 30y; moderate wildfire risk; extreme-heat days projected 7→24/yr by 2055 (HVAC capex compounding) — expect insurance premiums to compound above CPI over the hold.
Questions for the listing agent
- It's been on market 33 days. Have you received any prior offers? Is the seller open to a 3% concession, seller financing, or rate buy-down credit?
- What does the HOA fee cover, when was the last increase, and are there any pending special assessments or reserve-fund shortfalls?
- Is there a deadline driving the sale (1031 exchange, divorce, estate, relocation)? That informs how much negotiation room exists.
- Schools are F-rated, which usually means shorter tenancies and higher turnover. Who's the typical renter profile here, and what's been the actual vacancy rate?
- What's the average days-on-market for RENTAL listings here right now (not sales)? A rising rental-DOM trend means longer vacancies and softer asking-rent achievability than the comps imply.
- What's the recent tenant-quality profile in this submarket — average credit score on applications, eviction rate, late-payment / NSF rate, and stable-employment percentage? A property-management company in the area should have these aggregated.
- How much new for-sale + rental construction is in the pipeline within 1–3 miles? Heavy new supply typically softens prices + rents 12–24 months out; constrained supply supports both.
Investment metrics
- 1% rule
- 8.72% ✓
- Cap rate
- 31.74%
- Cash-on-cash
- 90.87%
- DSCR
- 5.04
- GRM
- 1.0
CMA / ARV
- ARV (on-the-fly)
- $30,430
- Comps found
- 12
Show comp detail 12 sales within ~0.75 mi
| Address | Dist | Beds/Ba | Sqft | Sold | Price | $/sf | Match |
|---|---|---|---|---|---|---|---|
| 16448 SW Two Wood Way | 0.05mi | 3/2.0 | 1,792 (+0%) | 2mo | $30,000 | $17 | 96 |
| 16537 SW Two Wood Way | 0.14mi | 3/2.0 | 1,792 (+0%) | 2mo | $53,700 | $30 | 92 |
| 16456 SW Three Wood Way | 0.11mi | 2/2.0 (-1) | 1,680 (-6%) | 4mo | $29,000 | $17 | 76 |
| 16477 SW Two Wood Way Way SW | 0.09mi | 2/2.0 (-1) | 1,680 (-6%) | 6mo | $28,000 | $17 | 76 |
| 16112 SW Indianwood Cir | 0.24mi | 2/2.0 (-1) | 1,712 (-4%) | 3mo | $32,500 | $19 | 74 |
| 16320 SW Indianwood Cir | 0.06mi | 2/2.0 (-1) | 1,624 (-9%) | 8mo | $65,000 | $40 | 70 |
| 14467 SW Golf Club Dr | 0.06mi | 2/2.0 (-1) | 1,680 (-6%) | 15mo | $20,000 | $12 | 70 |
| 16316 SW Indianwodd Cir | 0.05mi | 2/2.0 (-1) | 1,680 (-6%) | 15mo | $39,000 | $23 | 70 |
| 16137 SW Indianwood Cir | 0.18mi | 2/2.0 (-1) | 1,690 (-6%) | 14mo | $35,000 | $21 | 65 |
| 16227 SW Two Wood Way | 0.23mi | 2/2.0 (-1) | 1,600 (-11%) | 7mo | $7,000 | $4 | 61 |
| 16151 SW Five Wood Way | 0.29mi | 2/2.0 (-1) | 1,680 (-6%) | 14mo | $29,000 | $17 | 60 |
| 15957 Indianwood Circle Cir | 0.30mi | 2/2.0 (-1) | 1,568 (-12%) | 6mo | $26,000 | $17 | 55 |
Match score weights: distance 35% · size 25% · config 20% · recency 20%. Top-matched comps best support the ARV.
Projected returns pro-forma
6.65% appreciation · 3.0% rent growth · sell at horizon
- IRR
- 98.2%
- Equity multiple
- 7.09×
- Total profit
- $54,547
- Equity at exit
- $21,448
- IRR
- 95.8%
- Equity multiple
- 15.29×
- Total profit
- $128,011
- Equity at exit
- $40,100
Cash invested: $8,960 (down + closing). Projections, not guarantees.
Landlord ↔ Tenant lean methodology
- Overall (STATE)
- 87 Strongly Landlord-Friendly
- State Florida
- 87 Strongly Landlord-Friendly · R+3
- County
- — inherits STATE
- City
- — inherits STATE
ZIP-level market 34956
- Home prices YoY
- 1.2%
- Active inventory
- 136
- Price-to-rent
- 1.0×
Monthly cashflow live
- Estimated rent
- $2,789 medium interval (Pro) →
- Mortgage (P&I)
- −$168
- Tax est. 1.5%
- −$40 /mo · $480/yr
- Insurance
- −$13
- HOA
- −$1,304
- Vacancy / Maint / Mgmt
- −$586
- Net cashflow
- $678
Break-even live
Sensitivity live
| Price | -10% $701 | -5% $690 | +0% $678 | +5% $667 | +10% $656 |
|---|---|---|---|---|---|
| Rent | -10% $458 | -5% $568 | +0% $678 | +5% $789 | +10% $899 |
| Rate | -1.0pp $695 | -0.5pp $687 | base $678 | +0.5pp $670 | +1.0pp $662 |
UW: 25.0% down · 7.5% · 30yr · 1.5% tax · 5.0% vac · 8.0% maint · 8.0% mgmt
Financing live
Cash to close
- Down payment
- $8,000
- Closing costs
- $960
- Reserves months
- —
- Total cash needed
- —
Loan-product check · same deal, 3 products live
Conventional
25% down · 7.5% · 30yr
- Down + closing
- —
- Monthly P&I
- —
- Monthly cashflow
- —
- DSCR
- —
- Eligible?
- —
Personal DTI + credit; lowest rate.
DSCR
20% down · 8.5% · 30yr
- Down + closing
- —
- Monthly P&I
- —
- Monthly cashflow
- —
- DSCR
- —
- Eligible?
- —
No personal income docs; deal must DSCR.
Hard money
10% down · 12.0% · 12mo
- Down + closing
- —
- Monthly P&I
- —
- Monthly cashflow
- —
- DSCR
- —
- Eligible?
- —
Short-term bridge; refi at stabilization.
Rent comps 4 comps
| Address | Beds | Baths | Sqft | Rent | $/sqft | DOM | Units | Dist |
|---|---|---|---|---|---|---|---|---|
| 15817 SW Winter Rd Indiantown, FL | 3.0 | 2.5 | 1428 | $2,300 | $1.61 | 15d | 1 | 0.72mi |
| 15693 SW Twilight St Indiantown, FL | 4.0 | 2.5 | 1895 | $3,300 | $1.74 | 22d | 1 | 0.84mi |
| 15404 SW American St Indiantown, FL | 4.0 | 2.0 | 1850 | $3,000 | $1.62 | 15d | 1 | 0.86mi |
| 15760 SW Hammock Way Indiantown, FL | 3.0–4.0 | 2.0–3.5 | 1918 | $2,420 | $1.26 | 0d | 40 | 1.28mi |
HOA detail
- Monthly dues
- $1,304 · $15,648/yr
Listing history 17 events
-
2026-06-21days on market $32,000 Active 33 DOM
-
2026-06-18days on market $32,000 Active 30 DOM
-
2026-06-17days on market $32,000 Active 29 DOM
-
2026-06-16days on market $32,000 Active 28 DOM
-
2026-06-15days on market $32,000 Active 27 DOM
-
2026-06-14days on market $32,000 Active 25 DOM
-
2026-06-13days on market $32,000 Active 24 DOM
-
2026-06-10days on market $32,000 Active 22 DOM
-
2026-06-09days on market $32,000 Active 21 DOM
-
2026-06-08days on market $32,000 Active 20 DOM
-
2026-06-07days on market $32,000 Active 19 DOM
-
2026-06-03days on market $32,000 Active 15 DOM
-
2026-06-02days on market $32,000 Active 14 DOM
-
2026-06-01days on market $32,000 Active 13 DOM
-
2026-05-31days on market $32,000 Active 12 DOM
-
2026-05-31days on market $32,000 Active 11 DOM
-
2026-05-19$32,000 Active
ⓘ Source: listings_history table (triggers on properties + properties_extension) + one-shot
backfill from property_details.listing_events for pre-trigger history.
Climate risk First Street
- Flood 1/10 Low FEMA zone X (unshaded) · 0% chance over 30 yrs
- Wildfire 5/10 Major
- Heat 9/10 Extreme 7 d/yr ≥108°F today · 24 d/yr by 30 yrs out
- Wind 10/10 Extreme 99% chance of damaging wind over 30 yrs
- Air quality 2/10 Low 0 unhealthy d/yr today · 1 by 30 yrs out
Nearby sold comps map
Loading sold comps map…
Walkable amenities ~0.75 mi
Loading nearby amenities…
Taxation est. · year 1
- Rental income
- $33,473
- − Mortgage interest
- −$1,792
- − Property taxes
- −$480
- − Insurance
- −$160
- − Repairs & maintenance
- −$2,678
- − Management
- −$2,678
- − HOA
- −$15,648
- − Depreciation
- −$931
- Taxable income
- $9,106
- Est. tax owed @ 24.0%
- −$2,185
- After-tax cash flow
- $5,956/yr
For passive investors: Depreciation is non-cash, so a rental often shows a tax loss while cash-flowing — sheltering income. Rental losses are passive: they offset passive income freely, and up to $25,000/yr can offset ordinary (W-2) income if you actively participate and your MAGI is under $100k (phasing out to $0 by $150k); unused losses carry forward. On sale, claimed depreciation is recaptured at up to 25%, and gains may owe capital-gains tax (a 1031 exchange can defer both). Figures are a year-1 estimate at your 24.0% rate — not tax advice; consult a CPA.
Schools (NCES district)
- District
- Martin
- NCES district ID
- 1201290
- Math proficiency
- 52% ▼ -14.00%
- Reading proficiency
- 53% ▼ -4.00%
- Median HH income
- $52,482
- Composite
- 45.1/100
- National rank
- #2690
- State rank
- #24 of 73 in FL
Livability — Indiantown
- Score
- 59/100
- State rank
- #829
- US rank
- #20298
Category grades
Schools grade is shown separately in the Schools card above.
Census & demographics
- Census place
- Indiantown, FL
- Population (ZIP)
- 9,639
Population outlook (Martin County) Hauer SSP2
- Today (2025)
- 172,383 people
- By 2030
- 180,192 · +4.5%
- By 2040
- 194,114 · +12.6%
- By 2050
- 204,992 · +18.9%
- By 2075
- 229,641 · +33.2%
- By 2100
- 232,146 · +34.7%
Race, ethnicity, and origin ACS 2023
- Neighborhood character
- Diverse neighborhood (Simpson 0.64)
- Race & ethnicity
- Hispanic / Latino 49% Black 24% White 24% Two or more races 16% Native American 5% Asian 1%
- Hispanic origin (detail)
- Mexican 21% Puerto Rican 4% Cuban 1%
- Common ancestry
- Lithuanian 1% Italian 1% Slovak 1%
- Foreign-born
- 22% · Canada
- Languages at home
- 55% English-only · Spanish 42%
Political lean MEDSL · Martin
- 2024 margin
- Solid R (+31.1) · D 34.1% · R 65.2%
- 2008→2024 swing
- -17.5pp toward R · 2008: -13.6pp · 2024: -31.1pp
- All cycles
- 2024: R+31.1 2020: R+24.6 2016: R+26.9 2012: R+22.9 2008: R+13.6
Not yet ingested
- Civics
- —
Market trends
- HPI YoY
- ▲ 6.65%
- Current HPI
- 561.896
- Rent YoY
- —
- Metro
- —
- State GDP YoY
- ▲ 3.28%
- F500 in state
- 36
Industry mix (Fortune 500 HQ in FL)
| Industry | F500 HQs | Revenue |
|---|---|---|
| Industrial Technology | 2 | $29B |
|
||
| Insurance | 2 | $17B |
|
||
| Retail | 1 | $60B |
|
||
| Technology Distribution | 1 | $58B |
|
||
| Homebuilding | 1 | $35B |
|
||
| Technology Manufacturing | 1 | $35B |
|
||
Price history
1 event — show timeline
- 2026-05-19 Listed $32,000 MCRTC
Cash-flow waterfall
monthlySold comps — $/sqft
last 12 mo · ≤1 miLoading sold comps…