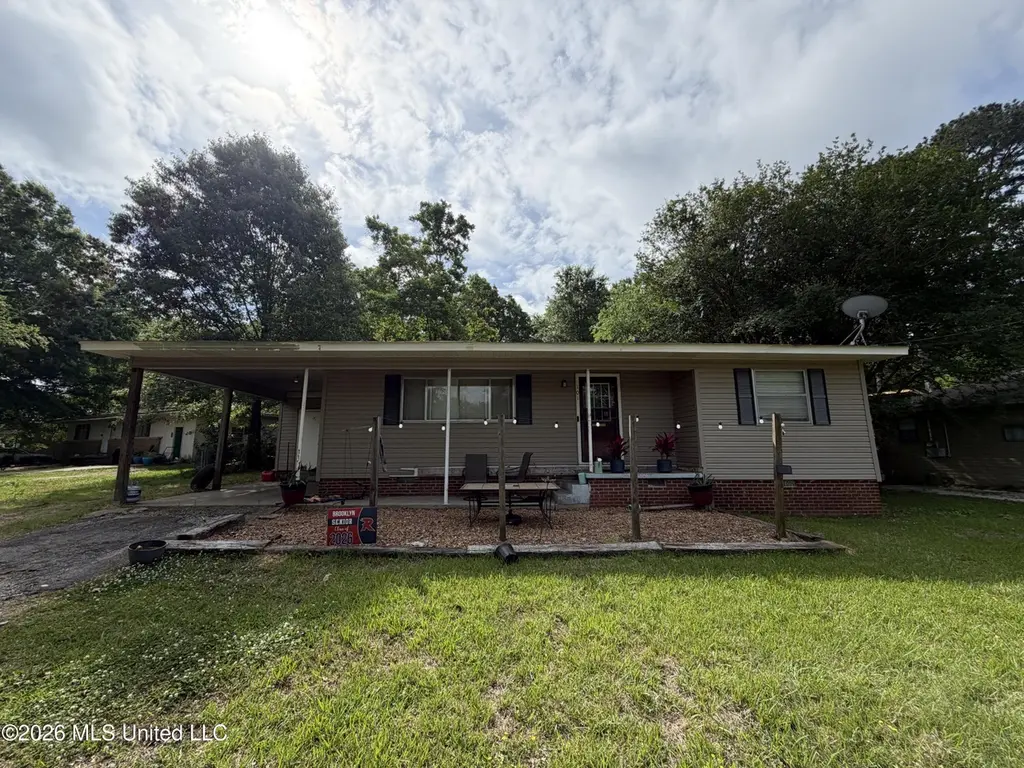
101 Richland St · Richland, MS
Flood risk 1/10 · Minimal
- FEMA flood zone
- X (unshaded)
- Chance of flooding over 30 yrs
- 0.0%
- Est. flood insurance / yr
- $507 – $1,088
Fire risk 2/10 · Minimal
- Est. fire insurance / yr
- $1,241 – $2,305
Heat risk 7/10 · Major
- Hot days now (above 109°F)
- 7 days/yr
- Hot days in 30 yrs
- 20 days/yr
Wind risk 8/10 · Major
- Chance of severe wind over 30 yrs
- 80.0%
Air-quality risk 1/10 · Minimal
- Unhealthy air days now
- 0 days/yr
- Unhealthy air days in 30 yrs
- 0 days/yr
Risk factors via First Street. Map © Google.
Why this score? — see what drove the B grade
The composite is a weighted blend of 9 inputs, each scored 0–100. Each bar is that input's sub-score; the figure is the points it added to the 100-point composite (weight × sub-score).
- Cash flow +30.0/30.0
- 1% rule +10.0/10.0
- DSCR +10.0/10.0
- ARV discount +7.5/15.0
- Schools +4.6/10.0
- Livability +3.2/5.0
- Rent growth +2.5/5.0
- Condition / age +2.5/5.0
- Appreciation +0.0/10.0
$75,000
🖨 Deal sheet 📄 Offer letter ✓ Due diligence
Listing remarks MLS
A must see in Richland! This home has so many great features and is nestled into an established neighborhood located close to shopping and dining. This home has an open floor plan, large lot, and a fantastic work shop. Schedule with your favorite Realtor to see this home today!
Key facts
- 0.33 acre lot
- Parking
- Built 1960
Tags
Neighborhood map
What this means for you Summary
Snapshot
- This is a 2-bed/1.0-bath single-family listed at $75k.
Deal economics
- At list price, monthly cash flow is $611 ($7k/yr) — positive.
- The deal already cash-flows at list — no discount required.
- Meets the 1% rule at list price ($1k rent vs $75k).
- Cap rate 16.1% vs local median 5.1% in Richland — top-decile yield for the area; either an underpriced asset or a hidden risk that comps aren't pricing in. Stress-test before assuming the spread holds.
Location & tenants
- Location reads 64/100 on livability (#125 in MS) — a middle-class / working-renter tenant base. Strengths: crime A+, cost of living A+, housing A; Watch: employment D+, amenities F, commute F.
- Rankin County School District (rural): math 56% / reading 48% proficiency, ranked #6 of 130 in MS (top 5%) — acceptable for families but not a draw, mixed tenant base, ~2y average lease.
- Zoned schools: Richland Upper Elementary (math 41% / reading 35%, grade F, #133 of 375 statewide, top 35%, 503 students, 99% FRL); Richland High School (math 37% / reading 34%, grade F, #66 of 197 statewide, top 34%, 807 students, 100% FRL) — zoned schools average 100% FRL vs 35% district-wide (65 pts higher); higher-poverty schools than district average — tighter screening recommended.
- Zoned-school proficiency averages 37% at this address vs 52% district-wide (-15 pts) — the specific schools serving this property underperform the Rankin County School District average; the district grade overstates school quality for this exact location.
- Market conditions: 36 active listings in the ZIP; 6 comparable units currently listed for rent nearby; rentals lingering (median 44d on market — plan ~5-8 weeks vacancy on turnover, expect pricing pressure); 50% of comp listings sitting > 30 days — soft ceiling on asking rent; 343 units permitted in Rankin County in 2024 (0 in 5+ unit buildings).
Forward outlook
- Local home prices are declining (-3.0%/yr); year-one equity from $519 of loan paydown is wiped out by about $2k of value loss. Plan a longer hold.
- Rankin County population projected at +17% by 2050 — long-run rental-demand tailwind backs the buy-and-hold thesis.
- At projected returns (-3.0% appreciation + 3.0% rent growth), your $21k cash investment doubles in ~4 years — after that, you're playing with house money.
Negotiation context
- Only 1 days on market — expect competitive offers; lowballing is unlikely to land.
- 3 sale attempts since 21y ago with the ask held roughly flat each time — persistent listings suggest the price (not the market) is what's stuck; bring a comps-based counter.
Risks & watch-outs
- Climate carrying-cost: severe wind risk, 80% chance of damaging wind over 30y; extreme-heat days projected 7→20/yr by 2055 (HVAC capex compounding) — expect insurance premiums to compound above CPI over the hold.
Questions for the listing agent
- Built in 1960 — when were the roof, HVAC, electrical panel, plumbing, and water heater last replaced?
- Is there a deadline driving the sale (1031 exchange, divorce, estate, relocation)? That informs how much negotiation room exists.
- Schools are D-rated, which usually means shorter tenancies and higher turnover. Who's the typical renter profile here, and what's been the actual vacancy rate?
- What's the average days-on-market for RENTAL listings here right now (not sales)? A rising rental-DOM trend means longer vacancies and softer asking-rent achievability than the comps imply.
- What's the recent tenant-quality profile in this submarket — average credit score on applications, eviction rate, late-payment / NSF rate, and stable-employment percentage? A property-management company in the area should have these aggregated.
- How much new for-sale + rental construction is in the pipeline within 1–3 miles? Heavy new supply typically softens prices + rents 12–24 months out; constrained supply supports both.
Investment metrics
- 1% rule
- 1.82% ✓
- Cap rate
- 16.06%
- Cash-on-cash
- 34.89%
- DSCR
- 2.55
- GRM
- 4.6
CMA / ARV
- ARV (on-the-fly)
- $161,920
- Comps found
- 6
Show comp detail 6 sales within ~0.75 mi
| Address | Dist | Beds/Ba | Sqft | Sold | Price | $/sf | Match |
|---|---|---|---|---|---|---|---|
| 112 Richland St | 0.08mi | 3/1.0 (+1) | 1,100 (+9%) | 22mo | $115,000 | $105 | 58 |
| 506 Plainview Cir | 0.27mi | 3/1.0 (+1) | 1,150 (+14%) | 13mo | $169,900 | $148 | 49 |
| 1520 Chelsea Ln | 0.67mi | 2/2.0 | 1,007 (-0%) | 20mo | $169,900 | $169 | 47 |
| 306 Williams St | 0.14mi | 3/1.5 (+1) | 1,150 (+14%) | 20mo | $169,900 | $148 | 47 |
| 1488 Chelsea Ln | 0.69mi | 2/2.0 | 1,061 (+5%) | 21mo | $169,900 | $160 | 38 |
| 1537 Chelsea Ln | 0.65mi | 3/2.0 (+1) | 1,116 (+10%) | 20mo | $181,500 | $163 | 27 |
Match score weights: distance 35% · size 25% · config 20% · recency 20%. Top-matched comps best support the ARV.
Projected returns pro-forma
-3.0% appreciation · 3.0% rent growth · sell at horizon
- IRR
- 30.4%
- Equity multiple
- 2.27×
- Total profit
- $26,728
- Equity at exit
- $11,183
- IRR
- 37.6%
- Equity multiple
- 4.49×
- Total profit
- $73,308
- Equity at exit
- $6,485
Cash invested: $21,000 (down + closing). Projections, not guarantees.
Landlord ↔ Tenant lean methodology
- Overall (STATE)
- 90 Strongly Landlord-Friendly
- State Mississippi
- 90 Strongly Landlord-Friendly · R+11
- County
- — inherits STATE
- City
- — inherits STATE
ZIP-level market 39218
- Home prices YoY
- -17.8%
- Active inventory
- 36
- Price-to-rent
- 4.6×
Monthly cashflow live
- Estimated rent
- $1,364 high interval (Pro) →
- Mortgage (P&I)
- −$393
- Tax from tax record
- −$42 /mo · $505/yr
- Insurance
- −$31
- HOA
- −$0
- Vacancy / Maint / Mgmt
- −$286
- Net cashflow
- $611
Break-even live
UW: 25.0% down · 7.5% · 30yr · 1.5% tax · 5.0% vac · 8.0% maint · 8.0% mgmt
Financing live
Cash to close
- Down payment
- $18,750
- Closing costs
- $2,250
- Reserves months
- —
- Total cash needed
- —
Loan-product check · same deal, 3 products live
Conventional
25% down · 7.5% · 30yr
- Down + closing
- —
- Monthly P&I
- —
- Monthly cashflow
- —
- DSCR
- —
- Eligible?
- —
Personal DTI + credit; lowest rate.
DSCR
20% down · 8.5% · 30yr
- Down + closing
- —
- Monthly P&I
- —
- Monthly cashflow
- —
- DSCR
- —
- Eligible?
- —
No personal income docs; deal must DSCR.
Hard money
10% down · 12.0% · 12mo
- Down + closing
- —
- Monthly P&I
- —
- Monthly cashflow
- —
- DSCR
- —
- Eligible?
- —
Short-term bridge; refi at stabilization.
Rent comps 6 comps
| Address | Beds | Baths | Sqft | Rent | $/sqft | DOM | Units | Dist |
|---|---|---|---|---|---|---|---|---|
| 103 Wedgewood Cir Richland, MS | 3.0 | 2.0 | 1020 | $1,395 | $1.37 | 43d | 1 | 0.88mi |
| 132 Southridge Rd Richland, MS | 3.0 | 2.0 | 1020 | $1,395 | $1.37 | 14d | 1 | 0.97mi |
| 129 Southridge Rd Richland, MS | 3.0 | 2.0 | 1020 | $1,395 | $1.37 | 43d | 1 | 0.98mi |
| 260 Lowe Cir Richland, MS | 2.0 | 2.0 | 1030 | $1,500 | $1.46 | 14d | 1 | 1.30mi |
| 260 Lowe Cir Richland, MS | 1.0 | 1.0 | 725 | $1,180 | $1.63 | 43d | 1 | 1.30mi |
| 260 Lowe Cir Richland, MS | 1.0 | 1.0 | 725 | $1,180 | $1.63 | 21d | 1 | 1.30mi |
Listing history 10 events
-
2026-05-08soldstatus
-
2026-04-25status Pending
-
2026-04-24$75,000 Active
-
2022-04-29soldstatus Closed 278-char remark
Show marketing remark (278 chars)
A must see in Richland! This home has so many great features and is nestled into an established neighborhood located close to shopping and dining. This home has an open floor plan, large lot, and a fantastic work shop. Schedule with your favorite Realtor to see this home today!
-
2022-03-13status Pending 278-char remark
Show marketing remark (278 chars)
A must see in Richland! This home has so many great features and is nestled into an established neighborhood located close to shopping and dining. This home has an open floor plan, large lot, and a fantastic work shop. Schedule with your favorite Realtor to see this home today!
-
2022-03-11$135,000 Active 278-char remark
Show marketing remark (278 chars)
A must see in Richland! This home has so many great features and is nestled into an established neighborhood located close to shopping and dining. This home has an open floor plan, large lot, and a fantastic work shop. Schedule with your favorite Realtor to see this home today!
-
2022-01-13soldstatus
-
2021-10-01historical
-
2005-05-02soldstatus
-
2005-02-01$53,900
ⓘ Source: listings_history table (triggers on properties + properties_extension) + one-shot
backfill from property_details.listing_events for pre-trigger history.
Tax reassessment forecast MS · Resets to sale price
- Current annual tax
- $505 · $42/mo
- Projected year-2 tax
- $593 · $49/mo
- Expected delta
- +$87/yr (+$7/mo · 17.3%)
ⓘ Screening estimate from a state-policy table — verify with the county assessor before closing.
Climate risk First Street
- Flood 1/10 Low FEMA zone X (unshaded) · 0% chance over 30 yrs
- Wildfire 2/10 Low
- Heat 7/10 Severe 7 d/yr ≥109°F today · 20 d/yr by 30 yrs out
- Wind 8/10 Severe 80% chance of damaging wind over 30 yrs
- Air quality 1/10 Low 0 unhealthy d/yr today · 0 by 30 yrs out
Nearby sold comps map
Loading sold comps map…
Walkable amenities ~0.75 mi
Loading nearby amenities…
Taxation est. · year 1
- Rental income
- $16,364
- − Mortgage interest
- −$4,201
- − Property taxes
- −$505
- − Insurance
- −$375
- − Repairs & maintenance
- −$1,309
- − Management
- −$1,309
- − Depreciation
- −$2,182
- Taxable income
- $6,483
- Est. tax owed @ 24.0%
- −$1,556
- After-tax cash flow
- $5,772/yr
For passive investors: Depreciation is non-cash, so a rental often shows a tax loss while cash-flowing — sheltering income. Rental losses are passive: they offset passive income freely, and up to $25,000/yr can offset ordinary (W-2) income if you actively participate and your MAGI is under $100k (phasing out to $0 by $150k); unused losses carry forward. On sale, claimed depreciation is recaptured at up to 25%, and gains may owe capital-gains tax (a 1031 exchange can defer both). Figures are a year-1 estimate at your 24.0% rate — not tax advice; consult a CPA.
Schools (NCES district)
- District
- Rankin County School District
- NCES district ID
- 2803830
- Math proficiency
- 56% ▼ -4.00%
- Reading proficiency
- 48% ▼ -6.00%
- Median HH income
- $61,867
- Composite
- 45.62/100
- National rank
- #2587
- State rank
- #6 of 130 in MS
Livability — Richland
- Score
- 64/100
- State rank
- #125
- US rank
- #13704
Category grades
Schools grade is shown separately in the Schools card above.
Census & demographics
- Census place
- Richland, MS
- City population
- 6,786
- Population (ZIP)
- 6,786
Population outlook (Rankin County) Hauer SSP2
- Today (2025)
- 164,317 people
- By 2030
- 171,013 · +4.1%
- By 2040
- 182,723 · +11.2%
- By 2050
- 192,376 · +17.1%
- By 2075
- 209,535 · +27.5%
- By 2100
- 209,534 · +27.5%
Race, ethnicity, and origin ACS 2023
- Neighborhood character
- Predominantly White (70%)
- Race & ethnicity
- White 70% Black 18% Two or more races 5% Hispanic / Latino 4% Asian 2%
- Common ancestry
- Italian 5% Serbian 2% Portuguese 1%
- Foreign-born
- 4% · Canada, Vietnam
- Languages at home
- 95% English-only · Spanish 3% Other Indo-European 1% Vietnamese 1%
Political lean MEDSL · Rankin
- 2024 margin
- Solid R (+47.1) · D 25.9% · R 73.0% · Other 1.0%
- 2008→2024 swing
- +6.4pp toward D · 2008: -53.5pp · 2024: -47.1pp
- All cycles
- 2024: R+47.1 2020: R+45.4 2016: R+52.9 2012: R+51.9 2008: R+53.5
Not yet ingested
- Civics
- —
Market trends
- HPI YoY
- ▼ -42.37%
- Current HPI
- 196.2686
- Rent YoY
- —
- Metro
- —
- State GDP YoY
- —
- F500 in state
- 0
Price history
+39.1% since first listed10 events — show timeline
- 2026-05-08 Sold (Public Records) — Public Records
- 2026-04-25 Pending — MLSU
- 2026-04-24 Listed $75,000 MLSU
- 2022-04-29 Sold (MLS) — MLSU
- 2022-03-13 Pending — MLSU
- 2022-03-11 Listed $135,000 MLSU
- 2022-01-13 Sold (Public Records) — Public Records
- 2021-10-01 Listing Removed — MLSU
- 2005-05-02 Sold (Public Records) — Public Records
- 2005-02-01 Listed $53,900 MLSU
Property tax history
+4.6%/yrLatest (2025): $505 · +2.4% YoY. Source: county tax records.
Cash-flow waterfall
monthlySold comps — $/sqft
last 12 mo · ≤1 miLoading sold comps…