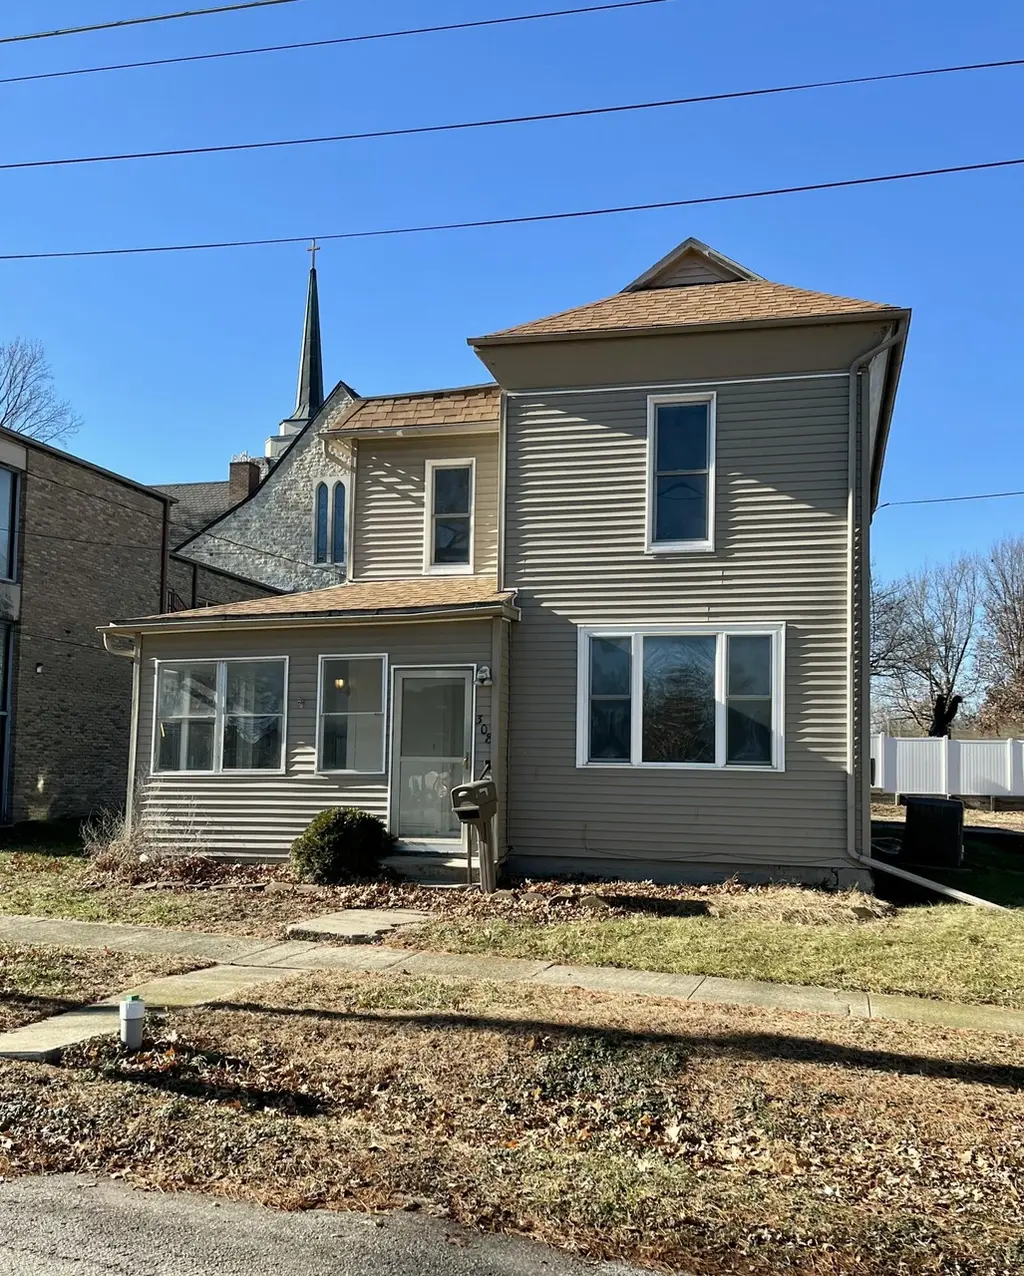
308 N 12th St · Clarinda, IA
Flood risk 1/10 · Minimal
- FEMA flood zone
- X (unshaded)
- Chance of flooding over 30 yrs
- 0.0%
- Est. flood insurance / yr
- $473 – $860
Fire risk 1/10 · Minimal
- Est. fire insurance / yr
- $902 – $1,676
Heat risk 3/10 · Minor
- Hot days now (above 105°F)
- 7 days/yr
- Hot days in 30 yrs
- 15 days/yr
Wind risk 2/10 · Minimal
- Chance of severe wind over 30 yrs
- —
Air-quality risk 1/10 · Minimal
- Unhealthy air days now
- 0 days/yr
- Unhealthy air days in 30 yrs
- 0 days/yr
Risk factors via First Street. Map © Google.
Why this score? — see what drove the C- grade
The composite is a weighted blend of 9 inputs, each scored 0–100. Each bar is that input's sub-score; the figure is the points it added to the 100-point composite (weight × sub-score).
- ARV discount +15.0/15.0
- Cash flow +14.6/30.0
- Schools +5.1/10.0
- DSCR +4.5/10.0
- Livability +3.7/5.0
- 1% rule +3.6/10.0
- Appreciation +2.6/10.0
- Rent growth +2.5/5.0
- Condition / age +2.5/5.0
$115,000
🖨 Deal sheet (PDF) 📄 Offer letter ✓ Due diligence
Listing remarks
Welcome home to this charming 3 bedroom, 2 bath 2 story located in the heart of Clarinda. Inside, you'll find beautifully refinished original wood floors that add character, paired perfectly with modern updates throughout. Enjoy peace of mind with newer heating and air, fully remodeled bathrooms, and a refreshed kitchen featuring brand-new cabinets. Fresh paint throughout gives the home a clean, move-in-ready feel. Situated on a huge lot, this property offers plenty of space to grow, garden, or entertain, while the attached carport adds everyday convenience. A wonderful blend of classic charm and modern comfort in a prime location--this home is ready to be loved.
Key facts
- Brand-new cabinets
- Attached carport
- Huge lot
Tags
Property features AI
Finance
- Other: Lot dimensions approximately 90 x 89
Exterior
- Security: Smoke detectors
- Home design: Single family residence; Two-story home; Frame construction; Entry level information not provided; Facing direction not provided
- Construction: Frame construction; Composition roof; Partial basement; Built/structure details not provided
- Exterior features: Composition roof; Other exterior features
Interior
- Kitchen: Eat-in kitchen
- Bedrooms: Laundry located in basement
- Heating & cooling: Natural gas forced air heating; Electric central air conditioning
- Interior features: Eat-in kitchen; Partial finished basement
- Laundry & utility: Laundry in basement
Neighborhood map
What this means for you Summary
Snapshot
- This is a 3-bed/2.0-bath single-family listed at $115k.
Deal economics
- At list price, monthly cash flow is $28 ($333/yr) — positive.
- The deal already cash-flows at list — no discount required.
- To meet the 1% rule (rent ≥ 1% of price), the offer needs to be $99k (13.8% below list).
- Recommended offer: $99k (13.8% below list) — sets the bar for 1% rule.
- Cap rate 6.6% vs local median 3.4% in Clarinda — top-decile yield for the area; either an underpriced asset or a hidden risk that comps aren't pricing in. Stress-test before assuming the spread holds.
Location & tenants
- Location reads 73/100 on livability (#289 in IA) — a middle-class / working-renter tenant base. Strengths: cost of living A+, housing A+, health & safety A+; Watch: employment D, amenities F, commute F.
- Clarinda Community School District (town): math 61% / reading 59% proficiency, ranked #249 of 289 in IA (top 86%) — acceptable for families but not a draw, mixed tenant base, ~2y average lease.
- Zoned schools: Clarinda High School (math 56% / reading 58%, grade C, #279 of 336 statewide, top 85%, 484 students, 38% FRL) — zoned schools at 38% FRL track the district average.
- Market conditions: 44 active listings in the ZIP; 25 units permitted in Page County in 2024 (0 in 5+ unit buildings).
Forward outlook
- Local home prices are declining (-3.0%/yr); year-one equity from $795 of loan paydown is wiped out by about $3k of value loss. Plan a longer hold.
- Page County population projected at -12% by 2050 — secular population decline; favor cash flow + early exit over multi-decade hold.
Negotiation context
- Only 8 days on market — expect competitive offers; lowballing is unlikely to land.
- 5 sale attempts since 4y ago with the ask held roughly flat each time — persistent listings suggest the price (not the market) is what's stuck; bring a comps-based counter.
- Current owner paid $73k; list at $115k implies a 58% gain — meaningful room to come down on a strong offer.
Risks & watch-outs
- Watch-outs: built in 1900 — expect roof / HVAC / electrical / plumbing capex.
Questions for the listing agent
- Built in 1900 — when were the roof, HVAC, electrical panel, plumbing, and water heater last replaced?
- Is there a deadline driving the sale (1031 exchange, divorce, estate, relocation)? That informs how much negotiation room exists.
- What's the average days-on-market for RENTAL listings here right now (not sales)? A rising rental-DOM trend means longer vacancies and softer asking-rent achievability than the comps imply.
- What's the recent tenant-quality profile in this submarket — average credit score on applications, eviction rate, late-payment / NSF rate, and stable-employment percentage? A property-management company in the area should have these aggregated.
- How much new for-sale + rental construction is in the pipeline within 1–3 miles? Heavy new supply typically softens prices + rents 12–24 months out; constrained supply supports both.
Investment metrics
- 1% rule
- 0.86% ✗
- Cap rate
- 6.58%
- Cash-on-cash
- 1.03%
- DSCR
- 1.05
- GRM
- 9.7
CMA / ARV
- ARV (median comp)
- $146,540
- List price
- $115,000
- Delta
- -18.11%
- Verdict
- UNDERPRICED
- Comps
- 20 within 1.0 mi
Show comp detail 12 sales within ~0.75 mi
| Address | Dist | Beds/Ba | Sqft | Sold | Price | $/sf | Match |
|---|---|---|---|---|---|---|---|
| 523 N 16th St | 0.30mi | 3/3.0 | 1,511 (-4%) | 0mo | $205,500,000 | $136,003 | 75 |
| 523 N 12th St | 0.16mi | 3/2.5 | 1,429 (-9%) | 13mo | $169,950 | $119 | 64 |
| 915 N 12th St | 0.49mi | 4/3.0 (+1) | 1,504 (-4%) | 0mo | $325,000 | $216 | 60 |
| 322 N 12th St | 0.03mi | 2/1.0 (-1) | 1,372 (-13%) | 11mo | $138,000 | $101 | 59 |
| 315 N 19th St | 0.48mi | 3/1.5 | 1,624 (+3%) | 14mo | $130,000 | $80 | 58 |
| 723 N 14th St | 0.31mi | 4/2.0 (+1) | 1,416 (-10%) | 9mo | $57,000 | $40 | 56 |
| 711 N 18th St | 0.47mi | 4/1.5 (+1) | 1,720 (+9%) | 1mo | $81,000 | $47 | 55 |
| 314 S 15th St | 0.40mi | 3/1.5 | 1,344 (-15%) | 2mo | $80,000 | $60 | 53 |
| 315 W Main St | 0.48mi | 3/1.0 | 1,783 (+13%) | 4mo | $30,000 | $17 | 48 |
| 500 W Stuart St | 0.62mi | 3/1.0 | 1,390 (-12%) | 4mo | $104,000 | $75 | 44 |
| 209 W Clark St | 0.62mi | 2/2.0 (-1) | 1,384 (-12%) | 11mo | $175,000 | $126 | 36 |
| 100 W Willow St | 0.68mi | 4/3.0 (+1) | 1,376 (-13%) | 8mo | $220,000 | $160 | 32 |
Match score weights: distance 35% · size 25% · config 20% · recency 20%. Top-matched comps best support the ARV.
Projected returns pro-forma
-3.0% appreciation · 3.0% rent growth · sell at horizon
- IRR
- -14.7%
- Equity multiple
- 0.48×
- Total profit
- $-16,877
- Equity at exit
- $17,147
- IRR
- -6.0%
- Equity multiple
- 0.61×
- Total profit
- $-12,459
- Equity at exit
- $9,943
Cash invested: $32,200 (down + closing). Projections, not guarantees.
Landlord ↔ Tenant lean methodology
- Overall (STATE)
- 83 Strongly Landlord-Friendly
- State Iowa
- 83 Strongly Landlord-Friendly · R+6
- County
- — inherits STATE
- City
- — inherits STATE
ZIP-level market 51632
- Home prices YoY
- -2.6%
- Active inventory
- 44
- Price-to-rent
- 9.7×
Monthly cashflow live
- Estimated rent
- $991 medium interval (Pro) →
- Mortgage (P&I)
- −$603
- Tax from tax record
- −$104 /mo · $1,248/yr
- Insurance
- −$48
- HOA
- −$0
- Vacancy / Maint / Mgmt
- −$208
- Net cashflow
- $28
Break-even live
Sensitivity live
| Price | -10% $93 | -5% $60 | +0% $28 | +5% $-5 | +10% $-37 |
|---|---|---|---|---|---|
| Rent | -10% $-51 | -5% $-11 | +0% $28 | +5% $67 | +10% $106 |
| Rate | -1.0pp $86 | -0.5pp $57 | base $28 | +0.5pp $-2 | +1.0pp $-32 |
UW: 25.0% down · 7.5% · 30yr · 1.5% tax · 5.0% vac · 8.0% maint · 8.0% mgmt
Financing live
Cash to close
- Down payment
- $28,750
- Closing costs
- $3,450
- Reserves months
- —
- Total cash needed
- —
Loan-product check · same deal, 3 products live
Conventional
25% down · 7.5% · 30yr
- Down + closing
- —
- Monthly P&I
- —
- Monthly cashflow
- —
- DSCR
- —
- Eligible?
- —
Personal DTI + credit; lowest rate.
DSCR
20% down · 8.5% · 30yr
- Down + closing
- —
- Monthly P&I
- —
- Monthly cashflow
- —
- DSCR
- —
- Eligible?
- —
No personal income docs; deal must DSCR.
Hard money
10% down · 12.0% · 12mo
- Down + closing
- —
- Monthly P&I
- —
- Monthly cashflow
- —
- DSCR
- —
- Eligible?
- —
Short-term bridge; refi at stabilization.
Listing history 26 events
-
2026-06-21days on market $115,000 Active 8 DOM
-
2026-06-18days on market $115,000 Active 6 DOM
-
2026-06-17days on market $115,000 Active 5 DOM
-
2026-06-16days on market $115,000 Active 4 DOM
-
2026-06-15days on market $115,000 Active 3 DOM
-
2026-06-13remarks 671-char remark
-
2026-06-13pricedays on market $115,000 Active 1 DOM
-
2026-06-12days on market $120,000 Active 42 DOM
-
2026-06-09days on market $120,000 Active 39 DOM
-
2026-06-08days on market $120,000 Active 38 DOM
-
2026-06-07days on market $120,000 Active 37 DOM
-
2026-06-07days on market $120,000 Active 36 DOM
-
2026-06-04days on market $120,000 Active 33 DOM
-
2026-06-02days on market $120,000 Active 32 DOM
-
2026-06-01days on market $120,000 Active 31 DOM
-
2026-05-31days on market $120,000 Active 30 DOM
-
2026-05-31days on market $120,000 Active 29 DOM
-
2026-05-01$120,000 Active 671-char remark
-
2026-04-07$125,000 Active
-
2026-01-10$125,000 Active
-
2023-03-13soldstatus $73,000
-
2023-03-07soldstatus $73,000 Closed
-
2023-02-23status Pending
-
2023-01-27price $85,000
-
2022-10-18$100,000 Active
-
1975-12-08soldstatus $14,250
ⓘ Source: listings_history table (triggers on properties + properties_extension) + one-shot
backfill from property_details.listing_events for pre-trigger history.
Tax reassessment forecast IA · Partial reset (capped growth)
- Current annual tax
- $1,248 · $104/mo
- Projected year-2 tax
- $1,527 · $127/mo
- Expected delta
- +$279/yr (+$23/mo · 22.3%)
ⓘ Screening estimate from a state-policy table — verify with the county assessor before closing.
Climate risk First Street
- Flood 1/10 Low FEMA zone X (unshaded) · 0% chance over 30 yrs
- Wildfire 1/10 Low
- Heat 3/10 Moderate 7 d/yr ≥105°F today · 15 d/yr by 30 yrs out
- Wind 2/10 Low
- Air quality 1/10 Low 0 unhealthy d/yr today · 0 by 30 yrs out
Nearby sold comps map
Loading sold comps map…
Walkable amenities ~0.75 mi
Loading nearby amenities…
Taxation est. · year 1
- Rental income
- $11,890
- − Mortgage interest
- −$6,442
- − Property taxes
- −$1,248
- − Insurance
- −$575
- − Repairs & maintenance
- −$951
- − Management
- −$951
- − Depreciation
- −$3,345
- Taxable loss
- −$1,623
- Est. tax savings @ 24.0%
- +$389
- After-tax cash flow
- $722/yr
For passive investors: Depreciation is non-cash, so a rental often shows a tax loss while cash-flowing — sheltering income. Rental losses are passive: they offset passive income freely, and up to $25,000/yr can offset ordinary (W-2) income if you actively participate and your MAGI is under $100k (phasing out to $0 by $150k); unused losses carry forward. On sale, claimed depreciation is recaptured at up to 25%, and gains may owe capital-gains tax (a 1031 exchange can defer both). Figures are a year-1 estimate at your 24.0% rate — not tax advice; consult a CPA.
Schools (NCES district)
- District
- Clarinda Community School District
- NCES district ID
- 1907350
- Math proficiency
- 61% ▲ 2.00%
- Reading proficiency
- 59% ▲ 2.00%
- Median HH income
- $46,371
- Composite
- 50.74/100
- National rank
- #1814
- State rank
- #249 of 289 in IA
Livability — Clarinda
- Score
- 73/100
- State rank
- #289
- US rank
- #5589
Category grades
Schools grade is shown separately in the Schools card above.
Census & demographics
- Census place
- Clarinda, IA
- City population
- 6,682
- Population (ZIP)
- 6,682
Population outlook (Page County) Hauer SSP2
- Today (2025)
- 15,052 people
- By 2030
- 14,709 · -2.3%
- By 2040
- 13,981 · -7.1%
- By 2050
- 13,302 · -11.6%
- By 2075
- 11,678 · -22.4%
- By 2100
- 9,213 · -38.8%
Race, ethnicity, and origin ACS 2023
- Neighborhood character
- Predominantly White (87%)
- Race & ethnicity
- White 87% Two or more races 5% Black 4% Hispanic / Latino 3% Asian 1%
- Common ancestry
- Slovak 2% Portuguese 2% Iranian 1%
- Foreign-born
- 2% · Canada, Vietnam
- Languages at home
- 98% English-only · Spanish 1% Vietnamese 1%
Political lean MEDSL · Page
- 2024 margin
- Solid R (+42.4) · D 28.2% · R 70.6% · Other 1.1%
- 2008→2024 swing
- -22.7pp toward R · 2008: -19.7pp · 2024: -42.4pp
- All cycles
- 2024: R+42.4 2020: R+43.0 2016: R+44.1 2012: R+24.9 2008: R+19.7
Not yet ingested
- Civics
- —
Market trends
- HPI YoY
- ▼ -4.86%
- Current HPI
- 179.9325
- Rent YoY
- —
- Metro
- —
- State GDP YoY
- ▲ 2.48%
- F500 in state
- 4
Industry mix (Fortune 500 HQ in IA)
| Industry | F500 HQs | Revenue |
|---|---|---|
| Financial Services | 1 | $16B |
|
||
| Retail / Convenience | 1 | $15B |
|
||
Price history
+707.0% since first listed10 events — show timeline
- 2026-06-12 Listed $115,000 SWIAR
- 2026-05-01 Listed $120,000 SWIAR
- 2026-04-07 Listed $125,000 SWIAR
- 2026-01-10 Listed $125,000 SWIAR
- 2023-03-13 Sold (Public Records) $73,000 Public Records
- 2023-03-07 Sold (MLS) $73,000 IAR
- 2023-02-23 Pending — IAR
- 2023-01-27 Price Changed $85,000 IAR
- 2022-10-18 Listed $100,000 IAR
- 1975-12-08 Sold (Public Records) $14,250 Public Records
Property tax history
+5.2%/yrLatest (2025): $1,248 · +1.5% YoY. Source: county tax records.
Cash-flow waterfall
monthlySold comps — $/sqft
last 12 mo · ≤1 miLoading sold comps…