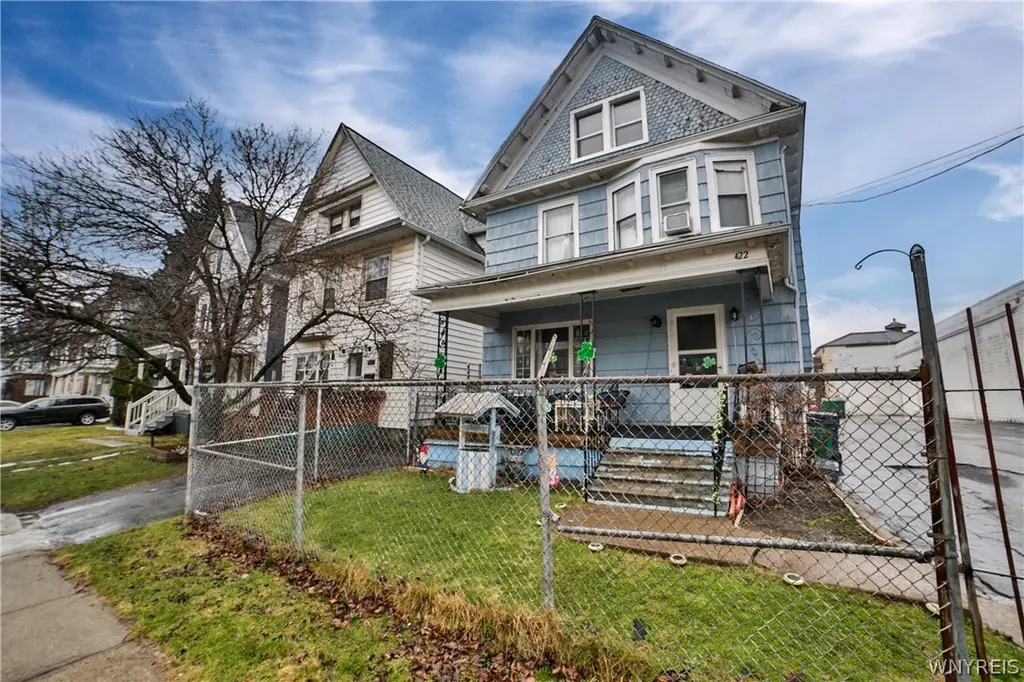
422 Marilla St · Buffalo, NY
Flood risk 1/10 · Minimal
- FEMA flood zone
- X (unshaded)
- Chance of flooding over 30 yrs
- 0.0%
- Est. flood insurance / yr
- $473 – $860
Fire risk 1/10 · Minimal
- Est. fire insurance / yr
- $691 – $1,283
Heat risk 3/10 · Minor
- Hot days now (above 92°F)
- 7 days/yr
- Hot days in 30 yrs
- 15 days/yr
Wind risk 1/10 · Minimal
- Chance of severe wind over 30 yrs
- —
Air-quality risk 4/10 · Minor
- Unhealthy air days now
- 3 days/yr
- Unhealthy air days in 30 yrs
- 8 days/yr
Risk factors via First Street. Map © Google.
Why this score? — see what drove the C+ grade
The composite is a weighted blend of 9 inputs, each scored 0–100. Each bar is that input's sub-score; the figure is the points it added to the 100-point composite (weight × sub-score).
- Cash flow +22.7/30.0
- ARV discount +15.0/15.0
- DSCR +7.3/10.0
- 1% rule +4.6/10.0
- Rent growth +4.4/5.0
- Livability +3.9/5.0
- Schools +3.3/10.0
- Condition / age +2.5/5.0
- Appreciation +0.0/10.0
$164,900
🖨 Deal sheet (PDF) 📄 Offer letter ✓ Due diligence
Listing remarks MLS
Welcome to 422 Marilla Street in the heart of South Buffalo! This classic old-style home offers 4 bedrooms and 1.5 baths with plenty of space and character throughout. The first and second floors provide comfortable living with generously sized rooms, while the partially finished attic offers excellent potential for a fifth bedroom, home office, or additional living space. Major mechanical updates include a newer furnace and hot water tank, providing peace of mind for years to come. The home also features a full basement for additional storage and a convenient one-car attached garage. Located in the South Buffalo neighborhood close to local amenities, parks, and shops.
Key facts
- Hot water tank
- Newer furnace
- Full basement
Tags
Neighborhood map
What this means for you Summary
Snapshot
- This is a 3-bed/1.5-bath single-family listed at $165k.
Deal economics
- At list price, monthly cash flow is $283 ($3k/yr) — positive.
- The deal already cash-flows at list — no discount required.
- To meet the 1% rule (rent ≥ 1% of price), the offer needs to be $159k (3.6% below list).
- Recommended offer: $155k (6.0% below list) — sets the bar for market timing.
Location & tenants
- Location reads 77/100 on livability (#195 in NY, #3,011 nationally) — a middle-class / working-renter tenant base. Strengths: commute A+, housing A+, health & safety A+; Watch: crime F, employment D-.
- Buffalo City School District (urban): math 41% / reading 40% proficiency, ranked #535 of 590 in NY (top 91%) — families likely to look elsewhere, expect single-tenant / working-renter base with shorter leases; 75% free/reduced lunch — lower-income household profile, screen leases tightly.
- Market conditions: Rents rising fast (+7.6%/yr); 136 active listings in the ZIP; 4 comparable units currently listed for rent nearby; rentals leasing fast (median 2d on market — plan ~1-2 weeks tenant-placement turnaround); 1,244 units permitted in Erie County in 2024 (563 in 5+ unit buildings).
Forward outlook
- Local home prices are declining (-3.0%/yr); year-one equity from $1k of loan paydown is wiped out by about $5k of value loss. Plan a longer hold.
- At projected returns (-3.0% appreciation + 7.6% rent growth), your $46k cash investment doubles in ~9 years — after that, you're playing with house money.
Negotiation context
- It's been on market 90 days — a 6% lower offer ($155k) is reasonable based on typical stale-listing flexibility.
Risks & watch-outs
- Watch-outs: built in 1901 — expect roof / HVAC / electrical / plumbing capex.
Questions for the listing agent
- It's been on market 90 days. Have you received any prior offers? Is the seller open to a 6% concession, seller financing, or rate buy-down credit?
- Built in 1901 — when were the roof, HVAC, electrical panel, plumbing, and water heater last replaced?
- Why hasn't it sold? Are there any deal-killer items the seller is aware of (foundation, flood, title, zoning, code violations)?
- Is there a deadline driving the sale (1031 exchange, divorce, estate, relocation)? That informs how much negotiation room exists.
- Crime grade is F in this area — have there been break-ins, vandalism, or insurance claims at this property in the last 3 years? What carrier currently insures it and at what premium?
- What's the average days-on-market for RENTAL listings here right now (not sales)? A rising rental-DOM trend means longer vacancies and softer asking-rent achievability than the comps imply.
- What's the recent tenant-quality profile in this submarket — average credit score on applications, eviction rate, late-payment / NSF rate, and stable-employment percentage? A property-management company in the area should have these aggregated.
- How much new for-sale + rental construction is in the pipeline within 1–3 miles? Heavy new supply typically softens prices + rents 12–24 months out; constrained supply supports both.
Investment metrics
- 1% rule
- 0.96% ✗
- Cap rate
- 8.35%
- Cash-on-cash
- 7.35%
- DSCR
- 1.33
- GRM
- 8.6
CMA / ARV
- ARV (median comp)
- $264,904
- List price
- $164,900
- Delta
- -37.75%
- Verdict
- UNDERPRICED
- Comps
- 20 within 1.0 mi
Show comp detail 12 sales within ~0.75 mi
| Address | Dist | Beds/Ba | Sqft | Sold | Price | $/sf | Match |
|---|---|---|---|---|---|---|---|
| 106 Cantwell Dr | 0.27mi | 4/2.0 (+1) | 1,889 (+4%) | 3mo | $360,000 | $191 | 70 |
| 289 Okell St | 0.24mi | 3/1.5 | 1,560 (-14%) | 5mo | $232,500 | $149 | 62 |
| 1141 Mckinley Pkwy | 0.57mi | 3/1.0 | 1,854 (+2%) | 6mo | $275,000 | $148 | 62 |
| 1062 Tifft St | 0.70mi | 4/1.5 (+1) | 1,800 (-0%) | 0mo | $180,000 | $100 | 61 |
| 95 Aldrich Pl | 0.39mi | 3/1.5 | 1,568 (-13%) | 1mo | $270,000 | $172 | 59 |
| 37 Bloomfield Ave | 0.54mi | 4/2.0 (+1) | 1,874 (+4%) | 5mo | $225,000 | $120 | 58 |
| 53 Choate Ave | 0.50mi | 3/1.0 | 1,599 (-12%) | 1mo | $198,000 | $124 | 54 |
| 60 Woodside Ave | 0.37mi | 3/1.0 | 1,568 (-13%) | 7mo | $164,900 | $105 | 53 |
| 29 Allegany St | 0.73mi | 4/1.0 (+1) | 1,750 (-3%) | 2mo | $229,900 | $131 | 52 |
| 121 Aldrich Pl | 0.42mi | 4/1.5 (+1) | 1,620 (-10%) | 8mo | $191,900 | $118 | 51 |
| 1349 Mckinley Pkwy | 0.62mi | 4/2.5 (+1) | 1,920 (+6%) | 3mo | $280,000 | $146 | 49 |
| 133 Hollywood Ave | 0.75mi | 4/2.0 (+1) | 1,648 (-9%) | 6mo | $280,000 | $170 | 38 |
Match score weights: distance 35% · size 25% · config 20% · recency 20%. Top-matched comps best support the ARV.
Projected returns pro-forma
-3.0% appreciation · 7.62% rent growth · sell at horizon
- IRR
- -0.6%
- Equity multiple
- 0.98×
- Total profit
- $-1,049
- Equity at exit
- $24,587
- IRR
- 13.0%
- Equity multiple
- 2.23×
- Total profit
- $56,898
- Equity at exit
- $14,258
Cash invested: $46,172 (down + closing). Projections, not guarantees.
Landlord ↔ Tenant lean methodology
- Overall (STATE)
- 15 Strongly Tenant-Friendly
- State New York
- 15 Strongly Tenant-Friendly · D+10
- County
- — inherits STATE
- City
- — inherits STATE
ZIP-level market 14220
- Home prices YoY
- -26.7%
- Rents YoY
- 7.6%
- Active inventory
- 136
- Price-to-rent
- 8.6×
Monthly cashflow live
- Estimated rent
- $1,590 medium interval (Pro) →
- Mortgage (P&I)
- −$865
- Tax from tax record
- −$40 /mo · $482/yr
- Insurance
- −$69
- HOA
- −$0
- Vacancy / Maint / Mgmt
- −$334
- Net cashflow
- $283
Break-even live
Sensitivity live
| Price | -10% $376 | -5% $329 | +0% $283 | +5% $236 | +10% $189 |
|---|---|---|---|---|---|
| Rent | -10% $157 | -5% $220 | +0% $283 | +5% $346 | +10% $408 |
| Rate | -1.0pp $366 | -0.5pp $325 | base $283 | +0.5pp $240 | +1.0pp $197 |
UW: 25.0% down · 7.5% · 30yr · 1.5% tax · 5.0% vac · 8.0% maint · 8.0% mgmt
Financing live
Cash to close
- Down payment
- $41,225
- Closing costs
- $4,947
- Reserves months
- —
- Total cash needed
- —
Loan-product check · same deal, 3 products live
Conventional
25% down · 7.5% · 30yr
- Down + closing
- —
- Monthly P&I
- —
- Monthly cashflow
- —
- DSCR
- —
- Eligible?
- —
Personal DTI + credit; lowest rate.
DSCR
20% down · 8.5% · 30yr
- Down + closing
- —
- Monthly P&I
- —
- Monthly cashflow
- —
- DSCR
- —
- Eligible?
- —
No personal income docs; deal must DSCR.
Hard money
10% down · 12.0% · 12mo
- Down + closing
- —
- Monthly P&I
- —
- Monthly cashflow
- —
- DSCR
- —
- Eligible?
- —
Short-term bridge; refi at stabilization.
Rent comps 4 comps
| Address | Beds | Baths | Sqft | Rent | $/sqft | DOM | Units | Dist |
|---|---|---|---|---|---|---|---|---|
| 74 Woodside Ave Unit 1 Buffalo, NY | 3.0 | 1.0 | 1250 | $1,510 | $1.21 | 2d | 1 | 0.42mi |
| 21 Amber St Unit UPPER Buffalo, NY | 2.0 | 1.0 | 2112 | $1,700 | $0.80 | 2d | 1 | 0.63mi |
| 86 Edgewood Ave Buffalo, NY | 2.0 | 2.0 | 1700 | $1,700 | $1.00 | 2d | 1 | 0.93mi |
| 89 Macamley St #2 Buffalo, NY | 3.0 | 1.0 | 1274 | $1,100 | $0.86 | 11d | 1 | 1.13mi |
Listing history 18 events
-
2026-06-18days on market $164,900 Active 90 DOM
-
2026-06-17days on market $164,900 Active 89 DOM
-
2026-06-16days on market $164,900 Active 88 DOM
-
2026-06-15days on market $164,900 Active 87 DOM
-
2026-06-13days on market $164,900 Active 85 DOM
-
2026-06-13days on market $164,900 Active 84 DOM
-
2026-06-10days on market $164,900 Active 82 DOM
-
2026-06-09days on market $164,900 Active 81 DOM
-
2026-06-08days on market $164,900 Active 80 DOM
-
2026-06-07pricedays on market $164,900 Active 79 DOM
-
2026-06-03days on market $184,900 Active 75 DOM
-
2026-06-02days on market $184,900 Active 74 DOM
-
2026-06-01days on market $184,900 Active 73 DOM
-
2026-05-31days on market $184,900 Active 72 DOM
-
2026-03-20$184,900 Active 677-char remark
Show marketing remark (677 chars)
Welcome to 422 Marilla Street in the heart of South Buffalo! This classic old-style home offers 4 bedrooms and 1.5 baths with plenty of space and character throughout. The first and second floors provide comfortable living with generously sized rooms, while the partially finished attic offers excellent potential for a fifth bedroom, home office, or additional living space. Major mechanical updates include a newer furnace and hot water tank, providing peace of mind for years to come. The home also features a full basement for additional storage and a convenient one-car attached garage. Located in the South Buffalo neighborhood close to local amenities, parks, and shops.
-
2025-07-22soldstatus $155,360
-
2019-01-10soldstatus $61,000
-
1995-10-30soldstatus $53,500
ⓘ Source: listings_history table (triggers on properties + properties_extension) + one-shot
backfill from property_details.listing_events for pre-trigger history.
Tax reassessment forecast NY · Partial reset (capped growth)
- Current annual tax
- $482 · $40/mo
- Projected year-2 tax
- $1,634 · $136/mo
- Expected delta
- +$1,152/yr (+$96/mo · 239.1%)
ⓘ Screening estimate from a state-policy table — verify with the county assessor before closing.
Climate risk First Street
- Flood 1/10 Low FEMA zone X (unshaded) · 0% chance over 30 yrs
- Wildfire 1/10 Low
- Heat 3/10 Moderate 7 d/yr ≥92°F today · 15 d/yr by 30 yrs out
- Wind 1/10 Low
- Air quality 4/10 Moderate 3 unhealthy d/yr today · 8 by 30 yrs out
Nearby sold comps map
Loading sold comps map…
Walkable amenities ~0.75 mi
Loading nearby amenities…
Taxation est. · year 1
- Rental income
- $19,085
- − Mortgage interest
- −$9,237
- − Property taxes
- −$482
- − Insurance
- −$824
- − Repairs & maintenance
- −$1,527
- − Management
- −$1,527
- − Depreciation
- −$4,797
- Taxable income
- $691
- Est. tax owed @ 24.0%
- −$166
- After-tax cash flow
- $3,228/yr
For passive investors: Depreciation is non-cash, so a rental often shows a tax loss while cash-flowing — sheltering income. Rental losses are passive: they offset passive income freely, and up to $25,000/yr can offset ordinary (W-2) income if you actively participate and your MAGI is under $100k (phasing out to $0 by $150k); unused losses carry forward. On sale, claimed depreciation is recaptured at up to 25%, and gains may owe capital-gains tax (a 1031 exchange can defer both). Figures are a year-1 estimate at your 24.0% rate — not tax advice; consult a CPA.
Schools (NCES district)
- District
- Buffalo City School District
- NCES district ID
- 3605850
- Math proficiency
- 41% ▲ 11.00%
- Reading proficiency
- 40% ▲ 7.00%
- Median HH income
- $31,665
- Composite
- 33.17/100
- National rank
- #5544
- State rank
- #535 of 590 in NY
Livability — Buffalo
- Score
- 77/100
- State rank
- #195
- US rank
- #3011
Category grades
Schools grade is shown separately in the Schools card above.
Census & demographics
- Census place
- Buffalo, NY
- County
- Erie County · 714,559 people
- City population
- 440,021
- Metro
- Buffalo-Cheektowaga, NY
- Population (ZIP)
- 24,428
- Household income
- $70,963
- Rent vs Own
- Severe rent burden
- 602.0
Population outlook (Erie County) Hauer SSP2
- Today (2025)
- 933,037 people
- By 2030
- 935,181 · +0.2%
- By 2040
- 928,531 · -0.5%
- By 2050
- 905,725 · -2.9%
- By 2075
- 834,037 · -10.6%
- By 2100
- 708,033 · -24.1%
Race, ethnicity, and origin ACS 2023
- Neighborhood character
- Predominantly White (76%)
- Race & ethnicity
- White 76% Hispanic / Latino 13% Two or more races 6% Black 5% Asian 2%
- Hispanic origin (detail)
- Puerto Rican 10% Cuban 1%
- Common ancestry
- Romanian 16% Lithuanian 1% Subsaharan African 1%
- Foreign-born
- 4% · Canada, Jamaica, China
- Languages at home
- 90% English-only · Spanish 4% Chinese 1%
Political lean MEDSL · Erie
- 2024 margin
- Lean D (+9.7) · D 54.8% · R 45.2%
- 2008→2024 swing
- -7.9pp toward R · 2008: 17.5pp · 2024: 9.7pp
- All cycles
- 2024: D+9.7 2020: D+14.7 2016: D+4.8 2012: D+15.6 2008: D+17.5
Not yet ingested
- Civics
- —
Market trends
- HPI YoY
- ▼ -146.29%
- Current HPI
- 402.5053
- Rent YoY
- ▲ 7.62%
- Metro
- Buffalo-Cheektowaga, NY
- State GDP YoY
- ▲ 2.60%
- F500 in state
- 92
Industry mix (Fortune 500 HQ in NY)
| Industry | F500 HQs | Revenue |
|---|---|---|
| Financial Services | 10 | $950B |
|
||
| Consumer Goods | 9 | $162B |
|
||
| Insurance | 4 | $225B |
|
||
| Telecommunications | 2 | $144B |
|
||
| Pharmaceuticals | 2 | $112B |
|
||
| Media / Entertainment | 2 | $69B |
|
||
Price history
+245.6% since first listed4 events — show timeline
- 2026-03-20 Listed $184,900 WNYREIS
- 2025-07-22 Sold (Public Records) $155,360 Public Records
- 2019-01-10 Sold (Public Records) $61,000 Public Records
- 1995-10-30 Sold (Public Records) $53,500 Public Records
Property tax history
+3.9%/yrLatest (2025): $482 · +0.0% YoY. Source: county tax records.
Cash-flow waterfall
monthlySold comps — $/sqft
last 12 mo · ≤1 miLoading sold comps…