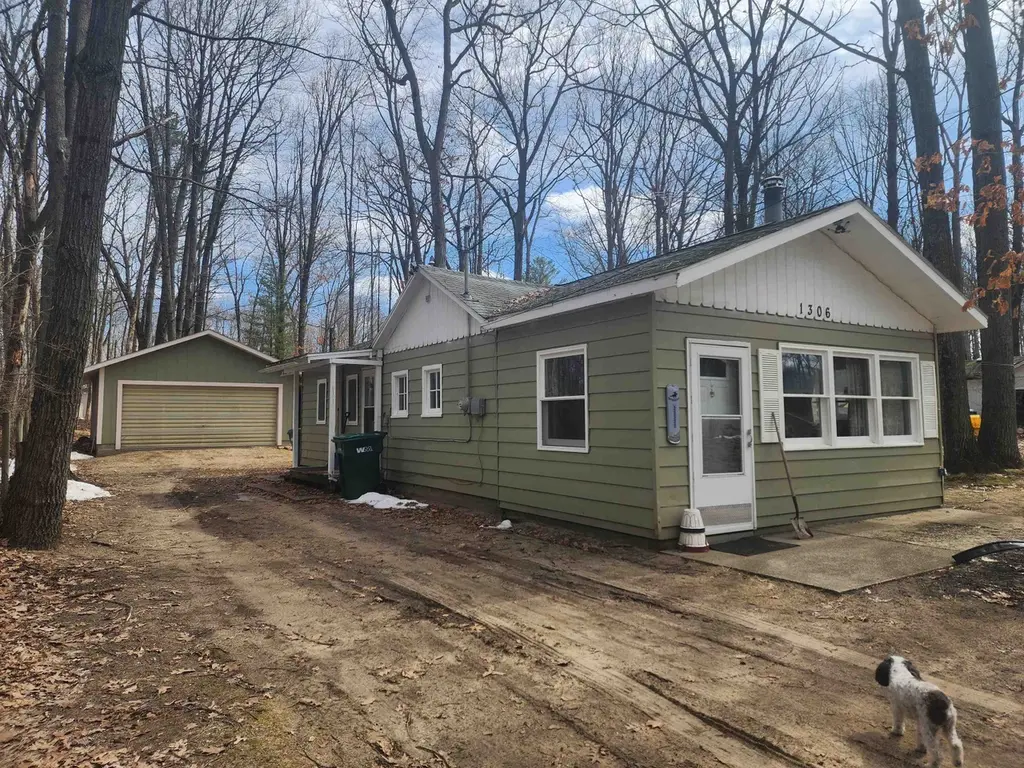
1306 Russell Dr · Hayes, MI
Flood risk 1/10 · Minimal
- FEMA flood zone
- X (unshaded)
- Chance of flooding over 30 yrs
- 0.0%
- Est. flood insurance / yr
- $473 – $860
Fire risk 4/10 · Minor
- Est. fire insurance / yr
- $784 – $1,456
Heat risk 1/10 · Minimal
- Hot days now (above 94°F)
- 7 days/yr
- Hot days in 30 yrs
- 13 days/yr
Wind risk 1/10 · Minimal
- Chance of severe wind over 30 yrs
- —
Air-quality risk 2/10 · Minimal
- Unhealthy air days now
- 1 days/yr
- Unhealthy air days in 30 yrs
- 1 days/yr
Risk factors via First Street. Map © Google.
Why this score? — see what drove the C- grade
The composite is a weighted blend of 9 inputs, each scored 0–100. Each bar is that input's sub-score; the figure is the points it added to the 100-point composite (weight × sub-score).
- Cash flow +21.3/30.0
- ARV discount +10.3/15.0
- DSCR +6.8/10.0
- 1% rule +4.4/10.0
- Rent growth +2.5/5.0
- Livability +2.5/5.0
- Condition / age +2.5/5.0
- Schools +1.8/10.0
- Appreciation +0.0/10.0
$89,900
🖨 Deal sheet 📄 Offer letter ✓ Due diligence
Listing remarks MLS
Charming, well-located home on the edge of town with easy access to Budd Lake. This cozy 756 sq ft residence sits on a large, fenced lot with mature shade trees—perfect for pets—and a backyard fire pit for evening bonfires. Interior highlights: vaulted ceilings that create an open, airy feel; a bright kitchen with range and refrigerator; a spacious living room with dual ceiling fans; and a front bounce room with a wood stove for added warmth. One bedroom offers a generous closet; the bathroom features ceramic tile. Detached garage includes electricity and a wood stove. Natural gas heat is a standout feature. Ideal for a first-time buyer or someone looking to downsize in a desirable location. Call today to learn more.
Key facts
- Bright kitchen
- Large fenced lot
- Mature shade trees
Tags
Neighborhood map
What this means for you Summary
Snapshot
- This is a 2-bed/1.0-bath single-family listed at $90k.
Deal economics
- At list price, monthly cash flow is $132 ($2k/yr) — positive.
- The deal already cash-flows at list — no discount required.
- To meet the 1% rule (rent ≥ 1% of price), the offer needs to be $84k (6.2% below list).
- Recommended offer: $84k (6.2% below list) — sets the bar for 1% rule.
Location & tenants
- Location reads: area grade C — affects rentability + tenant quality, not the cash-flow math above.
- Harrison Community Schools (town): math 17% / reading 28% proficiency, ranked #457 of 540 in MI (top 85%) — low school quality limits family demand, transient renter base, plan for 1-2y turnover; 65% free/reduced lunch — lower-income household profile, screen leases tightly.
- Market conditions: 238 active listings in the ZIP; 77 units permitted in Clare County in 2024 (0 in 5+ unit buildings).
Forward outlook
- Local home prices are declining (-3.0%/yr); year-one equity from $622 of loan paydown is wiped out by about $3k of value loss. Plan a longer hold.
- Clare County population projected at -20% by 2050 — secular population decline; favor cash flow + early exit over multi-decade hold.
Negotiation context
- It's been on market 79 days — a 6% lower offer ($85k) is reasonable based on typical stale-listing flexibility.
- 4 sale attempts since 5y ago with the ask held roughly flat each time — persistent listings suggest the price (not the market) is what's stuck; bring a comps-based counter.
- Current owner paid $68k; 32% above their basis — modest negotiation headroom, anchor on the comps not their cost.
Risks & watch-outs
- Watch-outs: built in 1958 — expect roof / HVAC / electrical / plumbing capex.
Questions for the listing agent
- It's been on market 79 days. Have you received any prior offers? Is the seller open to a 6% concession, seller financing, or rate buy-down credit?
- Built in 1958 — when were the roof, HVAC, electrical panel, plumbing, and water heater last replaced?
- Why hasn't it sold? Are there any deal-killer items the seller is aware of (foundation, flood, title, zoning, code violations)?
- Is there a deadline driving the sale (1031 exchange, divorce, estate, relocation)? That informs how much negotiation room exists.
- What's the average days-on-market for RENTAL listings here right now (not sales)? A rising rental-DOM trend means longer vacancies and softer asking-rent achievability than the comps imply.
- What's the recent tenant-quality profile in this submarket — average credit score on applications, eviction rate, late-payment / NSF rate, and stable-employment percentage? A property-management company in the area should have these aggregated.
- How much new for-sale + rental construction is in the pipeline within 1–3 miles? Heavy new supply typically softens prices + rents 12–24 months out; constrained supply supports both.
Investment metrics
- 1% rule
- 0.94% ✗
- Cap rate
- 8.06%
- Cash-on-cash
- 6.30%
- DSCR
- 1.28
- GRM
- 8.9
CMA / ARV
- ARV (median comp)
- $95,975
- List price
- $89,900
- Delta
- -6.33%
- Verdict
- FAIR
- Comps
- 13 within 1.0 mi
Show comp detail 3 sales within ~0.75 mi
| Address | Dist | Beds/Ba | Sqft | Sold | Price | $/sf | Match |
|---|---|---|---|---|---|---|---|
| 1268 N Clare Ave | 0.16mi | 2/1.0 | 816 (+8%) | 5mo | $100,000 | $123 | 75 |
| 1364 James St | 0.07mi | 2/1.0 | 864 (+14%) | 8mo | $40,000 | $46 | 67 |
| 1024 Burrington St | 0.30mi | 1/1.0 (-1) | 648 (-14%) | 22mo | $43,000 | $66 | 39 |
Match score weights: distance 35% · size 25% · config 20% · recency 20%. Top-matched comps best support the ARV.
Projected returns pro-forma
-3.0% appreciation · 3.0% rent growth · sell at horizon
- IRR
- -6.6%
- Equity multiple
- 0.75×
- Total profit
- $-6,186
- Equity at exit
- $13,404
- IRR
- 2.9%
- Equity multiple
- 1.21×
- Total profit
- $5,293
- Equity at exit
- $7,773
Cash invested: $25,172 (down + closing). Projections, not guarantees.
Landlord ↔ Tenant lean methodology
- Overall (STATE)
- 62 Landlord-Friendly
- State Michigan
- 62 Landlord-Friendly · EVEN
- County
- — inherits STATE
- City
- — inherits STATE
ZIP-level market 48625
- Home prices YoY
- -25.5%
- Active inventory
- 238
- Price-to-rent
- 8.9×
Monthly cashflow live
- Estimated rent
- $844 medium interval (Pro) →
- Mortgage (P&I)
- −$471
- Tax from tax record
- −$25 /mo · $304/yr
- Insurance
- −$37
- HOA
- −$0
- Vacancy / Maint / Mgmt
- −$177
- Net cashflow
- $132
Break-even live
UW: 25.0% down · 7.5% · 30yr · 1.5% tax · 5.0% vac · 8.0% maint · 8.0% mgmt
Financing live
Cash to close
- Down payment
- $22,475
- Closing costs
- $2,697
- Reserves months
- —
- Total cash needed
- —
Loan-product check · same deal, 3 products live
Conventional
25% down · 7.5% · 30yr
- Down + closing
- —
- Monthly P&I
- —
- Monthly cashflow
- —
- DSCR
- —
- Eligible?
- —
Personal DTI + credit; lowest rate.
DSCR
20% down · 8.5% · 30yr
- Down + closing
- —
- Monthly P&I
- —
- Monthly cashflow
- —
- DSCR
- —
- Eligible?
- —
No personal income docs; deal must DSCR.
Hard money
10% down · 12.0% · 12mo
- Down + closing
- —
- Monthly P&I
- —
- Monthly cashflow
- —
- DSCR
- —
- Eligible?
- —
Short-term bridge; refi at stabilization.
Listing history 24 events
-
2026-06-18days on market $89,900 Active 79 DOM
-
2026-06-17days on market $89,900 Active 78 DOM
-
2026-06-16days on market $89,900 Active 77 DOM
-
2026-06-15days on market $89,900 Active 76 DOM
-
2026-06-13days on market $89,900 Active 74 DOM
-
2026-06-12days on market $89,900 Active 73 DOM
-
2026-06-09days on market $89,900 Active 70 DOM
-
2026-06-08days on market $89,900 Active 69 DOM
-
2026-06-07days on market $89,900 Active 68 DOM
-
2026-06-07days on market $89,900 Active 67 DOM
-
2026-06-04days on market $89,900 Active 64 DOM
-
2026-06-02days on market $89,900 Active 63 DOM
-
2026-06-01days on market $89,900 Active 62 DOM
-
2026-05-31days on market $89,900 Active 61 DOM
-
2026-05-31days on market $89,900 Active 60 DOM
-
2026-03-30$89,900 Active 738-char remark
Show marketing remark (738 chars)
Charming, well-located home on the edge of town with easy access to Budd Lake. This cozy 756 sq ft residence sits on a large, fenced lot with mature shade trees—perfect for pets—and a backyard fire pit for evening bonfires. Interior highlights: vaulted ceilings that create an open, airy feel; a bright kitchen with range and refrigerator; a spacious living room with dual ceiling fans; and a front bounce room with a wood stove for added warmth. One bedroom offers a generous closet; the bathroom features ceramic tile. Detached garage includes electricity and a wood stove. Natural gas heat is a standout feature. Ideal for a first-time buyer or someone looking to downsize in a desirable location. Call today to learn more.
-
2026-03-02historical
-
2026-01-31status Active
-
2026-01-06status Pending
-
2025-07-01price $77,000
-
2025-03-25$83,900 Active
-
2021-07-30soldstatus $68,000
-
2021-05-24status Pending
-
2021-05-17$68,000 Active
ⓘ Source: listings_history table (triggers on properties + properties_extension) + one-shot
backfill from property_details.listing_events for pre-trigger history.
Tax reassessment forecast MI · Partial reset (capped growth)
- Current annual tax
- $304 · $25/mo
- Projected year-2 tax
- $844 · $70/mo
- Expected delta
- +$540/yr (+$45/mo · 177.6%)
ⓘ Screening estimate from a state-policy table — verify with the county assessor before closing.
Climate risk First Street
- Flood 1/10 Low FEMA zone X (unshaded) · 0% chance over 30 yrs
- Wildfire 4/10 Moderate
- Heat 1/10 Low 7 d/yr ≥94°F today · 13 d/yr by 30 yrs out
- Wind 1/10 Low
- Air quality 2/10 Low 1 unhealthy d/yr today · 1 by 30 yrs out
Nearby sold comps map
Loading sold comps map…
Walkable amenities ~0.75 mi
Loading nearby amenities…
Taxation est. · year 1
- Rental income
- $10,124
- − Mortgage interest
- −$5,036
- − Property taxes
- −$304
- − Insurance
- −$450
- − Repairs & maintenance
- −$810
- − Management
- −$810
- − Depreciation
- −$2,615
- Taxable income
- $99
- Est. tax owed @ 24.0%
- −$24
- After-tax cash flow
- $1,563/yr
For passive investors: Depreciation is non-cash, so a rental often shows a tax loss while cash-flowing — sheltering income. Rental losses are passive: they offset passive income freely, and up to $25,000/yr can offset ordinary (W-2) income if you actively participate and your MAGI is under $100k (phasing out to $0 by $150k); unused losses carry forward. On sale, claimed depreciation is recaptured at up to 25%, and gains may owe capital-gains tax (a 1031 exchange can defer both). Figures are a year-1 estimate at your 24.0% rate — not tax advice; consult a CPA.
Schools (NCES district)
- District
- Harrison Community Schools
- NCES district ID
- 2617820
- Math proficiency
- 17% ▬ 0.00%
- Reading proficiency
- 28% ▼ -5.00%
- Median HH income
- $30,377
- Composite
- 18.07/100
- National rank
- #8977
- State rank
- #457 of 540 in MI
Livability — Hayes
No livability data for this city. (Only ~50 U.S. cities are tracked.)
Census & demographics
- Population (ZIP)
- 12,939
Population outlook (Clare County) Hauer SSP2
- Today (2025)
- 29,283 people
- By 2030
- 28,199 · -3.7%
- By 2040
- 25,722 · -12.2%
- By 2050
- 23,372 · -20.2%
- By 2075
- 18,569 · -36.6%
- By 2100
- 14,320 · -51.1%
Race, ethnicity, and origin ACS 2023
- Neighborhood character
- Predominantly White (93%)
- Race & ethnicity
- White 93% Two or more races 4% Hispanic / Latino 3%
- Common ancestry
- Romanian 6% Lithuanian 4% Scotch-Irish 2%
- Foreign-born
- 0%
- Languages at home
- 99% English-only · Spanish 1% German/W. Germanic 1%
Political lean MEDSL · Clare
- 2024 margin
- Solid R (+37.6) · D 30.5% · R 68.1% · Other 1.4%
- 2008→2024 swing
- -42.4pp toward R · 2008: 4.8pp · 2024: -37.6pp
- All cycles
- 2024: R+37.6 2020: R+34.8 2016: R+31.8 2012: R+4.8 2008: D+4.8
Not yet ingested
- Civics
- —
Market trends
- HPI YoY
- ▼ -80.38%
- Current HPI
- 234.9586
- Rent YoY
- —
- Metro
- —
- State GDP YoY
- ▲ 1.37%
- F500 in state
- 28
Industry mix (Fortune 500 HQ in MI)
| Industry | F500 HQs | Revenue |
|---|---|---|
| Automotive Parts | 3 | $48B |
|
||
| Automotive | 2 | $372B |
|
||
| Chemicals | 1 | $45B |
|
||
| Automotive Retail | 1 | $29B |
|
||
| Healthcare / Medical Devices | 1 | $23B |
|
||
| Automotive Technology | 1 | $20B |
|
||
Price history
+32.2% since first listed9 events — show timeline
- 2026-03-30 Listed $89,900 MiRealSource-MiMLS
- 2026-03-02 Listing Removed — MiRealSource-MiMLS
- 2026-01-31 Relisted — MiRealSource-MiMLS
- 2026-01-06 Pending — MiRealSource-MiMLS
- 2025-07-01 Price Changed $77,000 MiRealSource-MiMLS
- 2025-03-25 Listed $83,900 MiRealSource-MiMLS
- 2021-07-30 Sold (Public Records) $68,000 Public Records
- 2021-05-24 Pending — MiRealSource-MiMLS
- 2021-05-17 Listed $68,000 MiRealSource-MiMLS
Property tax history
-7.1%/yrLatest (2025): $304 · -64.7% YoY. Source: county tax records.
Cash-flow waterfall
monthlySold comps — $/sqft
last 12 mo · ≤1 miLoading sold comps…