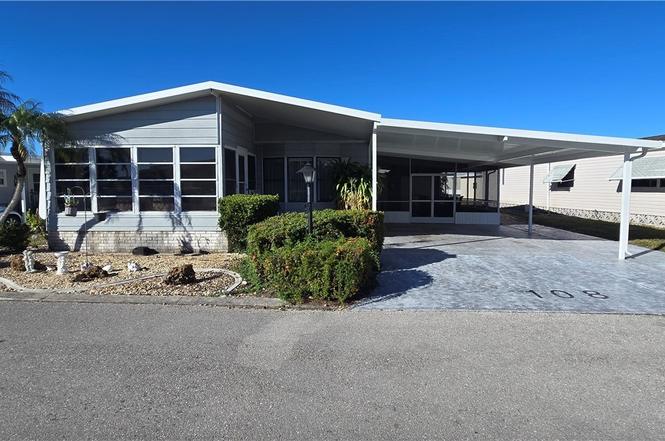
108 Snead Dr · North Fort Myers, FL
Flood risk 1/10 · Minimal
- FEMA flood zone
- X (unshaded)
- Chance of flooding over 30 yrs
- 0.0%
- Est. flood insurance / yr
- $507 – $1,088
Fire risk 5/10 · Moderate
- Est. fire insurance / yr
- $947 – $1,759
Heat risk 9/10 · Severe
- Hot days now (above 106°F)
- 4 days/yr
- Hot days in 30 yrs
- 18 days/yr
Wind risk 10/10 · Severe
- Chance of severe wind over 30 yrs
- 99.0%
Air-quality risk 2/10 · Minimal
- Unhealthy air days now
- 1 days/yr
- Unhealthy air days in 30 yrs
- 1 days/yr
Risk factors via First Street. Map © Google.
Why this score? — see what drove the C+ grade
The composite is a weighted blend of 9 inputs, each scored 0–100. Each bar is that input's sub-score; the figure is the points it added to the 100-point composite (weight × sub-score).
- Cash flow +25.7/30.0
- 1% rule +10.0/10.0
- DSCR +8.6/10.0
- ARV discount +7.5/15.0
- Schools +4.1/10.0
- Livability +3.7/5.0
- Condition / age +2.5/5.0
- Rent growth +2.0/5.0
- Appreciation +0.0/10.0
$104,900
🖨 Deal sheet 📄 Offer letter ✓ Due diligence
Listing remarks
Don't miss this exceptional opportunity to own a home in the exclusive Six Lakes Country Club. This vibrant 55+ community offers an unmatched array of amenities for active, social connections. Tee off anytime on the beautifully maintained private 1-hole executive par-60 golf course, or enjoy friendly competition on the pickleball, tennis, or shuffleboard courts. Stay energized with line dancing - no experience needed. Residents enjoy a full calendar of activities in a resort-style setting, all just 30 minutes from Punta Gorda and Ft. Myers airports. Live the Lifestyle You Deserve in Six Lakes Country Club! Don’t miss your chance to own a home in the highly sought-after Six Lakes Count
Key facts
- Top-rated hospitals
- Resort-style living
- 4,486 sq ft lot
Tags
Property features AI
Finance
- Other: Located in a senior community; Community features include golf and street lights; Zoning: MH-2; One unit in the community
- Financial info: Quarterly association fee (amount listed in records)
- HOA & community: Homeowners association with quarterly fee; Association amenities include clubhouse, fitness center, pool, spa/hot tub, billiards, library, media room, restaurant, golf, putting green, pickleball, shuffleboard, and on-site management; Association fee covers management, cable TV, internet, road maintenance, and street lights
Exterior
- Parking: Attached carport; 2 covered carport spaces
- Utilities: Cable available; High speed internet available; Water assessment paid; Sewer assessment paid
- Home design: Manufactured home; Single-story; Resale property; Vinyl siding
- Construction: Metal roof
- Exterior features: Community pool; No additional exterior features listed; Rectangular lot; Lot dimensions approximately 51 x 80 x 62 x 80; Property faces east; Lot exposure to the west
Interior
- Kitchen: Electric cooktop; Microwave; Dishwasher; Refrigerator
- Bedrooms: Includes Florida room; Includes great room
- Flooring: Laminate
- Bathrooms: 2 full bathrooms
- Heating & cooling: Central heating (electric); Central air conditioning (electric)
- Interior features: Breakfast bar; Cathedral ceilings; Open family/dining area; Combined living and dining room; Cable TV available; High speed internet available; Single-hung windows; Furnished
- Laundry & utility: Washer and dryer included
Neighborhood map
What this means for you Summary
Snapshot
- This is a 2-bed/2.0-bath condo listed at $105k.
Deal economics
- At list price, monthly cash flow is $252 ($3k/yr) — positive.
- The deal already cash-flows at list — no discount required.
- Meets the 1% rule at list price ($2k rent vs $105k).
- Recommended offer: $92k (12.0% below list) — sets the bar for market timing.
- Cap rate 9.2% vs local median 3.6% in North Fort Myers — top-decile yield for the area; either an underpriced asset or a hidden risk that comps aren't pricing in. Stress-test before assuming the spread holds.
Location & tenants
- Location reads 74/100 on livability (#269 in FL, #4,409 nationally) — a middle-class / working-renter tenant base. Strengths: cost of living A+, housing A+, health & safety A+; Watch: employment C-, amenities F, commute F.
- Lee (suburban): math 47% / reading 50% proficiency, ranked #42 of 73 in FL (top 58%) — families likely to look elsewhere, expect single-tenant / working-renter base with shorter leases.
- Market conditions: Rents soft (-1.9%/yr); 472 active listings in the ZIP; 21 comparable units currently listed for rent nearby; rentals at typical pace (median 15d on market — plan ~3-4 weeks tenant-placement turnaround); 15,411 units permitted in Lee County in 2024 (4,686 in 5+ unit buildings).
- This rent runs 38% of the median local income ($57k/yr) — at the standard rent-burdened threshold; future hikes will face affordability resistance.
Forward outlook
- Local home prices are declining (-3.0%/yr); year-one equity from $725 of loan paydown is wiped out by about $3k of value loss. Plan a longer hold.
- Lee County population projected at +44% by 2050 — long-run rental-demand tailwind backs the buy-and-hold thesis.
Negotiation context
- It's been on market 151 days — a 12% lower offer ($92k) is reasonable based on typical stale-listing flexibility.
- 6 sale attempts since 5y ago with the ask held roughly flat each time — persistent listings suggest the price (not the market) is what's stuck; bring a comps-based counter.
Risks & watch-outs
- Watch-outs: HOA is 28% of rent.
- Climate carrying-cost: severe wind risk, 99% chance of damaging wind over 30y; moderate wildfire risk; extreme-heat days projected 4→18/yr by 2055 (HVAC capex compounding) — expect insurance premiums to compound above CPI over the hold.
Questions for the listing agent
- It's been on market 151 days. Have you received any prior offers? Is the seller open to a 12% concession, seller financing, or rate buy-down credit?
- What does the HOA fee cover, when was the last increase, and are there any pending special assessments or reserve-fund shortfalls?
- Any open or pending special assessments — roof, HVAC, plumbing, elevator, façade? What's the per-unit balance and payoff schedule, and is the seller paying it off at close or rolling it to the buyer?
- Why hasn't it sold? Are there any deal-killer items the seller is aware of (foundation, flood, title, zoning, code violations)?
- Is there a deadline driving the sale (1031 exchange, divorce, estate, relocation)? That informs how much negotiation room exists.
- What's the average days-on-market for RENTAL listings here right now (not sales)? A rising rental-DOM trend means longer vacancies and softer asking-rent achievability than the comps imply.
- What's the recent tenant-quality profile in this submarket — average credit score on applications, eviction rate, late-payment / NSF rate, and stable-employment percentage? A property-management company in the area should have these aggregated.
- How much new apartment / multifamily construction is in the pipeline within 1–3 miles? Heavy new supply (>2% of stock underway) typically softens rents 12–24 months out; light construction supports rent growth.
Investment metrics
- 1% rule
- 1.70% ✓
- Cap rate
- 9.17%
- Cash-on-cash
- 10.29%
- DSCR
- 1.46
- GRM
- 4.9
CMA / ARV
No comps found within radius.
Projected returns pro-forma
-3.0% appreciation · 0.0% rent growth · sell at horizon
- IRR
- -5.6%
- Equity multiple
- 0.80×
- Total profit
- $-5,893
- Equity at exit
- $15,641
- IRR
- -2.2%
- Equity multiple
- 0.88×
- Total profit
- $-3,475
- Equity at exit
- $9,070
Cash invested: $29,372 (down + closing). Projections, not guarantees.
Landlord ↔ Tenant lean methodology
- Overall (STATE)
- 87 Strongly Landlord-Friendly
- State Florida
- 87 Strongly Landlord-Friendly · R+3
- County
- — inherits STATE
- City
- — inherits STATE
ZIP-level market 33903
- Rents YoY
- -1.9%
- Active inventory
- 472
- Price-to-rent
- 4.9×
Monthly cashflow live
- Estimated rent
- $1,781 high interval (Pro) →
- Mortgage (P&I)
- −$550
- Tax from tax record
- −$70 /mo · $837/yr
- Insurance
- −$44
- HOA
- −$492
- Vacancy / Maint / Mgmt
- −$374
- Net cashflow
- $252
Break-even live
UW: 25.0% down · 7.5% · 30yr · 1.5% tax · 5.0% vac · 8.0% maint · 8.0% mgmt
Financing live
Cash to close
- Down payment
- $26,225
- Closing costs
- $3,147
- Reserves months
- —
- Total cash needed
- —
Loan-product check · same deal, 3 products live
Conventional
25% down · 7.5% · 30yr
- Down + closing
- —
- Monthly P&I
- —
- Monthly cashflow
- —
- DSCR
- —
- Eligible?
- —
Personal DTI + credit; lowest rate.
DSCR
20% down · 8.5% · 30yr
- Down + closing
- —
- Monthly P&I
- —
- Monthly cashflow
- —
- DSCR
- —
- Eligible?
- —
No personal income docs; deal must DSCR.
Hard money
10% down · 12.0% · 12mo
- Down + closing
- —
- Monthly P&I
- —
- Monthly cashflow
- —
- DSCR
- —
- Eligible?
- —
Short-term bridge; refi at stabilization.
Rent comps 21 comps
| Address | Beds | Baths | Sqft | Rent | $/sqft | DOM | Units | Dist |
|---|---|---|---|---|---|---|---|---|
| 2700 Diplomat Pkwy E Cape Coral, FL | 1.0–3.0 | 1.0–2.0 | 1116 | $2,382 | $2.13 | 3d | 41 | 0.30mi |
| 8791 Littleton Rd North Fort Myers, FL | 2.0 | 2.0 | 1074 | $1,549 | $1.44 | 23d | 1 | 0.38mi |
| 3260 Stockton St North Fort Myers, FL | 3.0 | 1.0–2.0 | 976 | $2,371 | $2.43 | 1d | 27 | 0.46mi |
| 3050 Steeple Cir Cape Coral, FL | 1.0–3.0 | 1.0–2.0 | 1003 | $1,668 | $1.66 | 2d | 27 | 0.64mi |
| 571 Sunrise Ln North Fort Myers, FL | 2.0 | 2.0 | 1004 | $1,400 | $1.39 | 23d | 1 | 0.65mi |
| 28 Nyborg Ave North Fort Myers, FL | 3.0 | 2.0 | 1042 | $1,299 | $1.25 | 14d | 1 | 0.69mi |
| 538 State St North Fort Myers, FL | 3.0 | 1.5 | 1000 | $1,199 | $1.20 | 23d | 1 | 0.73mi |
| 446 San Bernardino St North Fort Myers, FL | 2.0 | 1.0 | 1104 | $1,590 | $1.44 | 10d | 1 | 0.87mi |
| 2627 Riverfield Rd Cape Coral, FL | 3.0 | 2.5 | 1324 | $1,424 | $1.08 | 23d | 1 | 0.88mi |
| 3404 Rainbow Ln North Fort Myers, FL | 2.0 | 2.0 | 1056 | $1,800 | $1.70 | 3d | 1 | 0.99mi |
| 260 Stockton St North Fort Myers, FL | 2.0 | 2.0 | 924 | $1,200 | $1.30 | 3d | 1 | 1.01mi |
| 248 Stockton St North Fort Myers, FL | 3.0 | 2.0 | 924 | $1,300 | $1.41 | 23d | 1 | 1.04mi |
| 247 Stockton St North Fort Myers, FL | 3.0 | 2.0 | 924 | $1,325 | $1.43 | 23d | 1 | 1.04mi |
| 2309 NE 15th Ln Cape Coral, FL | 3.0 | 2.0 | 1250 | $1,595 | $1.28 | 3d | 1 | 1.16mi |
| 2505 Liberty Park Dr Cape Coral, FL | 1.0–2.0 | 1.0–2.0 | 1092 | $2,203 | $2.02 | 2d | 14 | 1.20mi |
| 2500 Ne Pine Island Rd North Fort Myers, FL | 1.0–3.0 | 1.0–2.0 | 962 | $2,018 | $2.10 | 3d | 19 | 1.24mi |
| 2221 NE 15th Ln Cape Coral, FL | 2.0 | 2.0 | 1400 | $1,675 | $1.20 | 16d | 1 | 1.25mi |
| 2116 NE 25th St Cape Coral, FL | 3.0 | 2.0 | 1352 | $1,891 | $1.40 | 3d | 1 | 1.40mi |
| 1310 Thompson St North Fort Myers, FL | 3.0 | 3.0 | 1387 | $2,800 | $2.02 | 23d | 1 | 1.42mi |
| 1125 Winding Pines Cir #207 Cape Coral, FL | 2.0 | 2.0 | 1338 | $1,550 | $1.16 | 23d | 1 | 1.46mi |
| 1288 Waite Dr North Fort Myers, FL | 2.0 | 2.0 | 972 | $2,200 | $2.26 | 23d | 1 | 1.48mi |
HOA detail condo
- Monthly dues
- $492 · $5,904/yr
- Assessments
- None detected in remarks — confirm with the listing agent.
Listing history 32 events
-
2026-06-17days on market $104,900 Active 151 DOM
-
2026-06-16days on market $104,900 Active 150 DOM
-
2026-06-15days on market $104,900 Active 149 DOM
-
2026-06-13days on market $104,900 Active 147 DOM
-
2026-06-10days on market $104,900 Active 144 DOM
-
2026-06-09days on market $104,900 Active 143 DOM
-
2026-06-07days on market $104,900 Active 141 DOM
-
2026-06-02days on market $104,900 Active 136 DOM
-
2026-06-01days on market $104,900 Active 135 DOM
-
2026-06-01days on market $104,900 Active 134 DOM
-
2026-04-16price $104,900
-
2026-01-17$109,900 Active
-
2025-12-31historical
-
2025-07-21price $110,000
-
2025-06-28price $117,000
-
2025-03-27price $119,000
-
2025-03-03price $129,000
-
2025-02-17$139,000 Active
-
2025-01-09historical
-
2024-11-14price $149,900
-
2024-02-21price $162,900
-
2024-01-20$172,000 Active
-
2023-12-02historical
-
2023-08-07price $119,000
-
2023-05-05$126,000 Active
-
2021-05-13soldstatus $100,000 Closed
-
2021-04-26status Pending
-
2021-04-22status Active
-
2021-04-02status Pending
-
2021-03-04$105,000 Active
-
2014-02-14price $62,500
-
2014-02-14soldstatus $58,900
ⓘ Source: listings_history table (triggers on properties + properties_extension) + one-shot
backfill from property_details.listing_events for pre-trigger history.
Tax reassessment forecast FL · Resets to sale price
- Current annual tax
- $837 · $70/mo
- Projected year-2 tax
- $871 · $73/mo
- Expected delta
- +$34/yr (+$3/mo · 4.1%)
ⓘ Screening estimate from a state-policy table — verify with the county assessor before closing.
Climate risk First Street
- Flood 1/10 Low FEMA zone X (unshaded) · 0% chance over 30 yrs
- Wildfire 5/10 Major
- Heat 9/10 Extreme 4 d/yr ≥106°F today · 18 d/yr by 30 yrs out
- Wind 10/10 Extreme 99% chance of damaging wind over 30 yrs
- Air quality 2/10 Low 1 unhealthy d/yr today · 1 by 30 yrs out
Nearby sold comps map
Loading sold comps map…
Walkable amenities ~0.75 mi
Loading nearby amenities…
Taxation est. · year 1
- Rental income
- $21,377
- − Mortgage interest
- −$5,876
- − Property taxes
- −$837
- − Insurance
- −$524
- − Repairs & maintenance
- −$1,710
- − Management
- −$1,710
- − HOA
- −$5,904
- − Depreciation
- −$3,052
- Taxable income
- $1,764
- Est. tax owed @ 24.0%
- −$423
- After-tax cash flow
- $2,598/yr
For passive investors: Depreciation is non-cash, so a rental often shows a tax loss while cash-flowing — sheltering income. Rental losses are passive: they offset passive income freely, and up to $25,000/yr can offset ordinary (W-2) income if you actively participate and your MAGI is under $100k (phasing out to $0 by $150k); unused losses carry forward. On sale, claimed depreciation is recaptured at up to 25%, and gains may owe capital-gains tax (a 1031 exchange can defer both). Figures are a year-1 estimate at your 24.0% rate — not tax advice; consult a CPA.
Schools (NCES district)
- District
- Lee
- NCES district ID
- 1201080
- Math proficiency
- 47% ▼ -11.00%
- Reading proficiency
- 50% ▼ -4.00%
- Median HH income
- $49,518
- Composite
- 41.49/100
- National rank
- #3458
- State rank
- #42 of 73 in FL
Livability — North Fort Myers
- Score
- 74/100
- State rank
- #269
- US rank
- #4409
Category grades
Schools grade is shown separately in the Schools card above.
Census & demographics
- Census place
- North Fort Myers, FL
- County
- Lee County · 788,662 people
- City population
- 57,035
- Metro
- Cape Coral-Fort Myers, FL
- Population (ZIP)
- 23,655
- Household income
- $56,993
- Rent vs Own
- Severe rent burden
- 468.0
Population outlook (Lee County) Hauer SSP2
- Today (2025)
- 871,946 people
- By 2030
- 955,468 · +9.6%
- By 2040
- 1,113,587 · +27.7%
- By 2050
- 1,256,891 · +44.1%
- By 2075
- 1,560,270 · +78.9%
- By 2100
- 1,726,848 · +98.0%
Race, ethnicity, and origin ACS 2023
- Neighborhood character
- Predominantly White (81%)
- Race & ethnicity
- White 81% Hispanic / Latino 14% Two or more races 8% Black 2%
- Hispanic origin (detail)
- Mexican 3% Puerto Rican 3% Cuban 3%
- Common ancestry
- Lithuanian 4% Romanian 4% Italian 3%
- Foreign-born
- 11% · Canada
- Languages at home
- 88% English-only · Spanish 9% Other Indo-European 1%
Political lean MEDSL · Lee
- 2024 margin
- Strong R (+28.4) · D 35.5% · R 63.9%
- 2008→2024 swing
- -18.0pp toward R · 2008: -10.4pp · 2024: -28.4pp
- All cycles
- 2024: R+28.4 2020: R+19.2 2016: R+20.4 2012: R+16.6 2008: R+10.4
Not yet ingested
- Civics
- —
Market trends
- HPI YoY
- ▼ -172.26%
- Current HPI
- 256.773
- Rent YoY
- ▼ -1.94%
- Metro
- Cape Coral-Fort Myers, FL
- State GDP YoY
- ▲ 3.28%
- F500 in state
- 36
Industry mix (Fortune 500 HQ in FL)
| Industry | F500 HQs | Revenue |
|---|---|---|
| Industrial Technology | 2 | $29B |
|
||
| Insurance | 2 | $17B |
|
||
| Retail | 1 | $60B |
|
||
| Technology Distribution | 1 | $58B |
|
||
| Homebuilding | 1 | $35B |
|
||
| Technology Manufacturing | 1 | $35B |
|
||
Price history
+67.8% since first listed22 events — show timeline
- 2026-04-16 Price Changed $104,900 FORTMLS
- 2026-01-17 Listed $109,900 FORTMLS
- 2025-12-31 Listing Removed — FORTMLS
- 2025-07-21 Price Changed $110,000 FORTMLS
- 2025-06-28 Price Changed $117,000 FORTMLS
- 2025-03-27 Price Changed $119,000 FORTMLS
- 2025-03-03 Price Changed $129,000 FORTMLS
- 2025-02-17 Listed $139,000 FORTMLS
- 2025-01-09 Listing Removed — FORTMLS
- 2024-11-14 Price Changed $149,900 FORTMLS
- 2024-02-21 Price Changed $162,900 FORTMLS
- 2024-01-20 Listed $172,000 FORTMLS
- 2023-12-02 Listing Removed — FORTMLS
- 2023-08-07 Price Changed $119,000 FORTMLS
- 2023-05-05 Listed $126,000 FORTMLS
- 2021-05-13 Sold (MLS) $100,000 FORTMLS
- 2021-04-26 Pending — FORTMLS
- 2021-04-22 Relisted — FORTMLS
- 2021-04-02 Pending — FORTMLS
- 2021-03-04 Listed $105,000 FORTMLS
- 2014-02-14 Sold (MLS) $58,900 FORTMLS
- 2014-02-14 Price Changed $62,500 FORTMLS
Property tax history
-1.0%/yrLatest (2025): $837 · +4.4% YoY. Source: county tax records.
Cash-flow waterfall
monthlySold comps — $/sqft
last 12 mo · ≤1 miLoading sold comps…