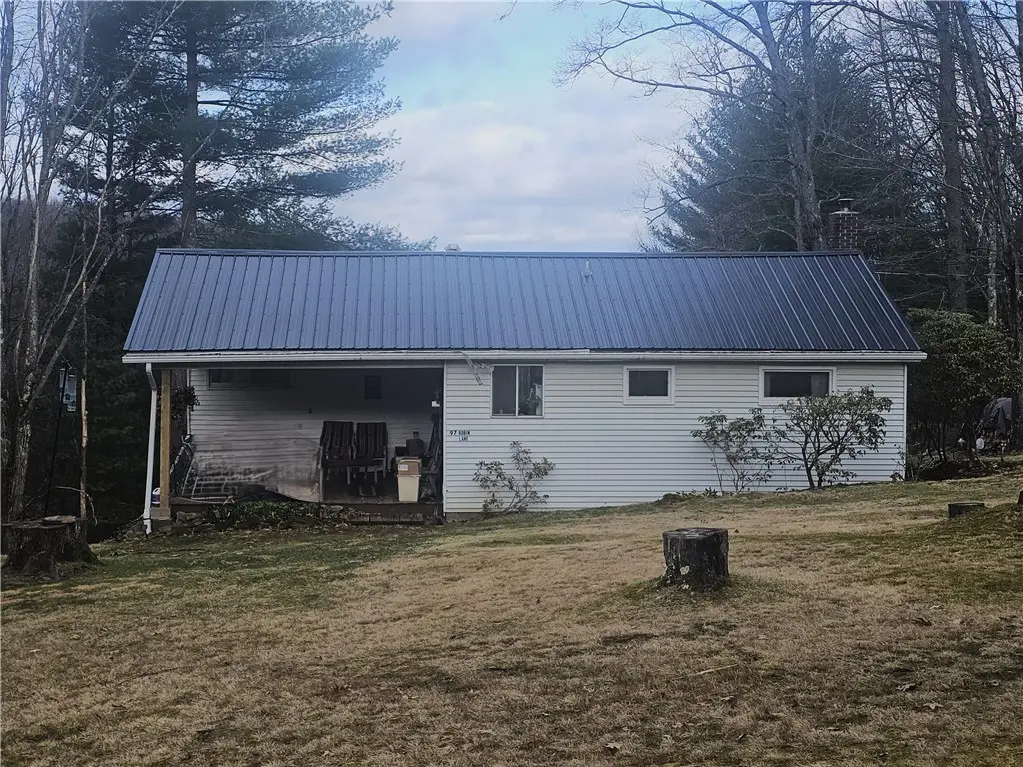
97 Robin Ln · Millcreek, PA
Flood risk 1/10 · Minimal
- FEMA flood zone
- X (unshaded)
- Chance of flooding over 30 yrs
- 0.0%
- Est. flood insurance / yr
- $507 – $1,088
Fire risk 3/10 · Minor
- Est. fire insurance / yr
- $511 – $949
Heat risk 2/10 · Minimal
- Hot days now (above 91°F)
- 7 days/yr
- Hot days in 30 yrs
- 16 days/yr
Wind risk 2/10 · Minimal
- Chance of severe wind over 30 yrs
- —
Air-quality risk 2/10 · Minimal
- Unhealthy air days now
- 1 days/yr
- Unhealthy air days in 30 yrs
- 2 days/yr
Risk factors via First Street. Map © Google.
Why this score? — see what drove the D grade
The composite is a weighted blend of 9 inputs, each scored 0–100. Each bar is that input's sub-score; the figure is the points it added to the 100-point composite (weight × sub-score).
- ARV discount +15.0/15.0
- Cash flow +7.1/30.0
- Appreciation +5.0/10.0
- Schools +4.7/10.0
- Rent growth +2.5/5.0
- Livability +2.5/5.0
- Condition / age +2.5/5.0
- DSCR +1.3/10.0
- 1% rule +0.7/10.0
$150,000
🖨 Deal sheet (PDF) 📄 Offer letter ✓ Due diligence
Listing remarks
Charming country retreat offering a peaceful setting and plenty of potential! This well-maintained 2-bedroom, 1-bath home features a newer metal roof and has been cared for with pride. Whether you're looking for a weekend getaway, hunting camp, or a full-time residence, this property fits the bill. The two-stall garage provides ample storage for vehicles, tools, or recreational equipment. . Ready for its next owner—come enjoy the simplicity and serenity of country living!
Key facts
- Two stall garage
- Newer metal roof
- Extra .5 acre lot
Tags
Property features AI
Exterior
- Parking: Detached garage; Off-street parking
- Utilities: Septic tank; Cistern water source
- Home design: Single-story home; Resale property; Metal roof
- Construction: Metal roof
- Exterior features: 1-acre lot
Interior
- Kitchen: Kitchen on main level
- Bedrooms: Bedroom on main level
- Flooring: Laminate flooring; Vinyl flooring
- Bathrooms: 1 full bathroom; 1 half bathroom
- Heating & cooling: Oil heating
- Interior features: Walk-out basement; Wood-burning fireplace
Neighborhood map
What this means for you Summary
Snapshot
- This is a 2-bed/1.5-bath single-family listed at $150k.
Deal economics
- At list price, monthly cash flow is $-211 ($-3k/yr) — negative.
- To cash-flow at today's rent, offer at most $113k (24.8% below list).
- To meet the 1% rule (rent ≥ 1% of price), the offer needs to be $85k (43.1% below list).
- Recommended offer: $85k (43.1% below list) — sets the bar for 1% rule.
Location & tenants
- Location reads: area grade D — affects rentability + tenant quality, not the cash-flow math above.
- Clarion-Limestone Area SD (rural): math 48% / reading 65% proficiency, ranked #116 of 539 in PA (top 22%) — acceptable for families but not a draw, mixed tenant base, ~2y average lease.
- Zoned schools: Clarion-Limestone El Sch (math 47% / reading 69%, grade C+, #430 of 1,518 statewide, top 29%, 425 students, 53% FRL); Clarion-Limestone Area Jshs (math 52% / reading 52%, grade D+, #115 of 437 statewide, top 27%, 353 students, 39% FRL).
- Market conditions: 8 active listings in the ZIP; 25 units permitted in Clarion County in 2024 (0 in 5+ unit buildings).
Forward outlook
- In year one you build about $6k of equity ($1k loan paydown + $4k appreciation (3.0% local appreciation)).
- Clarion County population projected at -18% by 2050 — secular population decline; favor cash flow + early exit over multi-decade hold.
- By year 7, paydown + projected appreciation supports a ~$35k cash-out refi (75% LTV) — recoverable capital for the next deal without selling this one.
Negotiation context
- It's been on market 60 days — a 3% lower offer ($146k) is reasonable based on typical stale-listing flexibility.
Risks & watch-outs
- Watch-outs: built in 1956 — expect roof / HVAC / electrical / plumbing capex.
Questions for the listing agent
- What do current leases actually rent for vs. the listed asking? Can we see a recent rent roll and the last 12 months of T-12 income?
- It's been on market 60 days. Have you received any prior offers? Is the seller open to a 43% concession, seller financing, or rate buy-down credit?
- Built in 1956 — when were the roof, HVAC, electrical panel, plumbing, and water heater last replaced?
- Is there a deadline driving the sale (1031 exchange, divorce, estate, relocation)? That informs how much negotiation room exists.
- The area grade is low — what's the realistic commute time and amenity access for the typical tenant pool here? Any planned neighborhood developments (good or bad) we should know about?
- What's the average days-on-market for RENTAL listings here right now (not sales)? A rising rental-DOM trend means longer vacancies and softer asking-rent achievability than the comps imply.
- What's the recent tenant-quality profile in this submarket — average credit score on applications, eviction rate, late-payment / NSF rate, and stable-employment percentage? A property-management company in the area should have these aggregated.
- How much new for-sale + rental construction is in the pipeline within 1–3 miles? Heavy new supply typically softens prices + rents 12–24 months out; constrained supply supports both.
Investment metrics
- 1% rule
- 0.57% ✗
- Cap rate
- 4.61%
- Cash-on-cash
- -6.02%
- DSCR
- 0.73
- GRM
- 14.6
CMA / ARV
- ARV (median comp)
- $224,555
- List price
- $150,000
- Delta
- -33.20%
- Verdict
- UNDERPRICED
- Comps
- 3 within 1.0 mi
Projected returns pro-forma
3.0% appreciation · 3.0% rent growth · sell at horizon
- IRR
- 1.9%
- Equity multiple
- 1.11×
- Total profit
- $4,559
- Equity at exit
- $67,446
- IRR
- 5.4%
- Equity multiple
- 1.83×
- Total profit
- $34,967
- Equity at exit
- $103,943
Cash invested: $42,000 (down + closing). Projections, not guarantees.
Landlord ↔ Tenant lean methodology
- Overall (STATE)
- 62 Landlord-Friendly
- State Pennsylvania
- 62 Landlord-Friendly · EVEN
- County
- — inherits STATE
- City
- — inherits STATE
ZIP-level market 16258
- Active inventory
- 8
- Price-to-rent
- 14.6×
Monthly cashflow live
- Estimated rent
- $854 medium interval (Pro) →
- Mortgage (P&I)
- −$787
- Tax from tax record
- −$36 /mo · $437/yr
- Insurance
- −$62
- HOA
- −$0
- Vacancy / Maint / Mgmt
- −$179
- Net cashflow
- $-211
Break-even live
Sensitivity live
| Price | -10% $-126 | -5% $-168 | +0% $-211 | +5% $-253 | +10% $-296 |
|---|---|---|---|---|---|
| Rent | -10% $-278 | -5% $-245 | +0% $-211 | +5% $-177 | +10% $-143 |
| Rate | -1.0pp $-135 | -0.5pp $-173 | base $-211 | +0.5pp $-250 | +1.0pp $-289 |
UW: 25.0% down · 7.5% · 30yr · 1.5% tax · 5.0% vac · 8.0% maint · 8.0% mgmt
Financing live
Cash to close
- Down payment
- $37,500
- Closing costs
- $4,500
- Reserves months
- —
- Total cash needed
- —
Loan-product check · same deal, 3 products live
Conventional
25% down · 7.5% · 30yr
- Down + closing
- —
- Monthly P&I
- —
- Monthly cashflow
- —
- DSCR
- —
- Eligible?
- —
Personal DTI + credit; lowest rate.
DSCR
20% down · 8.5% · 30yr
- Down + closing
- —
- Monthly P&I
- —
- Monthly cashflow
- —
- DSCR
- —
- Eligible?
- —
No personal income docs; deal must DSCR.
Hard money
10% down · 12.0% · 12mo
- Down + closing
- —
- Monthly P&I
- —
- Monthly cashflow
- —
- DSCR
- —
- Eligible?
- —
Short-term bridge; refi at stabilization.
Listing history 17 events
-
2026-06-21days on market $150,000 Active 60 DOM
-
2026-06-21days on market $150,000 Active 59 DOM
-
2026-06-18days on market $150,000 Active 57 DOM
-
2026-06-17days on market $150,000 Active 56 DOM
-
2026-06-16days on market $150,000 Active 55 DOM
-
2026-06-15days on market $150,000 Active 54 DOM
-
2026-06-13days on market $150,000 Active 52 DOM
-
2026-06-12days on market $150,000 Active 51 DOM
-
2026-06-09days on market $150,000 Active 48 DOM
-
2026-06-08days on market $150,000 Active 47 DOM
-
2026-06-08days on market $150,000 Active 46 DOM
-
2026-06-05days on market $150,000 Active 44 DOM
-
2026-06-04days on market $150,000 Active 42 DOM
-
2026-06-02days on market $150,000 Active 41 DOM
-
2026-06-01days on market $150,000 Active 40 DOM
-
2026-05-31days on market $150,000 Active 39 DOM
-
2026-04-22$150,000 Active 482-char remark
ⓘ Source: listings_history table (triggers on properties + properties_extension) + one-shot
backfill from property_details.listing_events for pre-trigger history.
Tax reassessment forecast PA · Partial reset (capped growth)
- Current annual tax
- $437 · $36/mo
- Projected year-2 tax
- $1,403 · $117/mo
- Expected delta
- +$967/yr (+$81/mo · 221.4%)
ⓘ Screening estimate from a state-policy table — verify with the county assessor before closing.
Climate risk First Street
- Flood 1/10 Low FEMA zone X (unshaded) · 0% chance over 30 yrs
- Wildfire 3/10 Moderate
- Heat 2/10 Low 7 d/yr ≥91°F today · 16 d/yr by 30 yrs out
- Wind 2/10 Low
- Air quality 2/10 Low 1 unhealthy d/yr today · 2 by 30 yrs out
Nearby sold comps map
Loading sold comps map…
Walkable amenities ~0.75 mi
Loading nearby amenities…
Taxation est. · year 1
- Rental income
- $10,248
- − Mortgage interest
- −$8,402
- − Property taxes
- −$437
- − Insurance
- −$750
- − Repairs & maintenance
- −$820
- − Management
- −$820
- − Depreciation
- −$4,364
- Taxable loss
- −$5,345
- Est. tax savings @ 24.0%
- +$1,283
- After-tax cash flow
- $-1,248/yr
For passive investors: Depreciation is non-cash, so a rental often shows a tax loss while cash-flowing — sheltering income. Rental losses are passive: they offset passive income freely, and up to $25,000/yr can offset ordinary (W-2) income if you actively participate and your MAGI is under $100k (phasing out to $0 by $150k); unused losses carry forward. On sale, claimed depreciation is recaptured at up to 25%, and gains may owe capital-gains tax (a 1031 exchange can defer both). Figures are a year-1 estimate at your 24.0% rate — not tax advice; consult a CPA.
Schools (NCES district)
- District
- Clarion-Limestone Area SD
- NCES district ID
- 4206090
- Math proficiency
- 48% ▼ -12.00%
- Reading proficiency
- 65% ▼ -12.00%
- Median HH income
- $40,876
- Composite
- 47.24/100
- National rank
- #2313
- State rank
- #116 of 539 in PA
Livability — Millcreek
No livability data for this city. (Only ~50 U.S. cities are tracked.)
Census & demographics
- Population (ZIP)
- 1,870
Population outlook (Clarion County) Hauer SSP2
- Today (2025)
- 37,796 people
- By 2030
- 36,830 · -2.6%
- By 2040
- 34,113 · -9.7%
- By 2050
- 31,092 · -17.7%
- By 2075
- 24,200 · -36.0%
- By 2100
- 18,737 · -50.4%
Race, ethnicity, and origin ACS 2023
- Neighborhood character
- Predominantly White (95%)
- Race & ethnicity
- White 95% Two or more races 4%
- Common ancestry
- Slovak 8% Danish 6% Italian 4%
- Languages at home
- 98% English-only · German/W. Germanic 2%
Political lean MEDSL · Clarion
- 2024 margin
- Solid R (+53.1) · D 23.1% · R 76.2%
- 2008→2024 swing
- -30.7pp toward R · 2008: -22.4pp · 2024: -53.1pp
- All cycles
- 2024: R+53.1 2020: R+50.8 2016: R+47.4 2012: R+36.1 2008: R+22.4
Not yet ingested
- Civics
- —
Market trends
- HPI YoY
- —
- Current HPI
- —
- Rent YoY
- —
- Metro
- —
- State GDP YoY
- ▲ 1.68%
- F500 in state
- 34
Industry mix (Fortune 500 HQ in PA)
| Industry | F500 HQs | Revenue |
|---|---|---|
| Healthcare | 2 | $309B |
|
||
| Insurance | 2 | $27B |
|
||
| Telecommunications / Media | 1 | $124B |
|
||
| Industrial Distribution | 1 | $22B |
|
||
| Financial Services | 1 | $20B |
|
||
| Chemicals / Materials | 1 | $18B |
|
||
Price history
1 event — show timeline
- 2026-04-22 Listed $150,000 West Penn MLS
Property tax history
+20.4%/yrLatest (2026): $437 · +738.9% YoY. Source: county tax records.
Cash-flow waterfall
monthlySold comps — $/sqft
last 12 mo · ≤1 miLoading sold comps…