 Multi-family
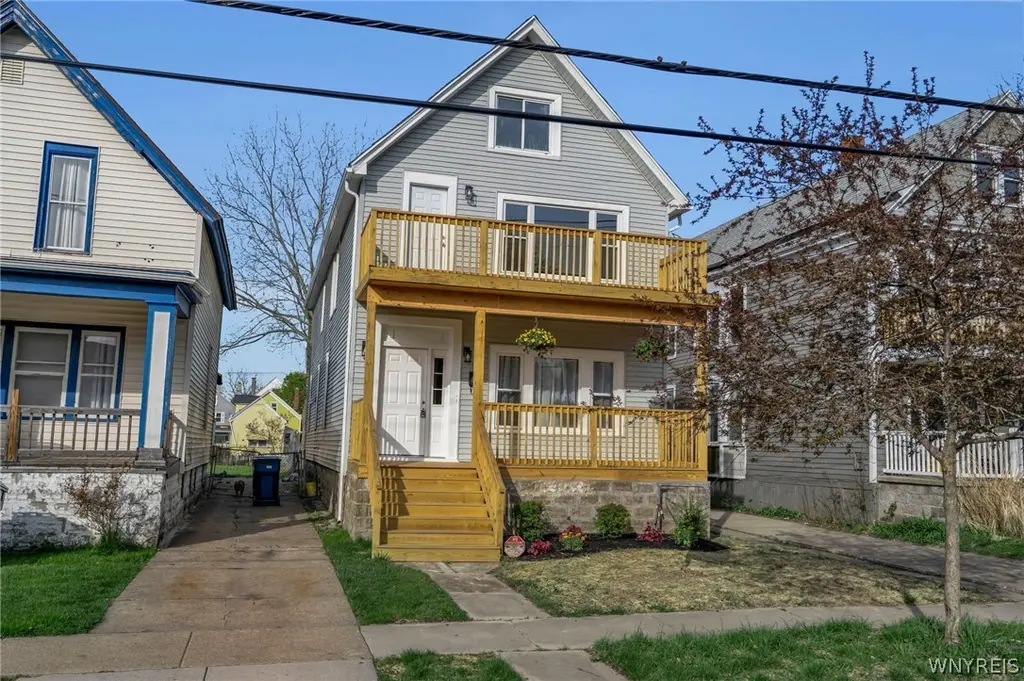
501 West Ave · Buffalo, NY
Flood risk 1/10 · Minimal
- FEMA flood zone
- X (unshaded)
- Chance of flooding over 30 yrs
- 0.0%
- Est. flood insurance / yr
- $473 – $860
Fire risk 1/10 · Minimal
- Est. fire insurance / yr
- $691 – $1,283
Heat risk 3/10 · Minor
- Hot days now (above 91°F)
- 7 days/yr
- Hot days in 30 yrs
- 15 days/yr
Wind risk 1/10 · Minimal
- Chance of severe wind over 30 yrs
- —
Air-quality risk 4/10 · Minor
- Unhealthy air days now
- 4 days/yr
- Unhealthy air days in 30 yrs
- 9 days/yr
Risk factors via First Street. Map © Google.
Why this score? — see what drove the B- grade
The composite is a weighted blend of 9 inputs, each scored 0–100. Each bar is that input's sub-score; the figure is the points it added to the 100-point composite (weight × sub-score).
- Cash flow +25.3/30.0
- ARV discount +9.2/15.0
- Appreciation +8.8/10.0
- DSCR +8.3/10.0
- 1% rule +5.3/10.0
- Livability +3.9/5.0
- Schools +3.3/10.0
- Condition / age +2.5/5.0
- Rent growth +2.4/5.0
$350,000
🖨 Deal sheet 📄 Offer letter ✓ Due diligence
Multi-family units
County records classify this as Multi-Family (2-4 Unit). Listing-text estimate: 1 unit. estimate disagrees with records
Listing remarks MLS
Bank owned, cash sale only. Solid building, but repairs needed throughout. Plumbing/freezing damage and vandalized. Buyer to determine condition of all mechanics and systems, as well as determining existence of and rectifying any and all code violations. Sold as-is and buyer pays search, survey, and transfer tax. Close to D'Youville and Connecticut Street, could be a good house but will need work.
Key facts
- 2 parking spots
- Built 1920
- Listed 23 days
Neighborhood map
What this means for you Summary
Snapshot
- This is a 6-bed/2.0-bath multifamily listed at $350k.
Deal economics
- At list price, monthly cash flow is $793 ($10k/yr) — positive.
- The deal already cash-flows at list — no discount required.
- Meets the 1% rule at list price ($4k rent vs $350k).
- Recommended offer: $345k (1.5% below list) — sets the bar for market timing.
Location & tenants
- Location reads 77/100 on livability (#195 in NY, #3,011 nationally) — a middle-class / working-renter tenant base. Strengths: commute A+, housing A+, health & safety A+; Watch: crime F, employment D-.
- Buffalo City School District (urban): math 41% / reading 40% proficiency, ranked #535 of 590 in NY (top 91%) — families likely to look elsewhere, expect single-tenant / working-renter base with shorter leases; 75% free/reduced lunch — lower-income household profile, screen leases tightly.
- Market conditions: Rents soft (-0.5%/yr); 137 active listings in the ZIP; 1,244 units permitted in Erie County in 2024 (563 in 5+ unit buildings).
- At $3,599/mo this rent would consume 80% of the median local household income ($54k/yr) (locally 1501% of renters already pay >50% of income on rent) — very limited rent-growth headroom before tenants either downsize or default.
Forward outlook
- In year one you build about $29k of equity ($2k loan paydown + $26k appreciation (7.5% local appreciation)).
- At projected returns (7.5% appreciation + 0.0% rent growth), your $98k cash investment doubles in ~3 years — after that, you're playing with house money.
- By year 2, paydown + projected appreciation supports a ~$46k cash-out refi (75% LTV) — recoverable capital for the next deal without selling this one.
Negotiation context
- It's been on market 23 days — a 2% lower offer ($345k) is reasonable based on typical stale-listing flexibility.
- 3 sale attempts since 16y ago; this cycle's ask is 20488% above the opening price — seller raised mid-cycle; expect resistance to lowballs.
- Current owner paid $100k; list at $350k implies a 250% gain — meaningful room to come down on a strong offer.
Risks & watch-outs
- Watch-outs: built in 1920 — expect roof / HVAC / electrical / plumbing capex.
Questions for the listing agent
- Built in 1920 — when were the roof, HVAC, electrical panel, plumbing, and water heater last replaced?
- Is there a deadline driving the sale (1031 exchange, divorce, estate, relocation)? That informs how much negotiation room exists.
- Crime grade is F in this area — have there been break-ins, vandalism, or insurance claims at this property in the last 3 years? What carrier currently insures it and at what premium?
- What's the average days-on-market for RENTAL listings here right now (not sales)? A rising rental-DOM trend means longer vacancies and softer asking-rent achievability than the comps imply.
- What's the recent tenant-quality profile in this submarket — average credit score on applications, eviction rate, late-payment / NSF rate, and stable-employment percentage? A property-management company in the area should have these aggregated.
- How much new apartment / multifamily construction is in the pipeline within 1–3 miles? Heavy new supply (>2% of stock underway) typically softens rents 12–24 months out; light construction supports rent growth.
Investment metrics
- 1% rule
- 1.03% ✓
- Cap rate
- 9.01%
- Cash-on-cash
- 9.71%
- DSCR
- 1.43
- GRM
- 8.1
CMA / ARV
- ARV (median comp)
- $363,416
- List price
- $350,000
- Delta
- -3.69%
- Verdict
- FAIR
- Comps
- 20 within 1.0 mi
Show comp detail 12 sales within ~0.75 mi
| Address | Dist | Beds/Ba | Sqft | Sold | Price | $/sf | Match |
|---|---|---|---|---|---|---|---|
| 26 York St | 0.18mi | 6/2.0 | 2,519 (-1%) | 1mo | $199,900 | $79 | 88 |
| 215 Normal Ave | 0.14mi | 5/2.0 (-1) | 2,626 (+3%) | 7mo | $294,000 | $112 | 78 |
| 207 Rhode Island St | 0.19mi | 5/2.0 (-1) | 2,436 (-4%) | 2mo | $295,500 | $121 | 77 |
| 288 14th St | 0.21mi | 5/2.0 (-1) | 2,616 (+2%) | 6mo | $260,000 | $99 | 76 |
| 324 West Ave | 0.35mi | 6/2.0 | 2,652 (+4%) | 5mo | $312,500 | $118 | 73 |
| 383 Summer St | 0.39mi | 5/2.0 (-1) | 2,468 (-3%) | 6mo | $492,000 | $199 | 66 |
| 715 Prospect Ave | 0.21mi | 6/2.0 | 2,867 (+12%) | 6mo | $232,500 | $81 | 64 |
| 67 Barton St | 0.66mi | 6/2.0 | 2,420 (-5%) | 0mo | $170,000 | $70 | 60 |
| 395 Hampshire St | 0.67mi | 5/2.0 (-1) | 2,438 (-4%) | 3mo | $165,500 | $68 | 54 |
| 298 Massachusetts Ave | 0.42mi | 5/2.0 (-1) | 2,221 (-13%) | 1mo | $220,000 | $99 | 53 |
| 250 West Ave | 0.50mi | 6/2.0 | 2,230 (-13%) | 4mo | $375,000 | $168 | 52 |
| 214 W Ferry St Unit N | 0.71mi | 5/2.0 (-1) | 2,296 (-10%) | 7mo | $185,000 | $81 | 39 |
Match score weights: distance 35% · size 25% · config 20% · recency 20%. Top-matched comps best support the ARV.
Projected returns pro-forma
7.51% appreciation · 0.0% rent growth · sell at horizon
- IRR
- 25.2%
- Equity multiple
- 2.77×
- Total profit
- $173,117
- Equity at exit
- $254,371
- IRR
- 22.0%
- Equity multiple
- 5.54×
- Total profit
- $445,015
- Equity at exit
- $494,303
Cash invested: $98,000 (down + closing). Projections, not guarantees.
Landlord ↔ Tenant lean methodology
- Overall (STATE)
- 15 Strongly Tenant-Friendly
- State New York
- 15 Strongly Tenant-Friendly · D+10
- County
- — inherits STATE
- City
- — inherits STATE
ZIP-level market 14213
- Home prices YoY
- 1.7%
- Rents YoY
- -0.5%
- Active inventory
- 137
- Price-to-rent
- 16.2×
Monthly cashflow live
- Estimated rent
- $3,599 high interval (Pro) →
- Mortgage (P&I)
- −$1,835
- Tax from tax record
- −$69 /mo · $829/yr
- Insurance
- −$146
- HOA
- −$0
- Vacancy / Maint / Mgmt
- −$756
- Net cashflow
- $793
Break-even live
2-unit breakdown (identical units grouped — click to expand)
| Units | Beds | Baths | Est. rent |
|---|---|---|---|
| 2× units | 3 | 1 | $3,598 |
| #1 | 3 | 1 | $1,799 |
| #2 | 3 | 1 | $1,799 |
| Total (2 units) | $3,599 | ||
UW: 25.0% down · 7.5% · 30yr · 1.5% tax · 5.0% vac · 8.0% maint · 8.0% mgmt
Financing live
Cash to close
- Down payment
- $87,500
- Closing costs
- $10,500
- Reserves months
- —
- Total cash needed
- —
Loan-product check · same deal, 3 products live
Conventional
25% down · 7.5% · 30yr
- Down + closing
- —
- Monthly P&I
- —
- Monthly cashflow
- —
- DSCR
- —
- Eligible?
- —
Personal DTI + credit; lowest rate.
DSCR
20% down · 8.5% · 30yr
- Down + closing
- —
- Monthly P&I
- —
- Monthly cashflow
- —
- DSCR
- —
- Eligible?
- —
No personal income docs; deal must DSCR.
Hard money
10% down · 12.0% · 12mo
- Down + closing
- —
- Monthly P&I
- —
- Monthly cashflow
- —
- DSCR
- —
- Eligible?
- —
Short-term bridge; refi at stabilization.
Listing history 6 events
-
2026-05-18price $350,000 1703-char remark
-
2026-05-16$1,850
-
2026-05-04$400,000 Active 1703-char remark
-
2025-10-14soldstatus $100,000
-
2010-04-22soldstatus $11,000 400-char remark
Show marketing remark (400 chars)
Bank owned, cash sale only. Solid building, but repairs needed throughout. Plumbing/freezing damage and vandalized. Buyer to determine condition of all mechanics and systems, as well as determining existence of and rectifying any and all code violations. Sold as-is and buyer pays search, survey, and transfer tax. Close to D'Youville and Connecticut Street, could be a good house but will need work.
-
2010-03-18$9,900 400-char remark
Show marketing remark (400 chars)
Bank owned, cash sale only. Solid building, but repairs needed throughout. Plumbing/freezing damage and vandalized. Buyer to determine condition of all mechanics and systems, as well as determining existence of and rectifying any and all code violations. Sold as-is and buyer pays search, survey, and transfer tax. Close to D'Youville and Connecticut Street, could be a good house but will need work.
ⓘ Source: listings_history table (triggers on properties + properties_extension) + one-shot
backfill from property_details.listing_events for pre-trigger history.
Tax reassessment forecast NY · Partial reset (capped growth)
- Current annual tax
- $829 · $69/mo
- Projected year-2 tax
- $3,372 · $281/mo
- Expected delta
- +$2,543/yr (+$212/mo · 306.8%)
ⓘ Screening estimate from a state-policy table — verify with the county assessor before closing.
Climate risk First Street
- Flood 1/10 Low FEMA zone X (unshaded) · 0% chance over 30 yrs
- Wildfire 1/10 Low
- Heat 3/10 Moderate 7 d/yr ≥91°F today · 15 d/yr by 30 yrs out
- Wind 1/10 Low
- Air quality 4/10 Moderate 4 unhealthy d/yr today · 9 by 30 yrs out
Nearby sold comps map
Loading sold comps map…
Walkable amenities ~0.75 mi
Loading nearby amenities…
Taxation est. · year 1
- Rental income
- $43,188
- − Mortgage interest
- −$19,605
- − Property taxes
- −$829
- − Insurance
- −$1,750
- − Repairs & maintenance
- −$3,455
- − Management
- −$3,455
- − Depreciation
- −$10,182
- Taxable income
- $3,912
- Est. tax owed @ 24.0%
- −$939
- After-tax cash flow
- $8,576/yr
For passive investors: Depreciation is non-cash, so a rental often shows a tax loss while cash-flowing — sheltering income. Rental losses are passive: they offset passive income freely, and up to $25,000/yr can offset ordinary (W-2) income if you actively participate and your MAGI is under $100k (phasing out to $0 by $150k); unused losses carry forward. On sale, claimed depreciation is recaptured at up to 25%, and gains may owe capital-gains tax (a 1031 exchange can defer both). Figures are a year-1 estimate at your 24.0% rate — not tax advice; consult a CPA.
Schools (NCES district)
- District
- Buffalo City School District
- NCES district ID
- 3605850
- Math proficiency
- 41% ▲ 11.00%
- Reading proficiency
- 40% ▲ 7.00%
- Median HH income
- $31,665
- Composite
- 33.17/100
- National rank
- #5544
- State rank
- #535 of 590 in NY
Livability — Buffalo
- Score
- 77/100
- State rank
- #195
- US rank
- #3011
Category grades
Schools grade is shown separately in the Schools card above.
Census & demographics
- Census place
- Buffalo, NY
- County
- Erie County · 714,559 people
- City population
- 440,021
- Metro
- Buffalo-Cheektowaga, NY
- Population (ZIP)
- 24,107
- Household income
- $53,870
- Rent vs Own
- Severe rent burden
- 1501.0
Population outlook (Erie County) Hauer SSP2
- Today (2025)
- 933,037 people
- By 2030
- 935,181 · +0.2%
- By 2040
- 928,531 · -0.5%
- By 2050
- 905,725 · -2.9%
- By 2075
- 834,037 · -10.6%
- By 2100
- 708,033 · -24.1%
Race, ethnicity, and origin ACS 2023
- Neighborhood character
- Highly diverse neighborhood (Simpson 0.70)
- Race & ethnicity
- White 46% Hispanic / Latino 20% Black 18% Asian 12% Two or more races 10%
- Hispanic origin (detail)
- Mexican 1% Puerto Rican 16% Dominican 1%
- Common ancestry
- Romanian 6% Slovak 3% Lithuanian 3%
- Foreign-born
- 16% · Philippines, Canada, India
- Languages at home
- 68% English-only · Spanish 12% Other Asian/Pacific 7% Arabic 3%
Political lean MEDSL · Erie
- 2024 margin
- Lean D (+9.7) · D 54.8% · R 45.2%
- 2008→2024 swing
- -7.9pp toward R · 2008: 17.5pp · 2024: 9.7pp
- All cycles
- 2024: D+9.7 2020: D+14.7 2016: D+4.8 2012: D+15.6 2008: D+17.5
Not yet ingested
- Civics
- —
Market trends
- HPI YoY
- ▲ 7.51%
- Current HPI
- 448.4879
- Rent YoY
- ▼ -0.49%
- Metro
- Buffalo-Cheektowaga, NY
- State GDP YoY
- ▲ 2.60%
- F500 in state
- 92
Industry mix (Fortune 500 HQ in NY)
| Industry | F500 HQs | Revenue |
|---|---|---|
| Financial Services | 10 | $950B |
|
||
| Consumer Goods | 9 | $162B |
|
||
| Insurance | 4 | $225B |
|
||
| Telecommunications | 2 | $144B |
|
||
| Pharmaceuticals | 2 | $112B |
|
||
| Media / Entertainment | 2 | $69B |
|
||
Price history
-82.8% since first listed7 events — show timeline
- 2026-06-05 Listed for Rent $1,700 WNYREIS
- 2026-06-05 Rental Removed $1,850 WNYREIS
- 2026-05-18 Price Changed $350,000 WNYREIS
- 2026-05-16 Listed for Rent $1,850 WNYREIS
- 2025-10-14 Sold (Public Records) $100,000 Public Records
- 2010-04-22 Sold (MLS) $11,000 WNYREIS
- 2010-03-18 Listed $9,900 WNYREIS
Property tax history
+11.7%/yrLatest (2025): $829 · +8.0% YoY. Source: county tax records.
Cash-flow waterfall
monthlySold comps — $/sqft
last 12 mo · ≤1 miLoading sold comps…