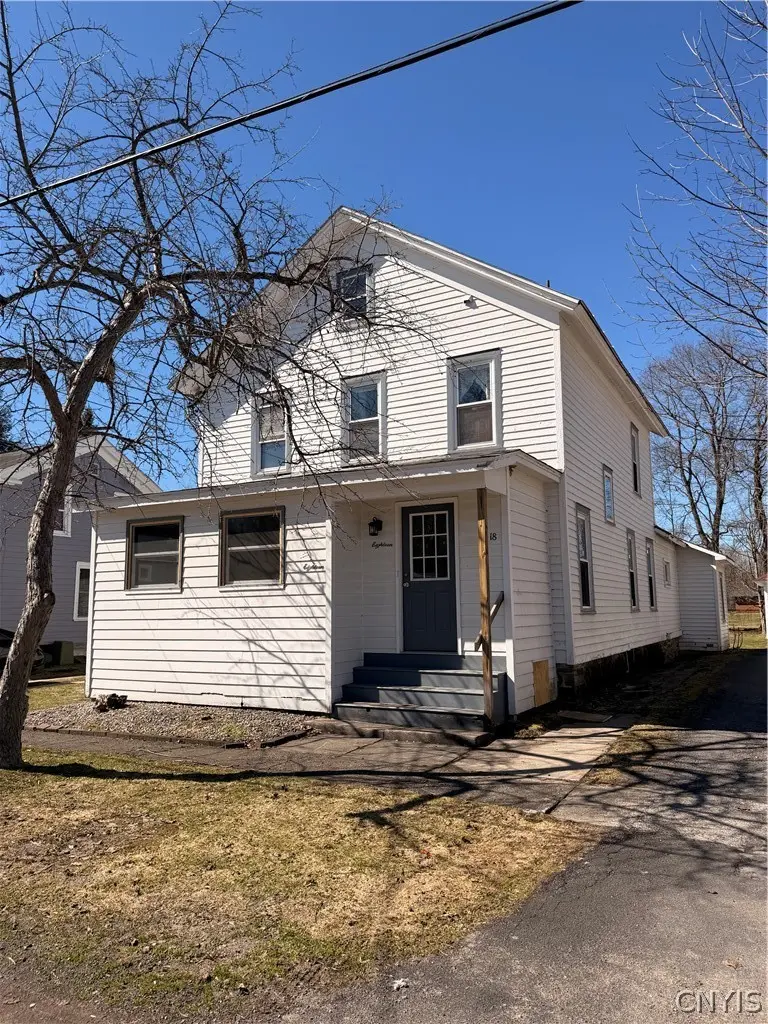
18 White St · Clark Mills, NY
Flood risk 1/10 · Minimal
- FEMA flood zone
- X (unshaded)
- Chance of flooding over 30 yrs
- 0.0%
- Est. flood insurance / yr
- $473 – $860
Fire risk 1/10 · Minimal
- Est. fire insurance / yr
- $691 – $1,283
Heat risk 3/10 · Minor
- Hot days now (above 95°F)
- 7 days/yr
- Hot days in 30 yrs
- 17 days/yr
Wind risk 1/10 · Minimal
- Chance of severe wind over 30 yrs
- 0.0%
Air-quality risk 2/10 · Minimal
- Unhealthy air days now
- 0 days/yr
- Unhealthy air days in 30 yrs
- 2 days/yr
Risk factors via First Street. Map © Google.
Why this score? — see what drove the A- grade
The composite is a weighted blend of 9 inputs, each scored 0–100. Each bar is that input's sub-score; the figure is the points it added to the 100-point composite (weight × sub-score).
- Cash flow +30.0/30.0
- ARV discount +15.0/15.0
- DSCR +10.0/10.0
- 1% rule +9.6/10.0
- Appreciation +5.5/10.0
- Schools +5.5/10.0
- Livability +3.6/5.0
- Rent growth +2.5/5.0
- Condition / age +2.5/5.0
$169,900
🖨 Deal sheet 📄 Offer letter ✓ Due diligence
Listing remarks
Tucked away on a quiet street yet just minutes from main roadways and the NYS Thruway, this 3-bedroom, 2 full bath home offers the perfect blend of convenience and privacy within the Clinton School District. The layout features spacious main living areas, with all bedrooms located on the second level. A standout feature is the enclosed, heated front porch. .. ideal for year-round use. Enjoy summer evenings with the windows open and no bugs in sight, or cozy up during cooler months with a versatile bonus living space. Major improvements have already been completed, including replacement windows, a newer high-efficiency furnace, and low-maintenance vinyl siding. The home offers a great opport
Key facts
- Detached garages
- Replacement windows
- 8,500 sq ft lot
Tags
Neighborhood map
What this means for you Summary
Snapshot
- This is a 3-bed/2.0-bath single-family listed at $170k.
Deal economics
- At list price, monthly cash flow is $668 ($8k/yr) — positive.
- The deal already cash-flows at list — no discount required.
- Meets the 1% rule at list price ($2k rent vs $170k).
- Recommended offer: $165k (3.0% below list) — sets the bar for market timing.
Location & tenants
- Location reads 71/100 on livability (#383 in NY) — a middle-class / working-renter tenant base. Strengths: housing A+, health & safety A+, crime A; Watch: schools D-, amenities F, commute F.
- Clinton Central School District (suburban): math 57% / reading 71% proficiency, ranked #185 of 590 in NY (top 31%) — acceptable for families but not a draw, mixed tenant base, ~2y average lease; only 17% free/reduced lunch — higher-income household profile.
- Market conditions: 8 active listings in the ZIP; 4 comparable units currently listed for rent nearby; rentals lingering (median 44d on market — plan ~5-8 weeks vacancy on turnover, expect pricing pressure); 100% of comp listings sitting > 30 days — soft ceiling on asking rent; 204 units permitted in Oneida County in 2024 (68 in 5+ unit buildings).
Forward outlook
- In year one you build about $3k of equity ($1k loan paydown + $2k appreciation (1.0% local appreciation)).
- Oneida County population projected at -12% by 2050 — secular population decline; favor cash flow + early exit over multi-decade hold.
- At projected returns (1.0% appreciation + 3.0% rent growth), your $48k cash investment doubles in ~4 years — after that, you're playing with house money.
Negotiation context
- It's been on market 46 days — a 3% lower offer ($165k) is reasonable based on typical stale-listing flexibility.
Risks & watch-outs
- Watch-outs: built in 1920 — expect roof / HVAC / electrical / plumbing capex.
Questions for the listing agent
- It's been on market 46 days. Have you received any prior offers? Is the seller open to a 3% concession, seller financing, or rate buy-down credit?
- Built in 1920 — when were the roof, HVAC, electrical panel, plumbing, and water heater last replaced?
- Is there a deadline driving the sale (1031 exchange, divorce, estate, relocation)? That informs how much negotiation room exists.
- Schools are D-rated, which usually means shorter tenancies and higher turnover. Who's the typical renter profile here, and what's been the actual vacancy rate?
- What's the average days-on-market for RENTAL listings here right now (not sales)? A rising rental-DOM trend means longer vacancies and softer asking-rent achievability than the comps imply.
- What's the recent tenant-quality profile in this submarket — average credit score on applications, eviction rate, late-payment / NSF rate, and stable-employment percentage? A property-management company in the area should have these aggregated.
- How much new for-sale + rental construction is in the pipeline within 1–3 miles? Heavy new supply typically softens prices + rents 12–24 months out; constrained supply supports both.
Investment metrics
- 1% rule
- 1.46% ✓
- Cap rate
- 11.01%
- Cash-on-cash
- 16.85%
- DSCR
- 1.75
- GRM
- 5.7
CMA / ARV
- ARV (on-the-fly)
- $213,000
- Comps found
- 7
Show comp detail 7 sales within ~0.75 mi
| Address | Dist | Beds/Ba | Sqft | Sold | Price | $/sf | Match |
|---|---|---|---|---|---|---|---|
| 43 White St | 0.20mi | 4/1.5 (+1) | 1,766 (+4%) | 2mo | $100,000 | $57 | 76 |
| 37 White St | 0.16mi | 4/2.0 (+1) | 1,656 (-3%) | 11mo | $235,000 | $142 | 74 |
| 7674 E Main St | 0.12mi | 3/2.5 | 1,576 (-8%) | 12mo | $160,000 | $102 | 70 |
| 4646 French Rd | 0.27mi | 3/1.0 | 1,758 (+3%) | 18mo | $278,000 | $158 | 64 |
| 11 White St | 0.04mi | 3/2.0 | 1,488 (-13%) | 17mo | $92,000 | $62 | 63 |
| 7826 Clark Mills Rd | 0.45mi | 4/2.0 (+1) | 1,838 (+8%) | 15mo | $230,000 | $125 | 48 |
| 4796 Newman Dr | 0.53mi | 3/1.5 | 1,472 (-14%) | 9mo | $280,000 | $190 | 43 |
Match score weights: distance 35% · size 25% · config 20% · recency 20%. Top-matched comps best support the ARV.
Projected returns pro-forma
0.98% appreciation · 3.0% rent growth · sell at horizon
- IRR
- 18.8%
- Equity multiple
- 1.96×
- Total profit
- $45,653
- Equity at exit
- $57,809
- IRR
- 22.0%
- Equity multiple
- 3.66×
- Total profit
- $126,657
- Equity at exit
- $76,676
Cash invested: $47,572 (down + closing). Projections, not guarantees.
Landlord ↔ Tenant lean methodology
- Overall (STATE)
- 15 Strongly Tenant-Friendly
- State New York
- 15 Strongly Tenant-Friendly · D+10
- County
- — inherits STATE
- City
- — inherits STATE
ZIP-level market 13321
- Home prices YoY
- 0.3%
- Active inventory
- 8
- Price-to-rent
- 5.7×
Monthly cashflow live
- Estimated rent
- $2,472 medium interval (Pro) →
- Mortgage (P&I)
- −$891
- Tax from tax record
- −$323 /mo · $3,880/yr
- Insurance
- −$71
- HOA
- −$0
- Vacancy / Maint / Mgmt
- −$519
- Net cashflow
- $668
Break-even live
UW: 25.0% down · 7.5% · 30yr · 1.5% tax · 5.0% vac · 8.0% maint · 8.0% mgmt
Financing live
Cash to close
- Down payment
- $42,475
- Closing costs
- $5,097
- Reserves months
- —
- Total cash needed
- —
Loan-product check · same deal, 3 products live
Conventional
25% down · 7.5% · 30yr
- Down + closing
- —
- Monthly P&I
- —
- Monthly cashflow
- —
- DSCR
- —
- Eligible?
- —
Personal DTI + credit; lowest rate.
DSCR
20% down · 8.5% · 30yr
- Down + closing
- —
- Monthly P&I
- —
- Monthly cashflow
- —
- DSCR
- —
- Eligible?
- —
No personal income docs; deal must DSCR.
Hard money
10% down · 12.0% · 12mo
- Down + closing
- —
- Monthly P&I
- —
- Monthly cashflow
- —
- DSCR
- —
- Eligible?
- —
Short-term bridge; refi at stabilization.
Rent comps 4 comps
| Address | Beds | Baths | Sqft | Rent | $/sqft | DOM | Units | Dist |
|---|---|---|---|---|---|---|---|---|
| 105 Pheasants Run Clinton, NY | 2.0 | 1.5 | 1050 | $2,150 | $2.05 | 43d | 1 | 0.65mi |
| 122 Pheasants Run Kirkland, NY | 2.0 | 2.0 | 1200 | $3,100 | $2.58 | 43d | 1 | 0.73mi |
| 135 Pheasants Run Clark Mills, NY | 2.0 | 1.5 | 1100 | $2,350 | $2.14 | 43d | 1 | 0.74mi |
| 130 Pheasants Run Clinton, NY | 2.0 | 1.5 | 1200 | $2,250 | $1.88 | 43d | 1 | 0.79mi |
Listing history 3 events
-
2026-05-12status Pending
-
2026-03-30historical Active Under Contract
-
2026-03-26$169,900 Active
ⓘ Source: listings_history table (triggers on properties + properties_extension) + one-shot
backfill from property_details.listing_events for pre-trigger history.
Tax reassessment forecast NY · Partial reset (capped growth)
- Current annual tax
- $3,880 · $323/mo
- Projected year-2 tax
- $3,880 · $323/mo
- Expected delta
- $0/yr ($0/mo · 0.0%)
ⓘ Screening estimate from a state-policy table — verify with the county assessor before closing.
Climate risk First Street
- Flood 1/10 Low FEMA zone X (unshaded) · 0% chance over 30 yrs
- Wildfire 1/10 Low
- Heat 3/10 Moderate 7 d/yr ≥95°F today · 17 d/yr by 30 yrs out
- Wind 1/10 Low 0% chance of damaging wind over 30 yrs
- Air quality 2/10 Low 0 unhealthy d/yr today · 2 by 30 yrs out
Nearby sold comps map
Loading sold comps map…
Walkable amenities ~0.75 mi
Loading nearby amenities…
Taxation est. · year 1
- Rental income
- $29,668
- − Mortgage interest
- −$9,517
- − Property taxes
- −$3,880
- − Insurance
- −$850
- − Repairs & maintenance
- −$2,373
- − Management
- −$2,373
- − Depreciation
- −$4,943
- Taxable income
- $5,733
- Est. tax owed @ 24.0%
- −$1,376
- After-tax cash flow
- $6,641/yr
For passive investors: Depreciation is non-cash, so a rental often shows a tax loss while cash-flowing — sheltering income. Rental losses are passive: they offset passive income freely, and up to $25,000/yr can offset ordinary (W-2) income if you actively participate and your MAGI is under $100k (phasing out to $0 by $150k); unused losses carry forward. On sale, claimed depreciation is recaptured at up to 25%, and gains may owe capital-gains tax (a 1031 exchange can defer both). Figures are a year-1 estimate at your 24.0% rate — not tax advice; consult a CPA.
Schools (NCES district)
- District
- Clinton Central School District
- NCES district ID
- 3607770
- Math proficiency
- 57% ▼ -11.00%
- Reading proficiency
- 71% ▲ 6.00%
- Median HH income
- $57,439
- Composite
- 55.05/100
- National rank
- #1290
- State rank
- #185 of 590 in NY
Livability — Clark Mills
- Score
- 71/100
- State rank
- #383
- US rank
- #6606
Category grades
Schools grade is shown separately in the Schools card above.
Census & demographics
- Census place
- Clark Mills, NY
- City population
- 815
- Population (ZIP)
- 815
Population outlook (Oneida County) Hauer SSP2
- Today (2025)
- 225,223 people
- By 2030
- 220,384 · -2.1%
- By 2040
- 209,071 · -7.2%
- By 2050
- 197,920 · -12.1%
- By 2075
- 175,541 · -22.1%
- By 2100
- 148,491 · -34.1%
Race, ethnicity, and origin ACS 2023
- Neighborhood character
- Predominantly White (92%)
- Race & ethnicity
- White 92% Hispanic / Latino 7%
- Hispanic origin (detail)
- Mexican 7%
- Common ancestry
- Subsaharan African 11% Romanian 8% Lithuanian 4%
- Foreign-born
- 7% · Canada
Political lean MEDSL · Oneida
- 2024 margin
- Strong R (+21.3) · D 39.4% · R 60.6%
- 2008→2024 swing
- -15.2pp toward R · 2008: -6.1pp · 2024: -21.3pp
- All cycles
- 2024: R+21.3 2020: R+15.5 2016: R+21.1 2012: R+5.3 2008: R+6.1
Not yet ingested
- Civics
- —
Market trends
- HPI YoY
- ▲ 0.98%
- Current HPI
- 281.0024
- Rent YoY
- —
- Metro
- —
- State GDP YoY
- ▲ 2.60%
- F500 in state
- 92
Industry mix (Fortune 500 HQ in NY)
| Industry | F500 HQs | Revenue |
|---|---|---|
| Financial Services | 10 | $950B |
|
||
| Consumer Goods | 9 | $162B |
|
||
| Insurance | 4 | $225B |
|
||
| Telecommunications | 2 | $144B |
|
||
| Pharmaceuticals | 2 | $112B |
|
||
| Media / Entertainment | 2 | $69B |
|
||
Price history
3 events — show timeline
- 2026-05-12 Pending — CNYIS
- 2026-03-30 Contingent — CNYIS
- 2026-03-26 Listed $169,900 CNYIS
Property tax history
+6.7%/yrLatest (2025): $3,880 · +4.9% YoY. Source: county tax records.
Cash-flow waterfall
monthlySold comps — $/sqft
last 12 mo · ≤1 miLoading sold comps…