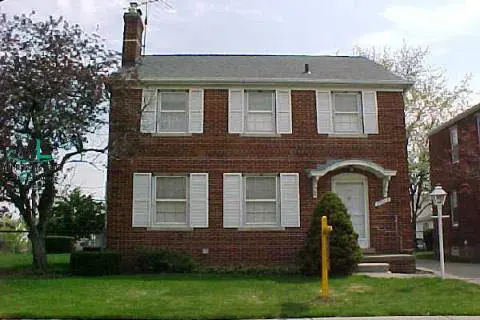
15082 Hazelridge St · Detroit, MI
Flood risk 1/10 · Minimal
- FEMA flood zone
- X (unshaded)
- Chance of flooding over 30 yrs
- 0.0%
- Est. flood insurance / yr
- $473 – $860
Fire risk 1/10 · Minimal
- Est. fire insurance / yr
- $784 – $1,456
Heat risk 3/10 · Minor
- Hot days now (above 95°F)
- 7 days/yr
- Hot days in 30 yrs
- 15 days/yr
Wind risk 2/10 · Minimal
- Chance of severe wind over 30 yrs
- —
Air-quality risk 3/10 · Minor
- Unhealthy air days now
- 2 days/yr
- Unhealthy air days in 30 yrs
- 5 days/yr
Risk factors via First Street. Map © Google.
Why this score? — see what drove the B- grade
The composite is a weighted blend of 9 inputs, each scored 0–100. Each bar is that input's sub-score; the figure is the points it added to the 100-point composite (weight × sub-score).
- Cash flow +30.0/30.0
- 1% rule +10.0/10.0
- DSCR +10.0/10.0
- ARV discount +8.7/15.0
- Livability +3.7/5.0
- Rent growth +2.8/5.0
- Condition / age +2.5/5.0
- Schools +1.3/10.0
- Appreciation +0.0/10.0
$85,000
🖨 Deal sheet 📄 Offer letter ✓ Due diligence
Listing remarks MLS
Beautiful and spacious brick home in the Mapleridge neighborhood of Detroit's east side. This 3 bedroom 1 and a half bath home was fully renovated in 2020 with new roof, plumbing, electric, kitchen, and bathroom. Home features hard wood floors throughout. Currently just needs fresh paint. Perfect home for a first time buyer or investor looking for turn-key deal. Home has Certificate Of Occupancy valid through 9/13/26.
Key facts
- Fully renovated
- New plumbing
- Brick home
Tags
Property features AI
Exterior
- Parking: Driveway; no garage
- Utilities: Public water; Public sewer; Electric with circuit breakers, fuses and 220V
- Home design: Single-family residential; Two levels; Ground-level entry; Brick construction
- Construction: Block foundation
- Exterior features: Paved road access; Shingle roof
Interior
- Kitchen: Electric water heater
- Bedrooms: 3 total rooms (bedroom count not specified)
- Bathrooms: 1 full bathroom
- Interior features: ENERGY STAR qualified windows; Unfurnished; Unfinished basement
- Laundry & utility: Washer hookup; Electric dryer hookup
Neighborhood map
What this means for you Summary
Snapshot
- This is a 3-bed/1.0-bath single-family listed at $85k.
Deal economics
- At list price, monthly cash flow is $465 ($6k/yr) — positive.
- The deal already cash-flows at list — no discount required.
- Meets the 1% rule at list price ($1k rent vs $85k).
- Cap rate 12.9% vs local median 10.2% in Detroit — meaningfully above typical; check what's discounted (condition, days-on-market, listing class) to confirm the premium yield is real.
Location & tenants
- Location reads 73/100 on livability (#218 in MI) — a middle-class / working-renter tenant base. Strengths: amenities A+, commute A+, cost of living A+; Watch: schools F, crime F, employment F.
- Detroit Public Schools Community District (urban): math 10% / reading 24% proficiency, ranked #499 of 540 in MI (top 92%) — low school quality limits family demand, transient renter base, plan for 1-2y turnover; 90% free/reduced lunch — lower-income household profile, screen leases tightly.
- Market conditions: Rents rising (+1.3%/yr); 373 active listings in the ZIP; 40 comparable units currently listed for rent nearby; rentals at typical pace (median 18d on market — plan ~3-4 weeks tenant-placement turnaround); lower-income renter base — watch delinquency; 2,639 units permitted in Wayne County in 2024 (1,216 in 5+ unit buildings).
- This rent runs 40% of the median local income ($39k/yr) — at the standard rent-burdened threshold; future hikes will face affordability resistance.
Forward outlook
- Local home prices are declining (-3.0%/yr); year-one equity from $588 of loan paydown is wiped out by about $3k of value loss. Plan a longer hold.
- Wayne County population projected at -17% by 2050 — secular population decline; favor cash flow + early exit over multi-decade hold.
- At projected returns (-3.0% appreciation + 1.3% rent growth), your $24k cash investment doubles in ~6 years — after that, you're playing with house money.
Negotiation context
- Only 7 days on market — expect competitive offers; lowballing is unlikely to land.
- 9 sale attempts since 21y ago with the ask held roughly flat each time — persistent listings suggest the price (not the market) is what's stuck; bring a comps-based counter.
Risks & watch-outs
- Watch-outs: built in 1940 — expect roof / HVAC / electrical / plumbing capex.
Questions for the listing agent
- Built in 1940 — when were the roof, HVAC, electrical panel, plumbing, and water heater last replaced?
- Is there a deadline driving the sale (1031 exchange, divorce, estate, relocation)? That informs how much negotiation room exists.
- Schools are F-rated, which usually means shorter tenancies and higher turnover. Who's the typical renter profile here, and what's been the actual vacancy rate?
- Crime grade is F in this area — have there been break-ins, vandalism, or insurance claims at this property in the last 3 years? What carrier currently insures it and at what premium?
- What's the average days-on-market for RENTAL listings here right now (not sales)? A rising rental-DOM trend means longer vacancies and softer asking-rent achievability than the comps imply.
- What's the recent tenant-quality profile in this submarket — average credit score on applications, eviction rate, late-payment / NSF rate, and stable-employment percentage? A property-management company in the area should have these aggregated.
- How much new for-sale + rental construction is in the pipeline within 1–3 miles? Heavy new supply typically softens prices + rents 12–24 months out; constrained supply supports both.
Investment metrics
- 1% rule
- 1.54% ✓
- Cap rate
- 12.86%
- Cash-on-cash
- 23.46%
- DSCR
- 2.04
- GRM
- 5.4
CMA / ARV
- ARV (median comp)
- $87,427
- List price
- $85,000
- Delta
- -14.21%
- Verdict
- UNDERPRICED
- Comps
- 20 within 1.0 mi
Show comp detail 12 sales within ~0.75 mi
| Address | Dist | Beds/Ba | Sqft | Sold | Price | $/sf | Match |
|---|---|---|---|---|---|---|---|
| 15469 Troester St | 0.27mi | 3/1.0 | 1,375 (-1%) | 1mo | $60,000 | $44 | 85 |
| 11336 Courville St | 0.38mi | 3/1.0 | 1,425 (+3%) | 0mo | $62,500 | $44 | 77 |
| 15309 Mapleridge St | 0.36mi | 3/1.5 | 1,348 (-3%) | 3mo | $116,000 | $86 | 74 |
| 15419 Young St | 0.19mi | 3/1.0 | 1,250 (-10%) | 3mo | $54,500 | $44 | 72 |
| 15411 Young St St | 0.18mi | 3/1.5 | 1,240 (-11%) | 2mo | $95,000 | $77 | 70 |
| 11323 Lansdowne St | 0.59mi | 3/1.5 | 1,397 (+1%) | 2mo | $133,282 | $95 | 68 |
| 15430 Mapleridge St | 0.36mi | 4/1.5 (+1) | 1,320 (-5%) | 1mo | $123,000 | $93 | 67 |
| 14210 Wilfred St | 0.70mi | 3/1.0 | 1,264 (-9%) | 0mo | $17,000 | $13 | 52 |
| 11742 Whitehill St | 0.59mi | 3/1.5 | 1,228 (-12%) | 1mo | $61,000 | $50 | 51 |
| 15416 Eastwood St | 0.66mi | 3/1.0 | 1,211 (-13%) | 2mo | $70,000 | $58 | 46 |
| 10709 Bonita St | 0.69mi | 3/1.0 | 1,226 (-12%) | 4mo | $82,000 | $67 | 45 |
| 15652 Eastwood St | 0.73mi | 3/1.0 | 1,221 (-12%) | 4mo | $53,700 | $44 | 42 |
Match score weights: distance 35% · size 25% · config 20% · recency 20%. Top-matched comps best support the ARV.
Projected returns pro-forma
-3.0% appreciation · 1.33% rent growth · sell at horizon
- IRR
- 14.7%
- Equity multiple
- 1.58×
- Total profit
- $13,698
- Equity at exit
- $12,674
- IRR
- 22.1%
- Equity multiple
- 2.74×
- Total profit
- $41,516
- Equity at exit
- $7,349
Cash invested: $23,800 (down + closing). Projections, not guarantees.
Landlord ↔ Tenant lean methodology
- Overall (STATE)
- 62 Landlord-Friendly
- State Michigan
- 62 Landlord-Friendly · EVEN
- County
- — inherits STATE
- City
- — inherits STATE
ZIP-level market 48205
- Home prices YoY
- -28.1%
- Rents YoY
- 1.3%
- Active inventory
- 373
- Price-to-rent
- 5.4×
Monthly cashflow live
- Estimated rent
- $1,313 high interval (Pro) →
- Mortgage (P&I)
- −$446
- Tax from tax record
- −$91 /mo · $1,088/yr
- Insurance
- −$35
- HOA
- −$0
- Vacancy / Maint / Mgmt
- −$276
- Net cashflow
- $465
Break-even live
UW: 25.0% down · 7.5% · 30yr · 1.5% tax · 5.0% vac · 8.0% maint · 8.0% mgmt
Financing live
Cash to close
- Down payment
- $21,250
- Closing costs
- $2,550
- Reserves months
- —
- Total cash needed
- —
Loan-product check · same deal, 3 products live
Conventional
25% down · 7.5% · 30yr
- Down + closing
- —
- Monthly P&I
- —
- Monthly cashflow
- —
- DSCR
- —
- Eligible?
- —
Personal DTI + credit; lowest rate.
DSCR
20% down · 8.5% · 30yr
- Down + closing
- —
- Monthly P&I
- —
- Monthly cashflow
- —
- DSCR
- —
- Eligible?
- —
No personal income docs; deal must DSCR.
Hard money
10% down · 12.0% · 12mo
- Down + closing
- —
- Monthly P&I
- —
- Monthly cashflow
- —
- DSCR
- —
- Eligible?
- —
Short-term bridge; refi at stabilization.
Rent comps 40 comps
| Address | Beds | Baths | Sqft | Rent | $/sqft | DOM | Units | Dist |
|---|---|---|---|---|---|---|---|---|
| 15010 Cedargrove St Detroit, MI | 3.0 | 1.5 | 1018 | $1,350 | $1.33 | 43d | 1 | 0.07mi |
| 15000 Mayfield St Detroit, MI | 3.0 | 1.0 | 1146 | $970 | $0.85 | 17d | 1 | 0.21mi |
| 12651 Kelly Rd Unit 1 Detroit, MI | 2.0 | 1.0 | 1680 | $1,150 | $0.68 | 11d | 1 | 0.24mi |
| 12655 Kelly Rd Detroit, MI | 2.0 | 1.0 | 1680 | $1,150 | $0.68 | 11d | 1 | 0.24mi |
| 15494 Mapleridge St Detroit, MI | 3.0 | 1.0 | 937 | $1,275 | $1.36 | 43d | 1 | 0.38mi |
| 14201 Mayfield St Detroit, MI | 4.0 | 1.5 | 1296 | $1,250 | $0.96 | 43d | 1 | 0.58mi |
| 11018 Whitehill St Detroit, MI | 3.0 | 1.0 | 1146 | $1,450 | $1.27 | 11d | 1 | 0.66mi |
| 10813 Whitehill St Detroit, MI | 3.0 | 1.0 | 1392 | $1,350 | $0.97 | 17d | 1 | 0.69mi |
| 11911 Lansdowne St Detroit, MI | 4.0 | 1.0 | 1350 | $1,400 | $1.04 | 43d | 1 | 0.73mi |
| 10724 Whitehill St Detroit, MI | 3.0 | 3.0 | 1425 | $1,550 | $1.09 | 17d | 1 | 0.74mi |
| 11689 Wayburn St Detroit, MI | 3.0 | 1.0 | 1142 | $1,350 | $1.18 | 43d | 1 | 0.77mi |
| 10644 Stratman St Detroit, MI | 2.0 | 1.0 | 1000 | $1,200 | $1.20 | 17d | 1 | 0.78mi |
| 15616 E 7 Mile Rd Detroit, MI | 3.0 | 1.5 | 1150 | $1,150 | $1.00 | 17d | 1 | 0.78mi |
| 12716 Riad St Detroit, MI | 3.0 | 1.0 | 974 | $1,275 | $1.31 | 17d | 1 | 0.82mi |
| 10803 Roxbury St Detroit, MI | 3.0 | 1.0 | 1150 | $900 | $0.78 | 20d | 1 | 0.85mi |
| 11620 Rossiter St Detroit, MI | 3.0 | 1.0 | 1140 | $1,200 | $1.05 | 17d | 1 | 0.86mi |
| 14481 Maddelein St Detroit, MI | 3.0 | 1.0 | 1200 | $1,100 | $0.92 | 43d | 1 | 0.87mi |
| 11235 Roxbury St Detroit, MI | 3.0 | 1.0 | 1062 | $1,325 | $1.25 | 17d | 1 | 0.89mi |
| 16031 E 7 Mile Rd #5 Detroit, MI | 2.0 | 1.0 | 1204 | $1,200 | $1.00 | 2d | 1 | 0.93mi |
| 11776 Rossiter St Detroit, MI | 3.0 | 1.0 | 964 | $1,150 | $1.19 | 11d | 1 | 0.93mi |
| 14461 Lappin St Detroit, MI | 3.0 | 1.5 | 989 | $1,150 | $1.16 | 17d | 1 | 0.94mi |
| 15604 Coram St Detroit, MI | 3.0 | 1.0 | 1210 | $1,000 | $0.83 | 43d | 1 | 0.94mi |
| 15909 Maddelein St Detroit, MI | 3.0 | 1.0 | 894 | $1,266 | $1.42 | 43d | 1 | 0.96mi |
| 14504 Coram St Detroit, MI | 3.0 | 1.0 | 1203 | $1,175 | $0.98 | 24d | 1 | 0.97mi |
| 10141 Roxbury St Detroit, MI | 3.0 | 1.0 | 1115 | $1,000 | $0.90 | 43d | 1 | 0.98mi |
| 9755 Wayburn St Detroit, MI | 3.0 | 2.0 | 1498 | $1,400 | $0.93 | 3d | 1 | 0.99mi |
| 18530 Kingsville St Harper Woods, MI | 3.0 | 1.5 | 1396 | $1,375 | $0.98 | 17d | 1 | 1.05mi |
| 10404 Somerset Ave Detroit, MI | 3.0 | 1.0 | 1108 | $1,475 | $1.33 | 3d | 1 | 1.05mi |
| 12075 Rossiter St Detroit, MI | 3.0 | 1.0 | 1100 | $1,245 | $1.13 | 15d | 1 | 1.07mi |
| 12075 Rossiter St Detroit, MI | 3.0 | 1.0 | 1100 | $1,245 | $1.13 | 43d | 1 | 1.07mi |
| 12840 Kilbourne St Detroit, MI | 3.0 | 1.0 | 1136 | $1,350 | $1.19 | 17d | 1 | 1.08mi |
| 9927 Beaconsfield St Detroit, MI | 3.0 | 1.0 | 942 | $1,375 | $1.46 | 15d | 1 | 1.09mi |
| 9984 Beaconsfield St Detroit, MI | 3.0 | 1.0 | 1222 | $1,575 | $1.29 | 43d | 1 | 1.09mi |
| 19144 Moross Rd Detroit, MI | 2.0 | 1.0 | 900 | $1,050 | $1.17 | 43d | 1 | 1.10mi |
| 13400 Longview St Detroit, MI | 3.0 | 1.5 | 1000 | $1,400 | $1.40 | 43d | 1 | 1.10mi |
| 12740 August St Detroit, MI | 2.0 | 1.0 | 900 | $1,300 | $1.44 | 5d | 1 | 1.12mi |
| 13218 Greiner St Detroit, MI | 3.0 | 1.0 | 1162 | $1,195 | $1.03 | 17d | 1 | 1.17mi |
| 9400 Lakepointe St Detroit, MI | 3.0 | 1.0 | 1300 | $1,150 | $0.88 | 5d | 1 | 1.19mi |
| 9168 Wayburn St Detroit, MI | 3.0 | 1.0 | 1274 | $1,300 | $1.02 | 20d | 1 | 1.22mi |
| 13137 Elmdale St Detroit, MI | 3.0 | 1.0 | 1115 | $1,400 | $1.26 | 24d | 1 | 1.22mi |
Listing history 29 events
-
2026-06-18days on market $85,000 Active 7 DOM
-
2026-06-17days on market $85,000 Active 6 DOM
-
2026-06-16days on market $85,000 Active 5 DOM
-
2026-06-15days on market $85,000 Active 4 DOM
-
2026-06-13days on market $85,000 Active 2 DOM
-
2026-06-13pricestatusdays on market $85,000 Active 1 DOM
-
2026-05-16historical
-
2026-05-16historical
-
2026-05-07price $75,000
-
2026-05-07price $75,000
-
2026-04-08$99,000 Active
-
2026-04-08$99,000 Active
-
2026-03-01historical
-
2026-03-01historical
-
2026-02-28price $100,000
-
2026-02-27price $100,000
-
2025-10-17$115,000 Active
-
2025-10-17$115,000 Active
-
2022-11-09historical
-
2018-05-03historical
-
2018-02-07status Pending
-
2018-02-07status Pending
-
2018-02-01historical
-
2017-12-14$18,000 Active
-
2017-12-14$18,000 Active
-
2005-08-17soldstatus $89,900
-
2005-07-29soldstatus $89,900
-
2005-07-08historical
-
2005-05-03$89,900
ⓘ Source: listings_history table (triggers on properties + properties_extension) + one-shot
backfill from property_details.listing_events for pre-trigger history.
Tax reassessment forecast MI · Partial reset (capped growth)
- Current annual tax
- $1,088 · $91/mo
- Projected year-2 tax
- $1,199 · $100/mo
- Expected delta
- +$110/yr (+$9/mo · 10.1%)
ⓘ Screening estimate from a state-policy table — verify with the county assessor before closing.
Climate risk First Street
- Flood 1/10 Low FEMA zone X (unshaded) · 0% chance over 30 yrs
- Wildfire 1/10 Low
- Heat 3/10 Moderate 7 d/yr ≥95°F today · 15 d/yr by 30 yrs out
- Wind 2/10 Low
- Air quality 3/10 Moderate 2 unhealthy d/yr today · 5 by 30 yrs out
Nearby sold comps map
Loading sold comps map…
Walkable amenities ~0.75 mi
Loading nearby amenities…
Taxation est. · year 1
- Rental income
- $15,753
- − Mortgage interest
- −$4,761
- − Property taxes
- −$1,088
- − Insurance
- −$425
- − Repairs & maintenance
- −$1,260
- − Management
- −$1,260
- − Depreciation
- −$2,473
- Taxable income
- $4,486
- Est. tax owed @ 24.0%
- −$1,077
- After-tax cash flow
- $4,506/yr
For passive investors: Depreciation is non-cash, so a rental often shows a tax loss while cash-flowing — sheltering income. Rental losses are passive: they offset passive income freely, and up to $25,000/yr can offset ordinary (W-2) income if you actively participate and your MAGI is under $100k (phasing out to $0 by $150k); unused losses carry forward. On sale, claimed depreciation is recaptured at up to 25%, and gains may owe capital-gains tax (a 1031 exchange can defer both). Figures are a year-1 estimate at your 24.0% rate — not tax advice; consult a CPA.
Schools (NCES district)
- District
- Detroit Public Schools Community District
- NCES district ID
- 2601103
- Math proficiency
- 10% ▼ -2.00%
- Reading proficiency
- 24% ▲ 6.00%
- Median HH income
- $25,815
- Composite
- 13.06/100
- National rank
- #9564
- State rank
- #499 of 540 in MI
Livability — Detroit
- Score
- 73/100
- State rank
- #218
- US rank
- #5427
Category grades
Schools grade is shown separately in the Schools card above.
Census & demographics
- Census place
- Detroit, MI
- County
- Wayne County · 1,562,939 people
- City population
- 572,865
- Metro
- Detroit-Warren-Dearborn, MI
- Population (ZIP)
- 34,187
- Household income
- $38,966
- Rent vs Own
- Severe rent burden
- 2121.0
Population outlook (Wayne County) Hauer SSP2
- Today (2025)
- 1,675,273 people
- By 2030
- 1,620,300 · -3.3%
- By 2040
- 1,502,341 · -10.3%
- By 2050
- 1,384,039 · -17.4%
- By 2075
- 1,124,592 · -32.9%
- By 2100
- 881,193 · -47.4%
Race, ethnicity, and origin ACS 2023
- Neighborhood character
- Predominantly Black (93%)
- Race & ethnicity
- Black 93% White 3% Two or more races 2%
- Foreign-born
- 1% · Canada
- Languages at home
- 98% English-only · Spanish 1%
Political lean MEDSL · Wayne
- 2024 margin
- Strong D (+29.0) · D 62.7% · R 33.7% · Other 3.6%
- 2008→2024 swing
- -20.5pp toward R · 2008: 49.5pp · 2024: 29.0pp
- All cycles
- 2024: D+29.0 2020: D+38.1 2016: D+37.3 2012: D+46.9 2008: D+49.5
Not yet ingested
- Civics
- —
Market trends
- HPI YoY
- ▼ -91.80%
- Current HPI
- 235.0926
- Rent YoY
- ▲ 1.33%
- Metro
- Detroit-Warren-Dearborn, MI
- State GDP YoY
- ▲ 1.37%
- F500 in state
- 28
Industry mix (Fortune 500 HQ in MI)
| Industry | F500 HQs | Revenue |
|---|---|---|
| Automotive Parts | 3 | $48B |
|
||
| Automotive | 2 | $372B |
|
||
| Chemicals | 1 | $45B |
|
||
| Automotive Retail | 1 | $29B |
|
||
| Healthcare / Medical Devices | 1 | $23B |
|
||
| Automotive Technology | 1 | $20B |
|
||
Price history
-5.5% since first listed25 events — show timeline
- 2026-06-11 Listed $85,000 MiRealSource-MiMLS
- 2026-06-11 Listed $85,000 REALCOMP
- 2026-05-16 Listing Removed — MiRealSource-MiMLS
- 2026-05-16 Listing Removed — REALCOMP
- 2026-05-07 Price Changed $75,000 MiRealSource-MiMLS
- 2026-05-07 Price Changed $75,000 REALCOMP
- 2026-04-08 Listed $99,000 REALCOMP
- 2026-04-08 Listed $99,000 MiRealSource-MiMLS
- 2026-03-01 Listing Removed — REALCOMP
- 2026-03-01 Listing Removed — MiRealSource-MiMLS
- 2026-02-28 Price Changed $100,000 MiRealSource-MiMLS
- 2026-02-27 Price Changed $100,000 REALCOMP
- 2025-10-17 Listed $115,000 MiRealSource-MiMLS
- 2025-10-17 Listed $115,000 REALCOMP
- 2022-11-09 Rental Removed — RENT.
- 2018-05-03 Listing Removed — REALCOMP
- 2018-02-07 Pending — MiRealSource-MiMLS
- 2018-02-07 Pending — REALCOMP
- 2018-02-01 Listing Removed — MiRealSource-MiMLS
- 2017-12-14 Listed $18,000 MiRealSource-MiMLS
- 2017-12-14 Listed $18,000 REALCOMP
- 2005-08-17 Sold (Public Records) $89,900 Public Records
- 2005-07-29 Sold (MLS) $89,900 MiRealSource-MiMLS
- 2005-07-08 Listing Removed — MiRealSource-MiMLS
- 2005-05-03 Listed $89,900 MiRealSource-MiMLS
Property tax history
+0.1%/yrLatest (2025): $1,088 · +0.4% YoY. Source: county tax records.
Cash-flow waterfall
monthlySold comps — $/sqft
last 12 mo · ≤1 miLoading sold comps…