 6-Plex
2104 SE California Ave · Topeka, KS
Flood risk 1/10 · Minimal
- FEMA flood zone
- X (unshaded)
- Chance of flooding over 30 yrs
- 0.0%
- Est. flood insurance / yr
- $507 – $1,088
Fire risk 1/10 · Minimal
- Est. fire insurance / yr
- $1,154 – $2,142
Heat risk 5/10 · Moderate
- Hot days now (above 107°F)
- 7 days/yr
- Hot days in 30 yrs
- 17 days/yr
Wind risk 2/10 · Minimal
- Chance of severe wind over 30 yrs
- —
Air-quality risk 3/10 · Minor
- Unhealthy air days now
- 3 days/yr
- Unhealthy air days in 30 yrs
- 4 days/yr
Risk factors via First Street. Map © Google.
Why this score? — see what drove the B- grade
The composite is a weighted blend of 9 inputs, each scored 0–100. Each bar is that input's sub-score; the figure is the points it added to the 100-point composite (weight × sub-score).
- Cash flow +30.0/30.0
- 1% rule +10.0/10.0
- DSCR +10.0/10.0
- ARV discount +7.5/15.0
- Livability +3.5/5.0
- Rent growth +2.5/5.0
- Condition / age +2.5/5.0
- Schools +1.7/10.0
- Appreciation +0.0/10.0
$295,000
🖨 Deal sheet 📄 Offer letter ✓ Due diligence
Multi-family units
County records classify this as Multi-Family (2-4 Unit). Listing-text estimate: 6 units. estimate disagrees with records
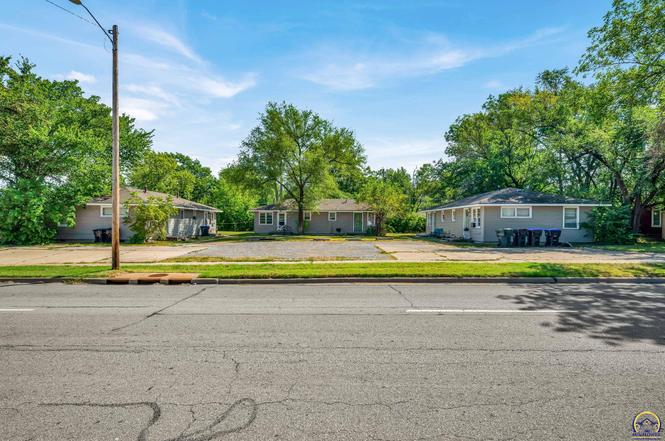
Listing remarks
Seize this superb investment opportunity and secure an immediate stream of rental income with these fully-occupied properties for sale in Topeka, Kansas. This package comprises three side-by-side duplexes, yielding a total of six units with gross rental income of $3,250/mo. Each unit offers one bedroom and one bathroom. County has all three properties listed under 2104 SE California Ave. Individual property addresses are 2104, 2106, & 2108 SE California Ave. Don't miss out on this rare opportunity to secure a multi-family investment package. The detailed rent information is available upon request.
Key facts
- 0.44 acre lot
- 8 parking spots
- Built 1960
Property features AI
Finance
- Financial info: Annual tax amount listed (not included per instructions)
Exterior
- Parking: 8 total parking spaces
- Utilities: Public water; Public sewer
- Home design: Residential income property; Multi-family (2–4 units)
- Exterior features: Corner lot in the Highland Acres subdivision
Interior
- Heating & cooling: Central heating; Window unit air conditioning
- Interior features: Central heating; Window air conditioning units
Neighborhood map
What this means for you Summary
Snapshot
- This is a 6 × 1-bed/1.0-bath units multifamily listed at $295k.
Deal economics
- At list price, monthly cash flow is $2k ($22k/yr) — positive. Per door: $306/mo.
- The deal already cash-flows at list — no discount required.
- Meets the 1% rule at list price ($5k rent vs $295k).
- Recommended offer: $260k (12.0% below list) — sets the bar for market timing.
- Cap rate 13.8% vs local median 4.3% in Topeka — top-decile yield for the area; either an underpriced asset or a hidden risk that comps aren't pricing in. Stress-test before assuming the spread holds.
Location & tenants
- Location reads 69/100 on livability (#195 in KS) — a middle-class / working-renter tenant base. Strengths: cost of living A+, housing A+, health & safety A+; Watch: employment C-, crime F, commute F.
- Topeka Public Schools (urban): math 17% / reading 23% proficiency, ranked #158 of 169 in KS (top 94%) — low school quality limits family demand, transient renter base, plan for 1-2y turnover; 69% free/reduced lunch — lower-income household profile, screen leases tightly.
- Zoned schools: Eisenhower Middle School (math 10% / reading 8%, grade F, #204 of 219 statewide, top 94%, 486 students, 90% FRL); Highland Park High (math 8% / reading 12%, grade F, #306 of 327 statewide, top 95%, 857 students, 85% FRL) — zoned schools average 88% FRL vs 69% district-wide (19 pts higher); higher-poverty schools than district average — tighter screening recommended.
- Market conditions: 52 active listings in the ZIP; 9 comparable units currently listed for rent nearby; rentals at typical pace (median 21d on market — plan ~3-4 weeks tenant-placement turnaround); 219 units permitted in Shawnee County in 2024 (25 in 5+ unit buildings).
- At $4,774/mo this rent would consume 97% of the median local household income ($59k/yr) (locally 490% of renters already pay >50% of income on rent) — very limited rent-growth headroom before tenants either downsize or default.
Forward outlook
- Local home prices are declining (-3.0%/yr); year-one equity from $2k of loan paydown is wiped out by about $9k of value loss. Plan a longer hold.
- Shawnee County population projected to shrink 7% by 2050 — rents likely to lag national; underwrite the cash flow, not the appreciation.
- At projected returns (-3.0% appreciation + 3.0% rent growth), your $83k cash investment doubles in ~5 years — after that, you're playing with house money.
Negotiation context
- It's been on market 143 days — a 12% lower offer ($260k) is reasonable based on typical stale-listing flexibility.
- Current owner paid $87k; list at $295k implies a 239% gain — meaningful room to come down on a strong offer.
Risks & watch-outs
- Climate carrying-cost: extreme-heat days projected 7→17/yr by 2055 (HVAC capex compounding) — expect insurance premiums to compound above CPI over the hold.
Questions for the listing agent
- It's been on market 143 days. Have you received any prior offers? Is the seller open to a 12% concession, seller financing, or rate buy-down credit?
- Can we see the unit-by-unit rent roll, current vacancy, and any below-market leases? What's the average tenancy length?
- What capital expenditures (roof, boiler, parking lot, exteriors) have been made in the last 5 years, and what's planned in the next 2?
- Built in 1960 — when were the roof, HVAC, electrical panel, plumbing, and water heater last replaced?
- Why hasn't it sold? Are there any deal-killer items the seller is aware of (foundation, flood, title, zoning, code violations)?
- Is there a deadline driving the sale (1031 exchange, divorce, estate, relocation)? That informs how much negotiation room exists.
- Schools are D-rated, which usually means shorter tenancies and higher turnover. Who's the typical renter profile here, and what's been the actual vacancy rate?
- Crime grade is F in this area — have there been break-ins, vandalism, or insurance claims at this property in the last 3 years? What carrier currently insures it and at what premium?
- What's the average days-on-market for RENTAL listings here right now (not sales)? A rising rental-DOM trend means longer vacancies and softer asking-rent achievability than the comps imply.
- What's the recent tenant-quality profile in this submarket — average credit score on applications, eviction rate, late-payment / NSF rate, and stable-employment percentage? A property-management company in the area should have these aggregated.
- How much new apartment / multifamily construction is in the pipeline within 1–3 miles? Heavy new supply (>2% of stock underway) typically softens rents 12–24 months out; light construction supports rent growth.
Investment metrics
- 1% rule
- 1.62% ✓
- Cap rate
- 13.76%
- Cash-on-cash
- 26.67%
- DSCR
- 2.19
- GRM
- 5.1
CMA / ARV
No comps found within radius.
Projected returns pro-forma
-3.0% appreciation · 3.0% rent growth · sell at horizon
- IRR
- 20.5%
- Equity multiple
- 1.84×
- Total profit
- $69,110
- Equity at exit
- $43,985
- IRR
- 28.7%
- Equity multiple
- 3.55×
- Total profit
- $210,748
- Equity at exit
- $25,506
Cash invested: $82,600 (down + closing). Projections, not guarantees.
Landlord ↔ Tenant lean methodology
- Overall (STATE)
- 83 Strongly Landlord-Friendly
- State Kansas
- 83 Strongly Landlord-Friendly · R+10
- County
- — inherits STATE
- City
- — inherits STATE
ZIP-level market 66605
- Active inventory
- 52
- Price-to-rent
- 30.9×
Monthly cashflow live
- Estimated rent
- $4,774 high interval (Pro) →
- Mortgage (P&I)
- −$1,547
- Tax from tax record
- −$266 /mo · $3,192/yr
- Insurance
- −$123
- HOA
- −$0
- Vacancy / Maint / Mgmt
- −$1,003
- Net cashflow
- $1,835
Break-even live
6-unit breakdown (identical units grouped — click to expand)
| Units | Beds | Baths | Est. rent |
|---|---|---|---|
| 6× units | 1 | 1 | $4,776 |
| #1 | 1 | 1 | $796 |
| #2 | 1 | 1 | $796 |
| #3 | 1 | 1 | $796 |
| #4 | 1 | 1 | $796 |
| #5 | 1 | 1 | $796 |
| #6 | 1 | 1 | $796 |
| Total (6 units) | $4,774 | ||
UW: 25.0% down · 7.5% · 30yr · 1.5% tax · 5.0% vac · 8.0% maint · 8.0% mgmt
Financing live
Cash to close
- Down payment
- $73,750
- Closing costs
- $8,850
- Reserves months
- —
- Total cash needed
- —
Loan-product check · same deal, 3 products live
Conventional
25% down · 7.5% · 30yr
- Down + closing
- —
- Monthly P&I
- —
- Monthly cashflow
- —
- DSCR
- —
- Eligible?
- —
Personal DTI + credit; lowest rate.
DSCR
20% down · 8.5% · 30yr
- Down + closing
- —
- Monthly P&I
- —
- Monthly cashflow
- —
- DSCR
- —
- Eligible?
- —
No personal income docs; deal must DSCR.
Hard money
10% down · 12.0% · 12mo
- Down + closing
- —
- Monthly P&I
- —
- Monthly cashflow
- —
- DSCR
- —
- Eligible?
- —
Short-term bridge; refi at stabilization.
Rent comps 9 comps
| Address | Beds | Baths | Sqft | Rent | $/sqft | DOM | Units | Dist |
|---|---|---|---|---|---|---|---|---|
| 2351 SE Bellview Ave Topeka, KS | 1.0–3.0 | 1.0–1.5 | 1132 | $1,105 | $0.98 | 21d | 1 | 0.45mi |
| 2435 SE Colorado Ave Topeka, KS | 3.0 | 1.0 | 1100 | $1,200 | $1.09 | 21d | 1 | 0.45mi |
| 1110 SE Powell St Unit 12-2169 Topeka, KS | 3.0 | 1.5 | 909 | $980 | $1.08 | 21d | 1 | 0.51mi |
| 1110 SE Powell St Topeka, KS | 2.0 | 1.5 | 765 | $695 | $0.91 | 21d | 1 | 0.51mi |
| 1724 SE Pennsylvania Ave Unit B Topeka, KS | 2.0 | 1.0 | 960 | $850 | $0.89 | 21d | 1 | 0.96mi |
| 3024 SE Swygart St Apt F Topeka, KS | 2.0 | 1.0 | 800 | $895 | $1.12 | 21d | 1 | 1.17mi |
| 501 SE 25th St Topeka, KS | 3.0 | 1.5 | 1200 | $1,295 | $1.08 | 21d | 1 | 1.18mi |
| 2704 SE Massachusetts Ave Topeka, KS | 3.0 | 1.0 | 936 | $950 | $1.01 | 21d | 1 | 1.19mi |
| 423 SE Winfield Ave Unit 421-23 Arter-423 Arter Topeka, KS | 3.0 | 1.0 | 775 | $910 | $1.17 | 21d | 1 | 1.48mi |
Listing history 19 events
-
2026-06-19days on market $295,000 Active 143 DOM
-
2026-06-18days on market $295,000 Active 142 DOM
-
2026-06-17days on market $295,000 Active 141 DOM
-
2026-06-16days on market $295,000 Active 140 DOM
-
2026-06-15days on market $295,000 Active 139 DOM
-
2026-06-14days on market $295,000 Active 137 DOM
-
2026-06-13days on market $295,000 Active 136 DOM
-
2026-06-10days on market $295,000 Active 134 DOM
-
2026-06-09days on market $295,000 Active 133 DOM
-
2026-06-08days on market $295,000 Active 132 DOM
-
2026-06-07days on market $295,000 Active 131 DOM
-
2026-06-02days on market $295,000 Active 126 DOM
-
2026-06-01days on market $295,000 Active 125 DOM
-
2026-05-31days on market $295,000 Active 124 DOM
-
2026-05-30days on market $295,000 Active 123 DOM
-
2026-04-27price $295,000
-
2026-01-27$300,000 Active
-
2012-03-15soldstatus
-
2000-03-01soldstatus $87,000
ⓘ Source: listings_history table (triggers on properties + properties_extension) + one-shot
backfill from property_details.listing_events for pre-trigger history.
Tax reassessment forecast KS · Resets to sale price
- Current annual tax
- $3,192 · $266/mo
- Projected year-2 tax
- $4,160 · $347/mo
- Expected delta
- +$967/yr (+$81/mo · 30.3%)
ⓘ Screening estimate from a state-policy table — verify with the county assessor before closing.
Climate risk First Street
- Flood 1/10 Low FEMA zone X (unshaded) · 0% chance over 30 yrs
- Wildfire 1/10 Low
- Heat 5/10 Major 7 d/yr ≥107°F today · 17 d/yr by 30 yrs out
- Wind 2/10 Low
- Air quality 3/10 Moderate 3 unhealthy d/yr today · 4 by 30 yrs out
Nearby sold comps map
Loading sold comps map…
Walkable amenities ~0.75 mi
Loading nearby amenities…
Taxation est. · year 1
- Rental income
- $57,288
- − Mortgage interest
- −$16,525
- − Property taxes
- −$3,192
- − Insurance
- −$1,475
- − Repairs & maintenance
- −$4,583
- − Management
- −$4,583
- − Depreciation
- −$8,582
- Taxable income
- $18,348
- Est. tax owed @ 24.0%
- −$4,404
- After-tax cash flow
- $17,622/yr
For passive investors: Depreciation is non-cash, so a rental often shows a tax loss while cash-flowing — sheltering income. Rental losses are passive: they offset passive income freely, and up to $25,000/yr can offset ordinary (W-2) income if you actively participate and your MAGI is under $100k (phasing out to $0 by $150k); unused losses carry forward. On sale, claimed depreciation is recaptured at up to 25%, and gains may owe capital-gains tax (a 1031 exchange can defer both). Figures are a year-1 estimate at your 24.0% rate — not tax advice; consult a CPA.
Schools (NCES district)
- District
- Topeka Public Schools
- NCES district ID
- 2012260
- Math proficiency
- 17% ▼ -8.00%
- Reading proficiency
- 23% ▼ -2.00%
- Median HH income
- $37,405
- Composite
- 16.69/100
- National rank
- #9167
- State rank
- #158 of 169 in KS
Livability — Topeka
- Score
- 69/100
- State rank
- #195
- US rank
- #8848
Category grades
Schools grade is shown separately in the Schools card above.
Census & demographics
- Census place
- Topeka, KS
- County
- Shawnee County · 118,130 people
- City population
- 118,130
- Metro
- Topeka, KS
- Population (ZIP)
- 20,891
- Household income
- $59,106
- Rent vs Own
- Severe rent burden
- 490.0
Population outlook (Shawnee County) Hauer SSP2
- Today (2025)
- 179,277 people
- By 2030
- 177,762 · -0.8%
- By 2040
- 172,341 · -3.9%
- By 2050
- 166,330 · -7.2%
- By 2075
- 152,417 · -15.0%
- By 2100
- 134,782 · -24.8%
Race, ethnicity, and origin ACS 2023
- Neighborhood character
- Diverse neighborhood (Simpson 0.58)
- Race & ethnicity
- White 60% Hispanic / Latino 20% Black 13% Two or more races 10%
- Hispanic origin (detail)
- Mexican 17% Puerto Rican 2%
- Common ancestry
- Lithuanian 3% Slovak 1% Italian 1%
- Foreign-born
- 6% · Canada
- Languages at home
- 90% English-only · Spanish 9% Other Indo-European 1%
Political lean MEDSL · Shawnee
- 2024 margin
- Toss-up / Even · D 49.3% · R 48.8% · Other 2.0%
- 2008→2024 swing
- +0.8pp no change · 2008: -0.3pp · 2024: 0.5pp
- All cycles
- 2024: D+0.5 2020: D+3.0 2016: R+2.8 2012: R+1.7 2008: R+0.3
Not yet ingested
- Civics
- —
Market trends
- HPI YoY
- ▼ -150.37%
- Current HPI
- 206.375
- Rent YoY
- —
- Metro
- Topeka, KS
- State GDP YoY
- —
- F500 in state
- 0
Price history
+239.1% since first listed4 events — show timeline
- 2026-04-27 Price Changed $295,000 Sunflower MLS as distributed by MLS GRID
- 2026-01-27 Listed $300,000 Sunflower MLS as distributed by MLS GRID
- 2012-03-15 Sold (Public Records) — Public Records
- 2000-03-01 Sold (Public Records) $87,000 Public Records
Property tax history
+3.3%/yrLatest (2025): $3,192 · +7.0% YoY. Source: county tax records.
Cash-flow waterfall
monthlySold comps — $/sqft
last 12 mo · ≤1 miLoading sold comps…