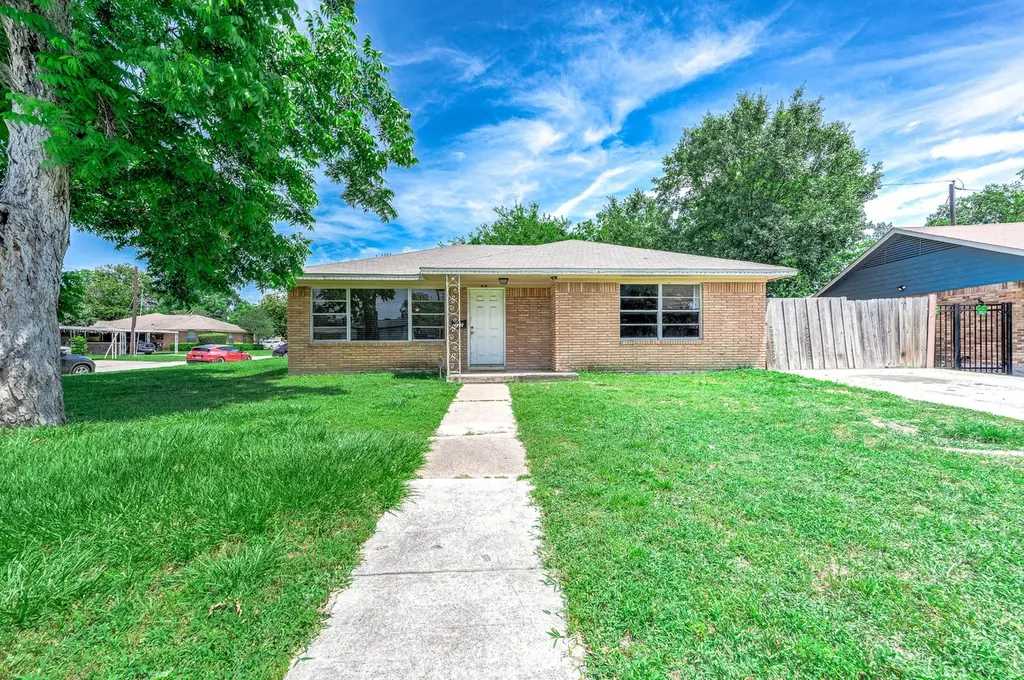
122 W Riverwood Dr · Houston, TX
Flood risk 1/10 · Minimal
- FEMA flood zone
- X (unshaded)
- Chance of flooding over 30 yrs
- 0.0%
- Est. flood insurance / yr
- $507 – $1,088
Fire risk 1/10 · Minimal
- Est. fire insurance / yr
- $1,222 – $2,270
Heat risk 9/10 · Severe
- Hot days now (above 109°F)
- 7 days/yr
- Hot days in 30 yrs
- 24 days/yr
Wind risk 9/10 · Severe
- Chance of severe wind over 30 yrs
- 99.0%
Air-quality risk 3/10 · Minor
- Unhealthy air days now
- 3 days/yr
- Unhealthy air days in 30 yrs
- 4 days/yr
Risk factors via First Street. Map © Google.
Why this score? — see what drove the C- grade
The composite is a weighted blend of 9 inputs, each scored 0–100. Each bar is that input's sub-score; the figure is the points it added to the 100-point composite (weight × sub-score).
- Cash flow +15.3/30.0
- ARV discount +15.0/15.0
- 1% rule +5.4/10.0
- DSCR +4.7/10.0
- Livability +3.7/5.0
- Schools +2.7/10.0
- Rent growth +2.5/5.0
- Condition / age +2.5/5.0
- Appreciation +0.0/10.0
$199,000
🖨 Deal sheet (PDF) 📄 Offer letter ✓ Due diligence
Listing remarks MLS
The transformation came out really nice. This home was brought down to the studs and completely updated from the plumbing to the electrical and to the fine finishes that have become the product that can now be yours. From its spacious floor plan to its brand new kitchen cabinets along with attractive new countertops and brand new bathrooms. Home sits on a corner lot with a spacious back yard and best of all this home is located just seconds to highway access and minutes from Downtown with no HOA required. Don't wait schedule your showing today. Agents please read agent remarks for showing instructions.
Key facts
- Updated finishes
- Spacious lot
- Outdoor oasis
Tags
Property features AI
Finance
- Other:
- Financial info:
- HOA & community:
Exterior
- Parking:
- Security:
- Utilities: Public water; Public sewer
- Home design: Residential property; Full ownership; Slab foundation
- Construction: Brick construction; Composition roof; Built in 1954
- Exterior features: Covered patio; Patio / deck; Private yard; Fenced backyard; Backs to greenbelt/park; Subdivision setting
Interior
- Kitchen: Dishwasher; Disposal; Gas oven; Gas range; Microwave
- Bedrooms: Primary bedroom (first floor) — 12 x 15; Bedroom (first floor) — 10 x 9; Bedroom (first floor) — 9 x 10; Three total rooms used as bedrooms
- Flooring: Tile
- Bathrooms: 2 full bathrooms
- Heating & cooling: Central heating (gas); Central air conditioning
- Interior features: Tub/shower; Window treatments / coverings; Ceiling fans; Combined living and dining area
- Laundry & utility: Washer hookup
Neighborhood map
What this means for you Summary
Snapshot
- This is a 3-bed/2.0-bath single-family listed at $199k.
Deal economics
- At list price, monthly cash flow is $72 ($867/yr) — positive.
- The deal already cash-flows at list — no discount required.
- Meets the 1% rule at list price ($2k rent vs $199k).
- Recommended offer: $196k (1.5% below list) — sets the bar for market timing.
- Cap rate 6.7% vs local median 3.2% in Houston — top-decile yield for the area; either an underpriced asset or a hidden risk that comps aren't pricing in. Stress-test before assuming the spread holds.
Location & tenants
- Location reads 74/100 on livability (#184 in TX, #4,771 nationally) — a middle-class / working-renter tenant base. Strengths: amenities A+, cost of living A+, housing A+; Watch: crime F.
- Houston ISD (urban): math 27% / reading 35% proficiency, ranked #593 of 826 in TX (top 72%) — families likely to look elsewhere, expect single-tenant / working-renter base with shorter leases; 71% free/reduced lunch — lower-income household profile, screen leases tightly.
- Zoned schools: Durkee El (math 24% / reading 26%, grade F, #3,013 of 4,322 statewide, top 70%, 489 students, 98% FRL); Fonville Middle (math 14% / reading 18%, grade F, #1,543 of 1,662 statewide, top 94%, 665 students, 98% FRL); Houston Math Science And Technology Center (math 9% / reading 21%, grade F, #1,507 of 1,632 statewide, top 93%, 2,779 students, 95% FRL) — zoned schools average 97% FRL vs 71% district-wide (26 pts higher); higher-poverty schools than district average — tighter screening recommended.
- Zoned-school proficiency averages 19% at this address vs 31% district-wide (-12 pts) — the specific schools serving this property underperform the Houston ISD average; the district grade overstates school quality for this exact location.
- Market conditions: 84 active listings in the ZIP; 20 comparable units currently listed for rent nearby; rentals at typical pace (median 26d on market — plan ~3-4 weeks tenant-placement turnaround); 45% of comp listings sitting > 30 days — soft ceiling on asking rent; lower-income renter base — watch delinquency; 29,883 units permitted in Harris County in 2024 (8,621 in 5+ unit buildings).
- At $2,064/mo this rent would consume 58% of the median local household income ($43k/yr) (locally 1781% of renters already pay >50% of income on rent) — very limited rent-growth headroom before tenants either downsize or default.
Forward outlook
- Local home prices are declining (-3.0%/yr); year-one equity from $1k of loan paydown is wiped out by about $6k of value loss. Plan a longer hold.
- Harris County population projected at +47% by 2050 — long-run rental-demand tailwind backs the buy-and-hold thesis.
Negotiation context
- It's been on market 25 days — a 2% lower offer ($196k) is reasonable based on typical stale-listing flexibility.
- 5 sale attempts since 15y ago with the ask held roughly flat each time — persistent listings suggest the price (not the market) is what's stuck; bring a comps-based counter.
Risks & watch-outs
- Watch-outs: property tax is 2.6% of price; built in 1954 — expect roof / HVAC / electrical / plumbing capex.
- Climate carrying-cost: severe wind risk, 99% chance of damaging wind over 30y; extreme-heat days projected 7→24/yr by 2055 (HVAC capex compounding) — expect insurance premiums to compound above CPI over the hold.
Questions for the listing agent
- Built in 1954 — when were the roof, HVAC, electrical panel, plumbing, and water heater last replaced?
- Property tax is high relative to price — has the assessment been appealed recently, and will the sale trigger a re-assessment?
- Is there a deadline driving the sale (1031 exchange, divorce, estate, relocation)? That informs how much negotiation room exists.
- Schools are D-rated, which usually means shorter tenancies and higher turnover. Who's the typical renter profile here, and what's been the actual vacancy rate?
- Crime grade is F in this area — have there been break-ins, vandalism, or insurance claims at this property in the last 3 years? What carrier currently insures it and at what premium?
- What's the average days-on-market for RENTAL listings here right now (not sales)? A rising rental-DOM trend means longer vacancies and softer asking-rent achievability than the comps imply.
- What's the recent tenant-quality profile in this submarket — average credit score on applications, eviction rate, late-payment / NSF rate, and stable-employment percentage? A property-management company in the area should have these aggregated.
- How much new for-sale + rental construction is in the pipeline within 1–3 miles? Heavy new supply typically softens prices + rents 12–24 months out; constrained supply supports both.
Investment metrics
- 1% rule
- 1.04% ✓
- Cap rate
- 6.73%
- Cash-on-cash
- 1.56%
- DSCR
- 1.07
- GRM
- 8.0
CMA / ARV
- ARV (on-the-fly)
- $241,914
- Comps found
- 12
Show comp detail 12 sales within ~0.75 mi
| Address | Dist | Beds/Ba | Sqft | Sold | Price | $/sf | Match |
|---|---|---|---|---|---|---|---|
| 202 West Rocky Creek Rd | 0.11mi | 2/2.0 (-1) | 1,769 (+1%) | 8mo | $225,000 | $127 | 82 |
| 505 E Wellington St | 0.43mi | 3/2.0 | 1,748 (-0%) | 4mo | $239,900 | $137 | 76 |
| 6716 Parker Oaks Ln | 0.32mi | 3/2.5 | 1,848 (+5%) | 3mo | $244,900 | $133 | 71 |
| 6708 Parker Grove Ln | 0.35mi | 3/2.5 | 1,836 (+5%) | 5mo | $255,760 | $139 | 70 |
| 153 E Rittenhouse St | 0.33mi | 3/2.5 | 1,666 (-5%) | 8mo | $259,000 | $155 | 68 |
| 209 W Twickenham Trl | 0.05mi | 4/2.0 (+1) | 1,952 (+11%) | 8mo | $265,000 | $136 | 67 |
| 6707 Parker Oaks Ln | 0.31mi | 4/2.5 (+1) | 1,848 (+5%) | 4mo | $239,000 | $129 | 66 |
| 7213 Werner St | 0.42mi | 4/2.0 (+1) | 1,852 (+6%) | 7mo | $130,000 | $70 | 60 |
| 6721 Parker Oaks Ln | 0.30mi | 3/2.5 | 1,498 (-14%) | 1mo | $257,900 | $172 | 59 |
| 715 E Twickenham Trl | 0.62mi | 4/2.0 (+1) | 1,847 (+5%) | 6mo | $255,000 | $138 | 52 |
| 422 Yale Oaks Ln | 0.67mi | 3/2.5 | 1,958 (+12%) | 6mo | $347,500 | $177 | 43 |
| 7514 Meadowshire St | 0.62mi | 4/2.0 (+1) | 1,492 (-15%) | 4mo | $260,000 | $174 | 38 |
Match score weights: distance 35% · size 25% · config 20% · recency 20%. Top-matched comps best support the ARV.
Projected returns pro-forma
-3.0% appreciation · 3.0% rent growth · sell at horizon
- IRR
- -13.7%
- Equity multiple
- 0.51×
- Total profit
- $-27,502
- Equity at exit
- $29,672
- IRR
- -4.8%
- Equity multiple
- 0.69×
- Total profit
- $-17,440
- Equity at exit
- $17,206
Cash invested: $55,720 (down + closing). Projections, not guarantees.
Landlord ↔ Tenant lean methodology
- Overall (STATE)
- 87 Strongly Landlord-Friendly
- State Texas
- 87 Strongly Landlord-Friendly · R+5
- County
- — inherits STATE
- City
- — inherits STATE
ZIP-level market 77076
- Home prices YoY
- -21.5%
- Active inventory
- 84
- Price-to-rent
- 8.0×
Monthly cashflow live
- Estimated rent
- $2,064 high interval (Pro) →
- Mortgage (P&I)
- −$1,044
- Tax from tax record
- −$431 /mo · $5,177/yr
- Insurance
- −$83
- HOA
- −$0
- Vacancy / Maint / Mgmt
- −$433
- Net cashflow
- $72
Break-even live
Sensitivity live
| Price | -10% $185 | -5% $129 | +0% $72 | +5% $16 | +10% $-40 |
|---|---|---|---|---|---|
| Rent | -10% $-91 | -5% $-9 | +0% $72 | +5% $154 | +10% $235 |
| Rate | -1.0pp $172 | -0.5pp $123 | base $72 | +0.5pp $21 | +1.0pp $-32 |
UW: 25.0% down · 7.5% · 30yr · 1.5% tax · 5.0% vac · 8.0% maint · 8.0% mgmt
Financing live
Cash to close
- Down payment
- $49,750
- Closing costs
- $5,970
- Reserves months
- —
- Total cash needed
- —
Loan-product check · same deal, 3 products live
Conventional
25% down · 7.5% · 30yr
- Down + closing
- —
- Monthly P&I
- —
- Monthly cashflow
- —
- DSCR
- —
- Eligible?
- —
Personal DTI + credit; lowest rate.
DSCR
20% down · 8.5% · 30yr
- Down + closing
- —
- Monthly P&I
- —
- Monthly cashflow
- —
- DSCR
- —
- Eligible?
- —
No personal income docs; deal must DSCR.
Hard money
10% down · 12.0% · 12mo
- Down + closing
- —
- Monthly P&I
- —
- Monthly cashflow
- —
- DSCR
- —
- Eligible?
- —
Short-term bridge; refi at stabilization.
Rent comps 20 comps
| Address | Beds | Baths | Sqft | Rent | $/sqft | DOM | Units | Dist |
|---|---|---|---|---|---|---|---|---|
| 6706 Parker Grove Ln Houston, TX | 4.0 | 2.5 | 2129 | $2,200 | $1.03 | 45d | 1 | 0.36mi |
| 313 Sunnyside St Houston, TX | 1.0–3.0 | 1.0–2.0 | 922 | $1,386 | $1.50 | 45d | 16 | 0.43mi |
| 301 W Little York Rd Unit 1722 Houston, TX | 2.0 | 2.0 | 1322 | $1,230 | $0.93 | 22d | 1 | 0.49mi |
| 24 Bucan St Unit C Houston, TX | 3.0 | 2.5 | 1572 | $1,999 | $1.27 | 26d | 1 | 0.98mi |
| 24 Bucan St Unit A Houston, TX | 3.0 | 2.5 | 1572 | $1,999 | $1.27 | 0d | 1 | 0.98mi |
| 28 Bucan St Unit B Houston, TX | 3.0 | 2.5 | 1572 | $1,999 | $1.27 | 1d | 1 | 1.00mi |
| 28 Bucan St Unit B Houston, TX | 3.0 | 2.5 | 1572 | $1,999 | $1.27 | 26d | 1 | 1.00mi |
| 28 Bucan St Unit G Houston, TX | 3.0 | 2.5 | 1572 | $1,999 | $1.27 | 1d | 1 | 1.00mi |
| 774 Dillard St Houston, TX | 4.0 | 2.5 | 1899 | $2,405 | $1.27 | 22d | 1 | 1.03mi |
| 855 S Victory Dr Unit C Houston, TX | 3.0 | 2.5 | 1546 | $2,300 | $1.49 | 45d | 1 | 1.08mi |
| 411 E Carby Rd Houston, TX | 4.0 | 1.5 | 1806 | $1,649 | $0.91 | 24d | 1 | 1.16mi |
| 6127 W Montgomery Rd Houston, TX | 3.0 | 3.0 | 1786 | $2,000 | $1.12 | 26d | 1 | 1.23mi |
| 5342 Donovan Gardens Ln Unit 1521013P Houston, TX | 3.0 | 3.0 | 1743 | $2,985 | $1.71 | 9d | 1 | 1.30mi |
| 783 Fortune St Unit A Houston, TX | 3.0 | 2.5 | 1328 | $1,795 | $1.35 | 18d | 1 | 1.30mi |
| 774 Paul Quinn St Houston, TX | 3.0 | 3.0 | 1651 | $2,350 | $1.42 | 45d | 1 | 1.31mi |
| 714 W Tidwell Rd Houston, TX | 2.0 | 1.0 | 1296 | $1,094 | $0.84 | 45d | 1 | 1.36mi |
| 426 Stonework Sage Ln Houston, TX | 3.0 | 2.5 | 1600 | $2,650 | $1.66 | 45d | 1 | 1.39mi |
| 5722 # E Unit Beall St unit Houston, TX | 3.0 | 2.5 | 1474 | $2,011 | $1.36 | 45d | 1 | 1.39mi |
| 5720 Beall St Unit C Houston, TX | 3.0 | 2.5 | 1474 | $2,006 | $1.36 | 45d | 1 | 1.40mi |
| 6513 Knox St Houston, TX | 4.0 | 3.0 | 1773 | $2,100 | $1.18 | 45d | 1 | 1.46mi |
Listing history 28 events
-
2026-06-16days on market $199,000 Active 25 DOM
-
2026-06-15days on market $199,000 Active 24 DOM
-
2026-06-13days on market $199,000 Active 22 DOM
-
2026-06-09days on market $199,000 Active 18 DOM
-
2026-06-08days on market $199,000 Active 17 DOM
-
2026-06-07days on market $199,000 Active 16 DOM
-
2026-06-04days on market $199,000 Active 13 DOM
-
2026-06-02days on market $199,000 Active 11 DOM
-
2026-06-01days on market $199,000 Active 10 DOM
-
2026-05-31days on market $199,000 Active 9 DOM
-
2026-05-22status Active
-
2026-05-22historical
-
2026-05-22$199,000 Active
-
2020-07-20soldstatus
-
2020-07-16soldstatus Sold 609-char remark
Show marketing remark (609 chars)
The transformation came out really nice. This home was brought down to the studs and completely updated from the plumbing to the electrical and to the fine finishes that have become the product that can now be yours. From its spacious floor plan to its brand new kitchen cabinets along with attractive new countertops and brand new bathrooms. Home sits on a corner lot with a spacious back yard and best of all this home is located just seconds to highway access and minutes from Downtown with no HOA required. Don't wait schedule your showing today. Agents please read agent remarks for showing instructions.
-
2020-06-18status Pending 609-char remark
Show marketing remark (609 chars)
The transformation came out really nice. This home was brought down to the studs and completely updated from the plumbing to the electrical and to the fine finishes that have become the product that can now be yours. From its spacious floor plan to its brand new kitchen cabinets along with attractive new countertops and brand new bathrooms. Home sits on a corner lot with a spacious back yard and best of all this home is located just seconds to highway access and minutes from Downtown with no HOA required. Don't wait schedule your showing today. Agents please read agent remarks for showing instructions.
-
2020-06-09status Option Pending 609-char remark
Show marketing remark (609 chars)
The transformation came out really nice. This home was brought down to the studs and completely updated from the plumbing to the electrical and to the fine finishes that have become the product that can now be yours. From its spacious floor plan to its brand new kitchen cabinets along with attractive new countertops and brand new bathrooms. Home sits on a corner lot with a spacious back yard and best of all this home is located just seconds to highway access and minutes from Downtown with no HOA required. Don't wait schedule your showing today. Agents please read agent remarks for showing instructions.
-
2020-05-30$180,000 Active 609-char remark
Show marketing remark (609 chars)
The transformation came out really nice. This home was brought down to the studs and completely updated from the plumbing to the electrical and to the fine finishes that have become the product that can now be yours. From its spacious floor plan to its brand new kitchen cabinets along with attractive new countertops and brand new bathrooms. Home sits on a corner lot with a spacious back yard and best of all this home is located just seconds to highway access and minutes from Downtown with no HOA required. Don't wait schedule your showing today. Agents please read agent remarks for showing instructions.
-
2020-02-10soldstatus
-
2017-12-29soldstatus
-
2015-08-18soldstatus
-
2011-09-27historical
-
2011-05-17soldstatus
-
2011-04-01$65,000
-
2011-03-10soldstatus
-
2011-03-03historical
-
2011-02-16$59,900
-
2000-09-05soldstatus
ⓘ Source: listings_history table (triggers on properties + properties_extension) + one-shot
backfill from property_details.listing_events for pre-trigger history.
Tax reassessment forecast TX · Resets to sale price
- Current annual tax
- $5,177 · $431/mo
- Projected year-2 tax
- $5,177 · $431/mo
- Expected delta
- $0/yr ($0/mo · 0.0%)
ⓘ Screening estimate from a state-policy table — verify with the county assessor before closing.
Climate risk First Street
- Flood 1/10 Low FEMA zone X (unshaded) · 0% chance over 30 yrs
- Wildfire 1/10 Low
- Heat 9/10 Extreme 7 d/yr ≥109°F today · 24 d/yr by 30 yrs out
- Wind 9/10 Extreme 99% chance of damaging wind over 30 yrs
- Air quality 3/10 Moderate 3 unhealthy d/yr today · 4 by 30 yrs out
Nearby sold comps map
Loading sold comps map…
Walkable amenities ~0.75 mi
Loading nearby amenities…
Taxation est. · year 1
- Rental income
- $24,762
- − Mortgage interest
- −$11,147
- − Property taxes
- −$5,177
- − Insurance
- −$995
- − Repairs & maintenance
- −$1,981
- − Management
- −$1,981
- − Depreciation
- −$5,789
- Taxable loss
- −$2,308
- Est. tax savings @ 24.0%
- +$554
- After-tax cash flow
- $1,421/yr
For passive investors: Depreciation is non-cash, so a rental often shows a tax loss while cash-flowing — sheltering income. Rental losses are passive: they offset passive income freely, and up to $25,000/yr can offset ordinary (W-2) income if you actively participate and your MAGI is under $100k (phasing out to $0 by $150k); unused losses carry forward. On sale, claimed depreciation is recaptured at up to 25%, and gains may owe capital-gains tax (a 1031 exchange can defer both). Figures are a year-1 estimate at your 24.0% rate — not tax advice; consult a CPA.
Schools (NCES district)
- District
- Houston ISD
- NCES district ID
- 4823640
- Math proficiency
- 27% ▼ -18.00%
- Reading proficiency
- 35% ▼ -6.00%
- Median HH income
- $46,054
- Composite
- 26.63/100
- National rank
- #7173
- State rank
- #593 of 826 in TX
Livability — Houston
- Score
- 74/100
- State rank
- #184
- US rank
- #4771
Category grades
Schools grade is shown separately in the Schools card above.
Census & demographics
- Census place
- Houston, TX
- County
- Harris County · 4,702,590 people
- City population
- 3,226,434
- Metro
- Houston-The Woodlands-Sugar Land, TX
- Population (ZIP)
- 31,222
- Household income
- $42,522
- Rent vs Own
- Severe rent burden
- 1781.0
Population outlook (Harris County) Hauer SSP2
- Today (2025)
- 5,571,493 people
- By 2030
- 6,089,821 · +9.3%
- By 2040
- 7,142,806 · +28.2%
- By 2050
- 8,185,864 · +46.9%
- By 2075
- 10,574,329 · +89.8%
- By 2100
- 12,109,958 · +117.4%
Race, ethnicity, and origin ACS 2023
- Neighborhood character
- Predominantly Hispanic (86%)
- Race & ethnicity
- Hispanic / Latino 86% Two or more races 29% Black 7% White 6%
- Hispanic origin (detail)
- Mexican 61%
- Common ancestry
- Romanian 1%
- Foreign-born
- 35% · Canada
- Languages at home
- 25% English-only · Spanish 74%
Political lean MEDSL · Harris
- 2024 margin
- Lean D (+5.5) · D 52.0% · R 46.4% · Other 1.6%
- 2008→2024 swing
- +3.9pp toward D · 2008: 1.6pp · 2024: 5.5pp
- All cycles
- 2024: D+5.5 2020: D+13.3 2016: D+12.4 2012: D+0.1 2008: D+1.6
Not yet ingested
- Civics
- —
Market trends
- HPI YoY
- ▼ -79.76%
- Current HPI
- 291.7578
- Rent YoY
- —
- Metro
- Houston-The Woodlands-Sugar Land, TX
- State GDP YoY
- ▲ 3.95%
- F500 in state
- 110
Industry mix (Fortune 500 HQ in TX)
| Industry | F500 HQs | Revenue |
|---|---|---|
| Energy | 16 | $1,198B |
|
||
| Technology | 5 | $198B |
|
||
| Engineering / Construction | 4 | $72B |
|
||
| Energy Services | 3 | $60B |
|
||
| Utilities | 3 | $41B |
|
||
| Healthcare | 2 | $330B |
|
||
Price history
+232.2% since first listed18 events — show timeline
- 2026-05-22 Relisted — HARMLS
- 2026-05-22 Listed $199,000 HARMLS
- 2026-05-22 Listing Removed — HARMLS
- 2020-07-20 Sold (Public Records) — Public Records
- 2020-07-16 Sold (MLS) — HARMLS
- 2020-06-18 Pending — HARMLS
- 2020-06-09 Pending — HARMLS
- 2020-05-30 Listed $180,000 HARMLS
- 2020-02-10 Sold (Public Records) — Public Records
- 2017-12-29 Sold (Public Records) — Public Records
- 2015-08-18 Sold (Public Records) — Public Records
- 2011-09-27 Listing Removed — HARMLS
- 2011-05-17 Sold (Public Records) — Public Records
- 2011-04-01 Listed $65,000 HARMLS
- 2011-03-10 Sold (MLS) — HARMLS
- 2011-03-03 Listing Removed — HARMLS
- 2011-02-16 Listed $59,900 HARMLS
- 2000-09-05 Sold (Public Records) — Public Records
Property tax history
+3.8%/yrLatest (2025): $5,177 · -9.1% YoY. Source: county tax records.
Cash-flow waterfall
monthlySold comps — $/sqft
last 12 mo · ≤1 miLoading sold comps…