6203 Castlewood Dr · Morrow, GA
Flood risk 1/10 · Minimal
- FEMA flood zone
- X (unshaded)
- Chance of flooding over 30 yrs
- 0.0%
- Est. flood insurance / yr
- $507 – $1,088
Fire risk 1/10 · Minimal
- Est. fire insurance / yr
- $963 – $1,789
Heat risk 6/10 · Moderate
- Hot days now (above 105°F)
- 7 days/yr
- Hot days in 30 yrs
- 18 days/yr
Wind risk 6/10 · Moderate
- Chance of severe wind over 30 yrs
- 27.0%
Air-quality risk 4/10 · Minor
- Unhealthy air days now
- 4 days/yr
- Unhealthy air days in 30 yrs
- 6 days/yr
Risk factors via First Street. Map © Google.
Why this score? — see what drove the B- grade
The composite is a weighted blend of 9 inputs, each scored 0–100. Each bar is that input's sub-score; the figure is the points it added to the 100-point composite (weight × sub-score).
- Cash flow +30.0/30.0
- 1% rule +10.0/10.0
- DSCR +10.0/10.0
- ARV discount +7.5/15.0
- Livability +3.2/5.0
- Condition / age +2.5/5.0
- Rent growth +2.2/5.0
- Schools +1.3/10.0
- Appreciation +0.0/10.0
$110,000
🖨 Deal sheet (PDF) 📄 Offer letter ✓ Due diligence
Listing remarks MLS
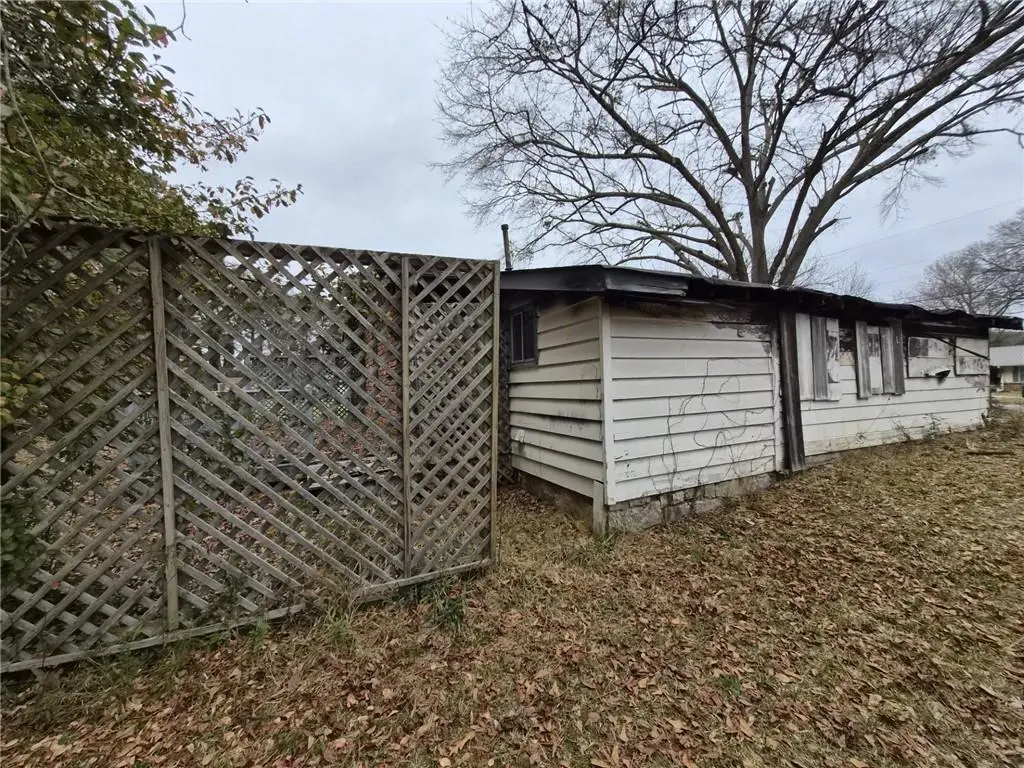
Great Opportunity in Morrow! This .2975-acre lot at 6203 Castlewood Dr offers an incredible chance to build new in a well-established residential area. While the previous home experienced a kitchen fire and most of the structure is no longer standing, this creates the perfect clean-slate opportunity for investors, builders, or homeowners looking to design a brand-new home from the ground up. Zoned RS110, the property is ideal for single-family residential construction, giving you flexibility for your future plans. Conveniently located just off Lake Harbin Rd and Maddox Rd, you'll enjoy quick access to schools, shopping, and major highways. This is your chance to bring new life to a quiet neighborhood with tons of potential. Property will be sold AS IS. For showings: No Lockbox. Enter at your own risk.
Key facts
- Zoned rs110
- Quiet neighborhood
- 2975 acre lot
Tags
Neighborhood map
What this means for you Summary
Snapshot
- This is a 3-bed/1.0-bath single-family listed at $110k.
Deal economics
- At list price, monthly cash flow is $723 ($9k/yr) — positive.
- The deal already cash-flows at list — no discount required.
- Meets the 1% rule at list price ($2k rent vs $110k).
- Recommended offer: $97k (12.0% below list) — sets the bar for market timing.
- Cap rate 14.2% vs local median 4.9% in Morrow — top-decile yield for the area; either an underpriced asset or a hidden risk that comps aren't pricing in. Stress-test before assuming the spread holds.
Location & tenants
- Location reads 65/100 on livability (#229 in GA) — a middle-class / working-renter tenant base. Strengths: cost of living A+, housing A+; Watch: amenities D, employment D, schools F.
- Clayton County (suburban): math 11% / reading 20% proficiency, ranked #155 of 174 in GA (top 89%) — low school quality limits family demand, transient renter base, plan for 1-2y turnover; 78% free/reduced lunch — lower-income household profile, screen leases tightly.
- Market conditions: Rents soft (-1.0%/yr); 173 active listings in the ZIP; 40 comparable units currently listed for rent nearby; rentals at typical pace (median 14d on market — plan ~3-4 weeks tenant-placement turnaround); 865 units permitted in Clayton County in 2024 (448 in 5+ unit buildings).
- This rent runs 40% of the median local income ($53k/yr) — at the standard rent-burdened threshold; future hikes will face affordability resistance.
Forward outlook
- Local home prices are declining (-3.0%/yr); year-one equity from $761 of loan paydown is wiped out by about $3k of value loss. Plan a longer hold.
- Clayton County population projected at +29% by 2050 — long-run rental-demand tailwind backs the buy-and-hold thesis.
- At projected returns (-3.0% appreciation + 0.0% rent growth), your $31k cash investment doubles in ~5 years — after that, you're playing with house money.
Negotiation context
- It's been on market 163 days — a 12% lower offer ($97k) is reasonable based on typical stale-listing flexibility.
- 3 sale attempts since 5y ago; this cycle's ask has dropped $10k (8%) from the opening price — seller is motivated, your offer sets the floor, not the list.
- Current owner paid $22k; list at $110k implies a 400% gain — meaningful room to come down on a strong offer.
Risks & watch-outs
- Climate carrying-cost: major wind risk, 27% chance of damaging wind over 30y; extreme-heat days projected 7→18/yr by 2055 (HVAC capex compounding) — expect insurance premiums to compound above CPI over the hold.
Questions for the listing agent
- It's been on market 163 days. Have you received any prior offers? Is the seller open to a 12% concession, seller financing, or rate buy-down credit?
- Built in 1968 — when were the roof, HVAC, electrical panel, plumbing, and water heater last replaced?
- Why hasn't it sold? Are there any deal-killer items the seller is aware of (foundation, flood, title, zoning, code violations)?
- Is there a deadline driving the sale (1031 exchange, divorce, estate, relocation)? That informs how much negotiation room exists.
- Schools are F-rated, which usually means shorter tenancies and higher turnover. Who's the typical renter profile here, and what's been the actual vacancy rate?
- Crime grade is F in this area — have there been break-ins, vandalism, or insurance claims at this property in the last 3 years? What carrier currently insures it and at what premium?
- What's the average days-on-market for RENTAL listings here right now (not sales)? A rising rental-DOM trend means longer vacancies and softer asking-rent achievability than the comps imply.
- What's the recent tenant-quality profile in this submarket — average credit score on applications, eviction rate, late-payment / NSF rate, and stable-employment percentage? A property-management company in the area should have these aggregated.
- How much new for-sale + rental construction is in the pipeline within 1–3 miles? Heavy new supply typically softens prices + rents 12–24 months out; constrained supply supports both.
Investment metrics
- 1% rule
- 1.60% ✓
- Cap rate
- 14.18%
- Cash-on-cash
- 28.18%
- DSCR
- 2.25
- GRM
- 5.2
CMA / ARV
- ARV (median comp)
- $230,000
- List price
- $110,000
- Delta
- -52.17%
- Verdict
- UNDERPRICED
- Comps
- 20 within 1.0 mi
Show comp detail 12 sales within ~0.75 mi
| Address | Dist | Beds/Ba | Sqft | Sold | Price | $/sf | Match |
|---|---|---|---|---|---|---|---|
| 2379 Prestige Sq | 0.18mi | 3/2.0 | 1,209 (-6%) | 0mo | $232,000 | $192 | 77 |
| 6155 Landover Cir | 0.09mi | 3/2.0 | 1,434 (+12%) | 4mo | $150,000 | $105 | 69 |
| 6075 Tabor Ave | 0.51mi | 3/1.5 | 1,312 (+2%) | 3mo | $201,500 | $154 | 68 |
| 6413 Maddox Rd | 0.42mi | 3/2.0 | 1,267 (-1%) | 10mo | $164,400 | $130 | 66 |
| 6071 Deerfield Ct | 0.26mi | 3/2.0 | 1,368 (+6%) | 11mo | $265,000 | $194 | 64 |
| 6200 Fieldcrest Dr | 0.18mi | 3/2.0 | 1,100 (-14%) | 2mo | $228,000 | $207 | 62 |
| 2609 Lake Harbin Rd | 0.45mi | 3/1.5 | 1,216 (-5%) | 9mo | $187,000 | $154 | 61 |
| 6268 Mount Zion Blvd | 0.54mi | 3/2.0 | 1,188 (-8%) | 12mo | $242,000 | $204 | 48 |
| 6064 Monica Dr | 0.38mi | 3/2.0 | 1,460 (+14%) | 12mo | $205,000 | $140 | 46 |
| 2539 Sparta Dr | 0.61mi | 4/2.0 (+1) | 1,390 (+8%) | 10mo | $195,000 | $140 | 40 |
| 2436 Rex Rd | 0.68mi | 3/2.0 | 1,440 (+12%) | 8mo | $240,000 | $167 | 38 |
| 2711 Teal Landing Dr | 0.56mi | 3/3.0 | 1,444 (+12%) | 11mo | $229,900 | $159 | 36 |
Match score weights: distance 35% · size 25% · config 20% · recency 20%. Top-matched comps best support the ARV.
Projected returns pro-forma
-3.0% appreciation · 0.0% rent growth · sell at horizon
- IRR
- 19.1%
- Equity multiple
- 1.75×
- Total profit
- $23,061
- Equity at exit
- $16,401
- IRR
- 25.4%
- Equity multiple
- 2.93×
- Total profit
- $59,362
- Equity at exit
- $9,511
Cash invested: $30,800 (down + closing). Projections, not guarantees.
Landlord ↔ Tenant lean methodology
- Overall (STATE)
- 90 Strongly Landlord-Friendly
- State Georgia
- 90 Strongly Landlord-Friendly · R+3
- County
- — inherits STATE
- City
- — inherits STATE
ZIP-level market 30260
- Home prices YoY
- -33.8%
- Rents YoY
- -1.0%
- Active inventory
- 173
- Price-to-rent
- 5.2×
Monthly cashflow live
- Estimated rent
- $1,758 high interval (Pro) →
- Mortgage (P&I)
- −$577
- Tax from tax record
- −$43 /mo · $518/yr
- Insurance
- −$46
- HOA
- −$0
- Vacancy / Maint / Mgmt
- −$369
- Net cashflow
- $723
Break-even live
Sensitivity live
| Price | -10% $786 | -5% $754 | +0% $723 | +5% $692 | +10% $661 |
|---|---|---|---|---|---|
| Rent | -10% $584 | -5% $654 | +0% $723 | +5% $793 | +10% $862 |
| Rate | -1.0pp $779 | -0.5pp $751 | base $723 | +0.5pp $695 | +1.0pp $666 |
UW: 25.0% down · 7.5% · 30yr · 1.5% tax · 5.0% vac · 8.0% maint · 8.0% mgmt
Financing live
Cash to close
- Down payment
- $27,500
- Closing costs
- $3,300
- Reserves months
- —
- Total cash needed
- —
Loan-product check · same deal, 3 products live
Conventional
25% down · 7.5% · 30yr
- Down + closing
- —
- Monthly P&I
- —
- Monthly cashflow
- —
- DSCR
- —
- Eligible?
- —
Personal DTI + credit; lowest rate.
DSCR
20% down · 8.5% · 30yr
- Down + closing
- —
- Monthly P&I
- —
- Monthly cashflow
- —
- DSCR
- —
- Eligible?
- —
No personal income docs; deal must DSCR.
Hard money
10% down · 12.0% · 12mo
- Down + closing
- —
- Monthly P&I
- —
- Monthly cashflow
- —
- DSCR
- —
- Eligible?
- —
Short-term bridge; refi at stabilization.
Rent comps 40 comps
| Address | Beds | Baths | Sqft | Rent | $/sqft | DOM | Units | Dist |
|---|---|---|---|---|---|---|---|---|
| 6043 Deerfield Ct Morrow, GA | 3.0 | 2.0 | 1370 | $1,741 | $1.27 | 0d | 1 | 0.31mi |
| 6010 Fairfield Dr Morrow, GA | 3.0 | 1.5 | 1246 | $1,841 | $1.48 | 4d | 1 | 0.33mi |
| 6068 Monica Dr Morrow, GA | 3.0 | 2.0 | 1210 | $1,700 | $1.40 | 23d | 1 | 0.40mi |
| 2588 Monica Way Morrow, GA | 3.0 | 2.0 | 1706 | $1,650 | $0.97 | 4d | 1 | 0.46mi |
| 6437 Maddox Rd Morrow, GA | 3.0 | 2.0 | 1694 | $1,818 | $1.07 | 25d | 1 | 0.48mi |
| 5958 Sherwood Pl Ellenwood, GA | 2.0 | 2.5 | 1468 | $995 | $0.68 | 25d | 1 | 0.48mi |
| 5958 Sherwood Pl Unit 5958 Ellenwood, GA | 2.0 | 2.5 | 1468 | $995 | $0.68 | 45d | 1 | 0.48mi |
| 2445 Rex Rd Ellenwood, GA | 1.0–3.0 | 1.0–2.0 | 1149 | $1,569 | $1.37 | 0d | 10 | 0.49mi |
| 6424 Monica Dr Morrow, GA | 3.0 | 2.0 | 1125 | $1,400 | $1.24 | 45d | 1 | 0.57mi |
| 2690 Lake Harbin Rd Morrow, GA | 3.0 | 1.0 | 980 | $1,653 | $1.69 | 0d | 1 | 0.60mi |
| 5868 Dan Dr Ellenwood, GA | 3.0 | 2.0 | 1854 | $2,300 | $1.24 | 45d | 1 | 0.68mi |
| 6560 Maddox Rd Morrow, GA | 3.0 | 2.0 | 1350 | $1,781 | $1.32 | 14d | 1 | 0.70mi |
| 2128 Baden Ct #1 Morrow, GA | 3.0 | 1.5 | 1600 | $1,450 | $0.91 | 0d | 1 | 0.74mi |
| 6572 Sleepy Hollow Ln Morrow, GA | 2.0 | 1.5 | 1152 | $1,400 | $1.22 | 25d | 1 | 0.76mi |
| 6593 Sleepy Hollow Ln Morrow, GA | 2.0 | 2.0 | 1152 | $1,550 | $1.35 | 45d | 1 | 0.77mi |
| 6596 Fleming Rd Morrow, GA | 4.0 | 2.5 | 1847 | $1,873 | $1.01 | 22d | 1 | 0.78mi |
| 6596 Fleming Rd Morrow, GA | 4.0 | 2.5 | 1847 | $1,873 | $1.01 | 6d | 1 | 0.78mi |
| 6595 Mount Zion Blvd Morrow, GA | 1.0–3.0 | 1.0–2.0 | 1175 | $1,749 | $1.49 | 0d | 11 | 0.78mi |
| 5915 Trammell Rd Morrow, GA | 3.0 | 2.5 | 1521 | $1,423 | $0.94 | 0d | 5 | 0.82mi |
| 6137 Harvard Ct Morrow, GA | 3.0 | 2.0 | 1320 | $1,531 | $1.16 | 0d | 1 | 0.84mi |
| 6234 Culver Dr Morrow, GA | 4.0 | 3.0 | 1748 | $2,350 | $1.34 | 6d | 1 | 0.85mi |
| 5731 Buck Ct Ellenwood, GA | 3.0 | 2.0 | 1242 | $1,525 | $1.23 | 14d | 1 | 0.87mi |
| 5720 Buck Ct Ellenwood, GA | 3.0 | 2.0 | 1232 | $1,850 | $1.50 | 25d | 1 | 0.89mi |
| 6511 Mill Ct Morrow, GA | 3.0 | 2.0 | 1454 | $1,881 | $1.29 | 45d | 1 | 0.89mi |
| 6655 Mount Zion Blvd Morrow, GA | 2.0–3.0 | 2.0 | 1102 | $1,499 | $1.36 | 14d | 7 | 0.89mi |
| 1932 Carla Dr Morrow, GA | 3.0 | 2.0 | 1324 | $1,730 | $1.31 | 3d | 1 | 0.91mi |
| 2260 Hammond Ct Ellenwood, GA | 3.0 | 2.0 | 1248 | $1,850 | $1.48 | 45d | 1 | 0.94mi |
| 5704 Wesson Dr Ellenwood, GA | 3.0 | 2.0 | 1480 | $1,710 | $1.16 | 45d | 1 | 0.95mi |
| 5762 Northspring Dr Ellenwood, GA | 3.0 | 2.0 | 1577 | $1,705 | $1.08 | 14d | 1 | 0.95mi |
| 2958 Stone Creek Dr Rex, GA | 3.0 | 2.0 | 1506 | $1,800 | $1.20 | 14d | 1 | 1.07mi |
| 2603 Old Rex Morrow Rd Ellenwood, GA | 4.0 | 3.0 | 1800 | $2,510 | $1.39 | 45d | 1 | 1.07mi |
| 2617 Old Rex Morrow Rd Ellenwood, GA | 4.0 | 3.0 | 1800 | $1,950 | $1.08 | 14d | 1 | 1.09mi |
| 6498 Menlo Way Rex, GA | 4.0 | 2.0 | 1246 | $1,895 | $1.52 | 25d | 1 | 1.21mi |
| 6478 Bobolink Ct Rex, GA | 4.0 | 2.0 | 1626 | $1,911 | $1.18 | 21d | 1 | 1.26mi |
| 6494 Bobolink Ct Rex, GA | 3.0 | 2.0 | 1310 | $1,630 | $1.24 | 0d | 1 | 1.27mi |
| 2866 Panther Ct Rex, GA | 3.0 | 2.0 | 1344 | $1,780 | $1.32 | 45d | 1 | 1.29mi |
| 1885 Harper Dr Morrow, GA | 1.0–2.0 | 1.0 | 1025 | $1,415 | $1.38 | 4d | 6 | 1.30mi |
| 2861 Panther Ct Rex, GA | 3.0 | 2.0 | 1296 | $1,680 | $1.30 | 3d | 1 | 1.33mi |
| 6451 Carolyn Ct Rex, GA | 3.0 | 2.0 | 1523 | $1,665 | $1.09 | 45d | 1 | 1.33mi |
| 2941 Partin Pl Ellenwood, GA | 4.0 | 2.5 | 1874 | $2,155 | $1.15 | 16d | 1 | 1.35mi |
Listing history 26 events
-
2026-06-21days on market $110,000 Active 163 DOM
-
2026-06-18days on market $110,000 Active 160 DOM
-
2026-06-17days on market $110,000 Active 159 DOM
-
2026-06-16days on market $110,000 Active 158 DOM
-
2026-06-15days on market $110,000 Active 157 DOM
-
2026-06-13days on market $110,000 Active 155 DOM
-
2026-06-09days on market $110,000 Active 151 DOM
-
2026-06-08days on market $110,000 Active 150 DOM
-
2026-06-07days on market $110,000 Active 149 DOM
-
2026-06-04days on market $110,000 Active 146 DOM
-
2026-06-03days on market $110,000 Active 145 DOM
-
2026-06-02days on market $110,000 Active 144 DOM
-
2026-06-01days on market $110,000 Active 143 DOM
-
2026-05-31days on market $110,000 Active 142 DOM
-
2026-04-29price $110,000 819-char remark
Show marketing remark (825 chars)
Great Opportunity in Morrow! This .2975-acre lot at 6203 Castlewood Dr offers an incredible chance to build new in a well-established residential area. While the previous home experienced a kitchen fire and most of the structure is no longer standing, this creates the perfect clean-slate opportunity for investors, builders, or homeowners looking to design a brand-new home from the ground up. Zoned RS110, the property is ideal for single-family residential construction, giving you flexibility for your future plans. Conveniently located just off Lake Harbin Rd and Maddox Rd, you’ll enjoy quick access to schools, shopping, and major highways. This is your chance to bring new life to a quiet neighborhood with tons of potential. Property will be sold AS IS. For showings: No Lockbox. Enter at your own risk.
-
2026-04-29price $110,000 825-char remark
Show marketing remark (825 chars)
Great Opportunity in Morrow! This .2975-acre lot at 6203 Castlewood Dr offers an incredible chance to build new in a well-established residential area. While the previous home experienced a kitchen fire and most of the structure is no longer standing, this creates the perfect clean-slate opportunity for investors, builders, or homeowners looking to design a brand-new home from the ground up. Zoned RS110, the property is ideal for single-family residential construction, giving you flexibility for your future plans. Conveniently located just off Lake Harbin Rd and Maddox Rd, you’ll enjoy quick access to schools, shopping, and major highways. This is your chance to bring new life to a quiet neighborhood with tons of potential. Property will be sold AS IS. For showings: No Lockbox. Enter at your own risk.
-
2026-01-05$120,000 New 819-char remark
Show marketing remark (825 chars)
Great Opportunity in Morrow! This .2975-acre lot at 6203 Castlewood Dr offers an incredible chance to build new in a well-established residential area. While the previous home experienced a kitchen fire and most of the structure is no longer standing, this creates the perfect clean-slate opportunity for investors, builders, or homeowners looking to design a brand-new home from the ground up. Zoned RS110, the property is ideal for single-family residential construction, giving you flexibility for your future plans. Conveniently located just off Lake Harbin Rd and Maddox Rd, you’ll enjoy quick access to schools, shopping, and major highways. This is your chance to bring new life to a quiet neighborhood with tons of potential. Property will be sold AS IS. For showings: No Lockbox. Enter at your own risk.
-
2026-01-05$120,000 Active 825-char remark
Show marketing remark (825 chars)
Great Opportunity in Morrow! This .2975-acre lot at 6203 Castlewood Dr offers an incredible chance to build new in a well-established residential area. While the previous home experienced a kitchen fire and most of the structure is no longer standing, this creates the perfect clean-slate opportunity for investors, builders, or homeowners looking to design a brand-new home from the ground up. Zoned RS110, the property is ideal for single-family residential construction, giving you flexibility for your future plans. Conveniently located just off Lake Harbin Rd and Maddox Rd, you’ll enjoy quick access to schools, shopping, and major highways. This is your chance to bring new life to a quiet neighborhood with tons of potential. Property will be sold AS IS. For showings: No Lockbox. Enter at your own risk.
-
2021-03-05soldstatus $22,000 Sold
-
2021-02-21status Under Contract
-
2021-02-19$30,900 New
-
2018-07-30soldstatus $117,000
-
1995-08-30soldstatus $51,900
-
1995-08-30soldstatus $51,900
-
1992-04-08soldstatus $50,900
-
1983-12-13soldstatus $36,700
ⓘ Source: listings_history table (triggers on properties + properties_extension) + one-shot
backfill from property_details.listing_events for pre-trigger history.
Tax reassessment forecast GA · Resets to sale price
- Current annual tax
- $518 · $43/mo
- Projected year-2 tax
- $1,012 · $84/mo
- Expected delta
- +$494/yr (+$41/mo · 95.4%)
ⓘ Screening estimate from a state-policy table — verify with the county assessor before closing.
Climate risk First Street
- Flood 1/10 Low FEMA zone X (unshaded) · 0% chance over 30 yrs
- Wildfire 1/10 Low
- Heat 6/10 Major 7 d/yr ≥105°F today · 18 d/yr by 30 yrs out
- Wind 6/10 Major 27% chance of damaging wind over 30 yrs
- Air quality 4/10 Moderate 4 unhealthy d/yr today · 6 by 30 yrs out
Nearby sold comps map
Loading sold comps map…
Walkable amenities ~0.75 mi
Loading nearby amenities…
Taxation est. · year 1
- Rental income
- $21,102
- − Mortgage interest
- −$6,162
- − Property taxes
- −$518
- − Insurance
- −$550
- − Repairs & maintenance
- −$1,688
- − Management
- −$1,688
- − Depreciation
- −$3,200
- Taxable income
- $7,296
- Est. tax owed @ 24.0%
- −$1,751
- After-tax cash flow
- $6,929/yr
For passive investors: Depreciation is non-cash, so a rental often shows a tax loss while cash-flowing — sheltering income. Rental losses are passive: they offset passive income freely, and up to $25,000/yr can offset ordinary (W-2) income if you actively participate and your MAGI is under $100k (phasing out to $0 by $150k); unused losses carry forward. On sale, claimed depreciation is recaptured at up to 25%, and gains may owe capital-gains tax (a 1031 exchange can defer both). Figures are a year-1 estimate at your 24.0% rate — not tax advice; consult a CPA.
Schools (NCES district)
- District
- Clayton County
- NCES district ID
- 1301230
- Math proficiency
- 11% ▼ -13.00%
- Reading proficiency
- 20% ▼ -9.00%
- Median HH income
- $42,266
- Composite
- 13.41/100
- National rank
- #9527
- State rank
- #155 of 174 in GA
Livability — Morrow
- Score
- 65/100
- State rank
- #229
- US rank
- #13314
Category grades
Schools grade is shown separately in the Schools card above.
Census & demographics
- County
- Clayton County · 230,153 people
- City population
- 28,693
- Metro
- Atlanta-Sandy Springs-Alpharetta, GA
- Population (ZIP)
- 28,693
- Household income
- $52,666
- Rent vs Own
- Severe rent burden
- 1956.0
Population outlook (Clayton County) Hauer SSP2
- Today (2025)
- 310,777 people
- By 2030
- 329,762 · +6.1%
- By 2040
- 368,052 · +18.4%
- By 2050
- 401,196 · +29.1%
- By 2075
- 472,488 · +52.0%
- By 2100
- 500,446 · +61.0%
Race, ethnicity, and origin ACS 2023
- Neighborhood character
- Diverse neighborhood (Simpson 0.67)
- Race & ethnicity
- Black 50% Asian 20% Hispanic / Latino 19% Two or more races 7% White 7%
- Hispanic origin (detail)
- Mexican 11% Dominican 1%
- Foreign-born
- 24% · Vietnam, Canada, South Korea
- Languages at home
- 63% English-only · Spanish 17% Vietnamese 16% Other Asian/Pacific 1%
Political lean MEDSL · Clayton
- 2024 margin
- Solid D (+69.2) · D 84.3% · R 15.1%
- 2008→2024 swing
- +2.8pp toward D · 2008: 66.4pp · 2024: 69.2pp
- All cycles
- 2024: D+69.2 2020: D+70.9 2016: D+71.9 2012: D+70.1 2008: D+66.4
Not yet ingested
- Civics
- —
Market trends
- HPI YoY
- ▼ -98.24%
- Current HPI
- 192.3741
- Rent YoY
- ▼ -1.00%
- Metro
- Atlanta-Sandy Springs-Alpharetta, GA
- State GDP YoY
- ▲ 2.66%
- F500 in state
- 28
Industry mix (Fortune 500 HQ in GA)
| Industry | F500 HQs | Revenue |
|---|---|---|
| Paper / Packaging | 2 | $29B |
|
||
| Retail | 1 | $160B |
|
||
| Transportation / Logistics | 1 | $91B |
|
||
| Airlines | 1 | $62B |
|
||
| Consumer Goods | 1 | $47B |
|
||
| Utilities | 1 | $25B |
|
||
Price history
+199.7% since first listed12 events — show timeline
- 2026-04-29 Price Changed $110,000 GAMLS
- 2026-04-29 Price Changed $110,000 FMLS
- 2026-01-05 Listed $120,000 FMLS
- 2026-01-05 Listed $120,000 GAMLS
- 2021-03-05 Sold (MLS) $22,000 GAMLS
- 2021-02-21 Pending — GAMLS
- 2021-02-19 Listed $30,900 GAMLS
- 2018-07-30 Sold (Public Records) $117,000 Public Records
- 1995-08-30 Sold (Public Records) $51,900 Public Records
- 1995-08-30 Sold (Public Records) $51,900 Public Records
- 1992-04-08 Sold (Public Records) $50,900 Public Records
- 1983-12-13 Sold (Public Records) $36,700 Public Records
Property tax history
-4.8%/yrLatest (2025): $518 · -1.2% YoY. Source: county tax records.
Cash-flow waterfall
monthlySold comps — $/sqft
last 12 mo · ≤1 miLoading sold comps…