 🏷️ Likely Rental
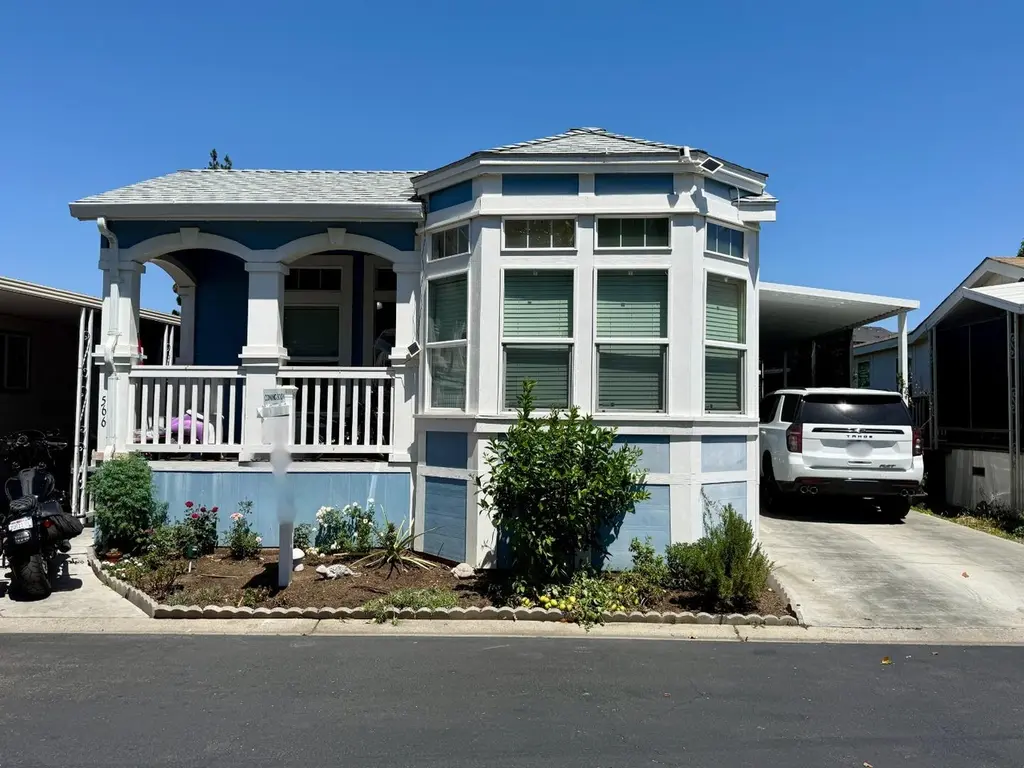
2151 Oakland Rd #566 · San Jose, CA
Flood risk 4/10 · Minor
- FEMA flood zone
- D
- Chance of flooding over 30 yrs
- 0.24%
- Est. flood insurance / yr
- $544 – $1,084
Fire risk 1/10 · Minimal
- Est. fire insurance / yr
- $659 – $1,223
Heat risk 5/10 · Moderate
- Hot days now (above 93°F)
- 7 days/yr
- Hot days in 30 yrs
- 14 days/yr
Wind risk 1/10 · Minimal
- Chance of severe wind over 30 yrs
- —
Air-quality risk 8/10 · Major
- Unhealthy air days now
- 14 days/yr
- Unhealthy air days in 30 yrs
- 16 days/yr
Risk factors via First Street. Map © Google.
Why this score? — see what drove the A- grade
The composite is a weighted blend of 9 inputs, each scored 0–100. Each bar is that input's sub-score; the figure is the points it added to the 100-point composite (weight × sub-score).
- Cash flow +30.0/30.0
- ARV discount +15.0/15.0
- 1% rule +10.0/10.0
- DSCR +10.0/10.0
- Schools +5.5/10.0
- Condition / age +4.0/5.0
- Livability +3.9/5.0
- Rent growth +3.7/5.0
- Appreciation +0.0/10.0
$229,900
🖨 Deal sheet 📄 Offer letter ✓ Due diligence
Listing remarks MLS
Beautiful and spacious 3-bedroom, 2-bathroom mobile home located in the desirable all-ages community of Casa Del Lago. Built in 2017 and offering approximately 1,455 sq. ft. of living space, this well-maintained home features several tasteful upgrades completed within the last year, including newer vinyl flooring, updated baseboards, fresh interior paint, upgraded toilets, updated sink, and newer appliances including refrigerator, washer, and dryer. The bright and open layout creates a comfortable flow throughout the home, offering plenty of space for both everyday living and entertaining. With its modern updates and spacious interior, this home is truly move-in ready. Casa Del Lago is a pet-friendly park featuring a clubhouse, swimming pool, and playground. Conveniently located near shopping centers, Great Mall, Milpitas BART Station, and major highways 680, 880, and 101. Current space rent is approximately $2,567 per month.
Key facts
- Tasteful upgrades
- Updated baseboards
- Upgraded toilets
Tags
Property features AI
Finance
- Other: Pets allowed with number restrictions; No age restrictions
- HOA & community: Community amenities include indoor half basketball court, billiard room, clubhouse, community pool, gym/exercise facility, playground, recreation room, sauna/spa/hot tub, and tennis courts
Exterior
- Parking: Assigned space number 566; Space rent $2,566
- Utilities: Public water; Public sewer; Other utilities (see remarks)
- Home design: Leased land park home
- Construction: Property ID 745005; Two section serial numbers: PER037635CAA and PER037635CAB
- Exterior features: Composition/shingle roof; Lot size information from assessor
Interior
- Bedrooms: 3 bedrooms
- Bathrooms: 2 full bathrooms
- Heating & cooling: Central forced air heating
- Interior features: Separate family room; Dining area as noted in remarks
Neighborhood map
What this means for you Summary
Snapshot
- This is a 3-bed/2.0-bath manufactured listed at $230k. Condition is rated good.
Deal economics
- At list price, monthly cash flow is $2k ($23k/yr) — positive.
- The deal already cash-flows at list — no discount required.
- Meets the 1% rule at list price ($4k rent vs $230k).
- Recommended offer: $226k (1.5% below list) — sets the bar for market timing.
- Cap rate 16.2% vs local median 1.6% in San Jose — top-decile yield for the area; either an underpriced asset or a hidden risk that comps aren't pricing in. Stress-test before assuming the spread holds.
Location & tenants
- Location reads 78/100 on livability (#68 in CA, #2,559 nationally) — a middle-class / working-renter tenant base. Strengths: amenities A+, commute A+, employment A+; Watch: crime F, cost of living F.
- Orchard Elementary (urban): math 51% / reading 60% proficiency, ranked #225 of 1,400 in CA (top 16%) — acceptable for families but not a draw, mixed tenant base, ~2y average lease.
- Market conditions: Rents rising fast (+4.7%/yr); 49 active listings in the ZIP; 33 comparable units currently listed for rent nearby; rentals leasing fast (median 2d on market — plan ~1-2 weeks tenant-placement turnaround); high-income renter base; 3,838 units permitted in Santa Clara County in 2024 (1,886 in 5+ unit buildings).
- This rent runs 31% of the median local income ($170k/yr) — at the standard rent-burdened threshold; future hikes will face affordability resistance.
Forward outlook
- Local home prices are declining (-3.0%/yr); year-one equity from $2k of loan paydown is wiped out by about $7k of value loss. Plan a longer hold.
- Santa Clara County population projected at +24% by 2050 — long-run rental-demand tailwind backs the buy-and-hold thesis.
- At projected returns (-3.0% appreciation + 4.7% rent growth), your $64k cash investment doubles in ~4 years — after that, you're playing with house money.
Negotiation context
- It's been on market 29 days — a 2% lower offer ($226k) is reasonable based on typical stale-listing flexibility.
- 2 sale attempts with the ask held roughly flat each time — persistent listings suggest the price (not the market) is what's stuck; bring a comps-based counter.
Risks & watch-outs
- Climate carrying-cost: extreme-heat days projected 7→14/yr by 2055 (HVAC capex compounding) — expect insurance premiums to compound above CPI over the hold.
Questions for the listing agent
- Is there a deadline driving the sale (1031 exchange, divorce, estate, relocation)? That informs how much negotiation room exists.
- Crime grade is F in this area — have there been break-ins, vandalism, or insurance claims at this property in the last 3 years? What carrier currently insures it and at what premium?
- What's the average days-on-market for RENTAL listings here right now (not sales)? A rising rental-DOM trend means longer vacancies and softer asking-rent achievability than the comps imply.
- What's the recent tenant-quality profile in this submarket — average credit score on applications, eviction rate, late-payment / NSF rate, and stable-employment percentage? A property-management company in the area should have these aggregated.
- How much new for-sale + rental construction is in the pipeline within 1–3 miles? Heavy new supply typically softens prices + rents 12–24 months out; constrained supply supports both.
Investment metrics
- 1% rule
- 1.92% ✓
- Cap rate
- 16.23%
- Cash-on-cash
- 35.47%
- DSCR
- 2.58
- GRM
- 4.3
CMA / ARV
- ARV (on-the-fly)
- $298,275
- Comps found
- 12
Show comp detail 12 sales within ~0.75 mi
| Address | Dist | Beds/Ba | Sqft | Sold | Price | $/sf | Match |
|---|---|---|---|---|---|---|---|
| 2151 Oakland Rd #552 | 0.02mi | 3/2.0 | 1,485 (+2%) | 3mo | $310,000 | $209 | 93 |
| 2151 Oakland #229 | 0.02mi | 4/2.0 (+1) | 1,440 (-1%) | 1mo | $344,000 | $239 | 91 |
| 2151 Oakland Rd #595 | 0.02mi | 3/2.0 | 1,410 (-3%) | 4mo | $220,000 | $156 | 91 |
| 2151 Oakland Rd Space #46 | 0.02mi | 3/2.0 | 1,536 (+6%) | 4mo | $315,000 | $205 | 86 |
| 2151 Oakland Rd #189 | 0.15mi | 3/2.0 | 1,440 (-1%) | 6mo | $320,000 | $222 | 86 |
| 2151 Oakland Rd #14 | 0.15mi | 3/2.0 | 1,440 (-1%) | 7mo | $291,500 | $202 | 85 |
| 2151 Oakland Rd #135 | 0.14mi | 2/2.0 (-1) | 1,440 (-1%) | 3mo | $310,000 | $215 | 84 |
| 2151 Oakland Rd #210 | 0.15mi | 3/2.0 | 1,516 (+4%) | 7mo | $235,000 | $155 | 80 |
| 2151 Oakland Rd #231 | 0.25mi | 3/2.0 | 1,440 (-1%) | 8mo | $260,000 | $181 | 80 |
| 2151 Oakland Rd #443 | 0.02mi | 2/2.0 (-1) | 1,344 (-8%) | 3mo | $229,900 | $171 | 79 |
| 2151 Oakland Rd #444 | 0.14mi | 2/2.0 (-1) | 1,488 (+2%) | 9mo | $200,000 | $134 | 77 |
| 2151 Oakland Rd #375 | 0.14mi | 3/2.0 | 1,630 (+12%) | 10mo | $395,000 | $242 | 65 |
Match score weights: distance 35% · size 25% · config 20% · recency 20%. Top-matched comps best support the ARV.
Projected returns pro-forma
-3.0% appreciation · 4.67% rent growth · sell at horizon
- IRR
- 33.0%
- Equity multiple
- 2.42×
- Total profit
- $91,558
- Equity at exit
- $34,279
- IRR
- 40.9%
- Equity multiple
- 5.17×
- Total profit
- $268,113
- Equity at exit
- $19,878
Cash invested: $64,372 (down + closing). Projections, not guarantees.
Landlord ↔ Tenant lean methodology
- Overall (CITY)
- 0 Strongly Tenant-Friendly
- State California
- 18 Strongly Tenant-Friendly · D+13
- County
- — inherits STATE
- City San Jose
- 0 Strongly Tenant-Friendly · D+24
ZIP-level market 95131
- Rents YoY
- 4.7%
- Active inventory
- 49
- Price-to-rent
- 4.3×
Monthly cashflow live
- Estimated rent
- $4,420 high interval (Pro) →
- Mortgage (P&I)
- −$1,206
- Tax est. 1.5%
- −$287 /mo · $3,448/yr
- Insurance
- −$96
- HOA
- −$0
- Vacancy / Maint / Mgmt
- −$928
- Net cashflow
- $1,903
Break-even live
UW: 25.0% down · 7.5% · 30yr · 1.5% tax · 5.0% vac · 8.0% maint · 8.0% mgmt
Financing live
Cash to close
- Down payment
- $57,475
- Closing costs
- $6,897
- Reserves months
- —
- Total cash needed
- —
Loan-product check · same deal, 3 products live
Conventional
25% down · 7.5% · 30yr
- Down + closing
- —
- Monthly P&I
- —
- Monthly cashflow
- —
- DSCR
- —
- Eligible?
- —
Personal DTI + credit; lowest rate.
DSCR
20% down · 8.5% · 30yr
- Down + closing
- —
- Monthly P&I
- —
- Monthly cashflow
- —
- DSCR
- —
- Eligible?
- —
No personal income docs; deal must DSCR.
Hard money
10% down · 12.0% · 12mo
- Down + closing
- —
- Monthly P&I
- —
- Monthly cashflow
- —
- DSCR
- —
- Eligible?
- —
Short-term bridge; refi at stabilization.
Rent comps 33 comps
| Address | Beds | Baths | Sqft | Rent | $/sqft | DOM | Units | Dist |
|---|---|---|---|---|---|---|---|---|
| 1141 Rock Ave San Jose, CA | 3.0 | 2.5 | 1376 | $4,295 | $3.12 | 1d | 1 | 0.28mi |
| 1799 Snell Pl Milpitas, CA | 3.0 | 3.0 | 1450 | $4,450 | $3.07 | 17d | 1 | 0.58mi |
| 69 Ede Ln Milpitas, CA | 3.0 | 3.0 | 1253 | $4,128 | $3.29 | 7d | 1 | 0.64mi |
| 1694 Starlite Dr Milpitas, CA | 4.0 | 2.5 | 1726 | $4,600 | $2.67 | 1d | 1 | 0.65mi |
| 363 Odyssey Ln Milpitas, CA | 3.0 | 4.0 | 1651 | $4,750 | $2.88 | 1d | 1 | 0.73mi |
| 23 Cedar Way Milpitas, CA | 4.0 | 2.0 | 1527 | $4,620 | $3.03 | 7d | 1 | 0.79mi |
| 1753 Capulet Dr Milpitas, CA | 2.0 | 2.0 | 1100 | $4,000 | $3.64 | 16d | 1 | 0.81mi |
| 1573 Capulet Dr Milpitas, CA | 2.0 | 2.0 | 1100 | $3,750 | $3.41 | 21d | 1 | 0.81mi |
| 2031 Trento Loop Milpitas, CA | 3.0 | 3.0 | 1709 | $4,400 | $2.57 | 7d | 1 | 0.81mi |
| 56 Lonetree Ct Milpitas, CA | 4.0 | 2.5 | 1824 | $5,000 | $2.74 | 19d | 1 | 0.81mi |
| 1067 McKay Dr San Jose, CA | 3.0 | 3.0 | 1657 | $4,800 | $2.90 | 1d | 1 | 0.83mi |
| 600 Epic Way San Jose, CA | 2.0 | 1.0–2.0 | 832 | $4,847 | $5.82 | 1d | 28 | 0.89mi |
| 379 Lundy Pl Milpitas, CA | 3.0 | 3.0 | 1618 | $4,445 | $2.75 | 7d | 1 | 0.91mi |
| 1677 Centre Pointe Dr Milpitas, CA | 3.0 | 3.0 | 1687 | $4,600 | $2.73 | 23d | 1 | 0.92mi |
| 312 Gates Dr Milpitas, CA | 1.0–2.0 | 1.0–2.0 | 891 | $4,530 | $5.08 | 1d | 14 | 0.97mi |
| 460 Montague Expy #40 Milpitas, CA | 3.0 | 2.5 | 1833 | $4,750 | $2.59 | 2d | 1 | 0.98mi |
| 1625 Delano St Unit 31A Milpitas, CA | 3.0 | 2.5 | 1458 | $4,295 | $2.95 | 1d | 1 | 0.99mi |
| 425 Navaro Way #120 San Jose, CA | 2.0 | 2.0 | 1088 | $3,750 | $3.45 | 43d | 1 | 1.00mi |
| 273 Baja Rose St Milpitas, CA | 3.0 | 2.0 | 1569 | $4,700 | $3.00 | 23d | 1 | 1.02mi |
| 650 E Capitol Ave Milpitas, CA | 1.0–2.0 | 1.0–2.0 | 1003 | $4,835 | $4.82 | 1d | 17 | 1.04mi |
| 440 Navaro Pl San Jose, CA | 2.0 | 2.0 | 1254 | $3,924 | $3.13 | 23d | 1 | 1.05mi |
| 1821 S Milpitas Blvd Milpitas, CA | 1.0–2.0 | 1.0–2.0 | 860 | $4,238 | $4.93 | 1d | 5 | 1.08mi |
| 1331 Lakeshore Cir San Jose, CA | 1.0–3.0 | 1.0–3.0 | 1017 | $4,767 | $4.69 | 1d | 28 | 1.08mi |
| 1600 Whitewood Dr San Jose, CA | 1.0–2.0 | 1.0–2.0 | 977 | $3,806 | $3.89 | 1d | 12 | 1.10mi |
| 345 Village Center Dr San Jose, CA | 2.0 | 1.0–2.0 | 877 | $4,541 | $5.17 | 1d | 19 | 1.10mi |
| 415 Camille Cir San Jose, CA | 2.0 | 2.5 | 1561 | $4,009 | $2.57 | 12d | 1 | 1.11mi |
| 373 River Oaks Cir San Jose, CA | 1.0–2.0 | 1.0–2.0 | 937 | $4,147 | $4.42 | 1d | 3 | 1.18mi |
| 1102 S Abel St Milpitas, CA | 1.0–3.0 | 1.0–2.0 | 1070 | $4,597 | $4.30 | 1d | 9 | 1.20mi |
| 2100 Beech Cir San Jose, CA | 3.0 | 3.5 | 1812 | $4,350 | $2.40 | 10d | 1 | 1.20mi |
| 1087 Bigleaf Pl #1526 San Jose, CA | 3.0 | 3.0 | 1850 | $4,180 | $2.26 | 1d | 1 | 1.23mi |
| 753 Montague Expy Milpitas, CA | 2.0 | 2.0 | 957 | $3,580 | $3.74 | 1d | 2 | 1.26mi |
| 2365 Fallingtree Dr San Jose, CA | 4.0 | 2.0 | 1234 | $4,315 | $3.50 | 11d | 1 | 1.28mi |
| 1895 N Capitol Ave San Jose, CA | 2.0 | 1.0–2.0 | 658 | $3,505 | $5.33 | 1d | 1 | 1.37mi |
Listing history 16 events
-
2026-06-18days on market $229,900 Active 29 DOM
-
2026-06-17days on market $229,900 Active 28 DOM
-
2026-06-16days on market $229,900 Active 27 DOM
-
2026-06-15days on market $229,900 Active 26 DOM
-
2026-06-13days on market $229,900 Active 24 DOM
-
2026-06-13days on market $229,900 Active 23 DOM
-
2026-06-09days on market $229,900 Active 20 DOM
-
2026-06-08days on market $229,900 Active 19 DOM
-
2026-06-07days on market $229,900 Active 18 DOM
-
2026-06-05days on market $229,900 Active 15 DOM
-
2026-06-03days on market $229,900 Active 14 DOM
-
2026-06-02days on market $229,900 Active 13 DOM
-
2026-06-01days on market $229,900 Active 12 DOM
-
2026-05-31days on market $229,900 Active 11 DOM
-
2026-05-21$229,900 Active 939-char remark
Show marketing remark (939 chars)
Beautiful and spacious 3-bedroom, 2-bathroom mobile home located in the desirable all-ages community of Casa Del Lago. Built in 2017 and offering approximately 1,455 sq. ft. of living space, this well-maintained home features several tasteful upgrades completed within the last year, including newer vinyl flooring, updated baseboards, fresh interior paint, upgraded toilets, updated sink, and newer appliances including refrigerator, washer, and dryer. The bright and open layout creates a comfortable flow throughout the home, offering plenty of space for both everyday living and entertaining. With its modern updates and spacious interior, this home is truly move-in ready. Casa Del Lago is a pet-friendly park featuring a clubhouse, swimming pool, and playground. Conveniently located near shopping centers, Great Mall, Milpitas BART Station, and major highways 680, 880, and 101. Current space rent is approximately $2,567 per month.
ⓘ Source: listings_history table (triggers on properties + properties_extension) + one-shot
backfill from property_details.listing_events for pre-trigger history.
Climate risk First Street
- Flood 4/10 Moderate FEMA zone D · 24% chance over 30 yrs
- Wildfire 1/10 Low
- Heat 5/10 Major 7 d/yr ≥93°F today · 14 d/yr by 30 yrs out
- Wind 1/10 Low
- Air quality 8/10 Severe 14 unhealthy d/yr today · 16 by 30 yrs out
Nearby sold comps map
Loading sold comps map…
Walkable amenities ~0.75 mi
Loading nearby amenities…
Taxation est. · year 1
- Rental income
- $53,038
- − Mortgage interest
- −$12,878
- − Property taxes
- −$3,448
- − Insurance
- −$1,150
- − Repairs & maintenance
- −$4,243
- − Management
- −$4,243
- − Depreciation
- −$6,688
- Taxable income
- $20,388
- Est. tax owed @ 24.0%
- −$4,893
- After-tax cash flow
- $17,941/yr
For passive investors: Depreciation is non-cash, so a rental often shows a tax loss while cash-flowing — sheltering income. Rental losses are passive: they offset passive income freely, and up to $25,000/yr can offset ordinary (W-2) income if you actively participate and your MAGI is under $100k (phasing out to $0 by $150k); unused losses carry forward. On sale, claimed depreciation is recaptured at up to 25%, and gains may owe capital-gains tax (a 1031 exchange can defer both). Figures are a year-1 estimate at your 24.0% rate — not tax advice; consult a CPA.
Condition & rehab AI · 15 photos
This move-in ready manufactured home in Casa Del Lago features updated interiors and a bright, open layout, making it an attractive option for both buyers and renters.
Value-add opportunities
- Both painting exterior — enhances curb appeal and resale value
- Both landscaping — improves curb appeal and rental value
- Resale upgrading appliances — attracts more buyers with modern features
Renovation cost estimate screening
Value-add ROI direction
- Both painting exterior — enhances curb appeal and resale value ↑
- Both landscaping — improves curb appeal and rental value ↑
- Resale upgrading appliances — attracts more buyers with modern features ↑
ⓘ Cost ranges are severity-bucket heuristics (US national rule-of-thumb). Get contractor quotes + a written scope before underwriting a rehab budget.
Schools (NCES district)
- District
- Orchard Elementary
- NCES district ID
- 0628680
- Math proficiency
- 51% ▲ 1.00%
- Reading proficiency
- 60% ▲ 5.00%
- Median HH income
- $108,165
- Composite
- 54.67/100
- National rank
- #2853
- State rank
- #225 of 1400 in CA
Livability — San Jose
- Score
- 78/100
- State rank
- #68
- US rank
- #2559
Category grades
Schools grade is shown separately in the Schools card above.
Census & demographics
- Census place
- San Jose, CA
- County
- Santa Clara County · 1,806,974 people
- City population
- 954,479
- Metro
- San Jose-Sunnyvale-Santa Clara, CA
- Population (ZIP)
- 31,179
- Household income
- $170,255
- Rent vs Own
- Severe rent burden
- 691.0
Population outlook (Santa Clara County) Hauer SSP2
- Today (2025)
- 2,179,074 people
- By 2030
- 2,301,297 · +5.6%
- By 2040
- 2,528,195 · +16.0%
- By 2050
- 2,712,135 · +24.5%
- By 2075
- 2,998,701 · +37.6%
- By 2100
- 2,931,429 · +34.5%
Race, ethnicity, and origin ACS 2023
- Neighborhood character
- Predominantly Asian (70%)
- Race & ethnicity
- Asian 70% Hispanic / Latino 16% White 10% Two or more races 9% Black 1%
- Hispanic origin (detail)
- Mexican 14%
- Common ancestry
- Italian 1%
- Foreign-born
- 57% · China, Vietnam, Canada
- Languages at home
- 31% English-only · Chinese 28% Vietnamese 11% Spanish 10%
Political lean MEDSL · Santa Clara
- 2024 margin
- Solid D (+40.0) · D 68.1% · R 28.1% · Other 3.8%
- 2008→2024 swing
- -0.9pp no change · 2008: 40.9pp · 2024: 40.0pp
- All cycles
- 2024: D+40.0 2020: D+47.4 2016: D+52.5 2012: D+42.1 2008: D+40.9
Not yet ingested
- Civics
- —
Market trends
- HPI YoY
- ▼ -1287.10%
- Current HPI
- 314.6879
- Rent YoY
- ▲ 4.67%
- Metro
- San Jose-Sunnyvale-Santa Clara, CA
- State GDP YoY
- ▲ 3.21%
- F500 in state
- 116
Industry mix (Fortune 500 HQ in CA)
| Industry | F500 HQs | Revenue |
|---|---|---|
| Technology | 27 | $1,492B |
|
||
| Financial Services | 3 | $174B |
|
||
| Retail | 3 | $44B |
|
||
| Insurance | 3 | $26B |
|
||
| Media / Entertainment | 2 | $115B |
|
||
| Pharmaceuticals / Biotech | 2 | $62B |
|
||
Price history
+0.0% since first listed2 events — show timeline
- 2026-05-21 Listed $229,900 bridgeMLS, Bay East AOR, or Contra Costa AOR
- 2026-05-21 Listed $229,900 MLSListings
Cash-flow waterfall
monthlySold comps — $/sqft
last 12 mo · ≤1 miLoading sold comps…