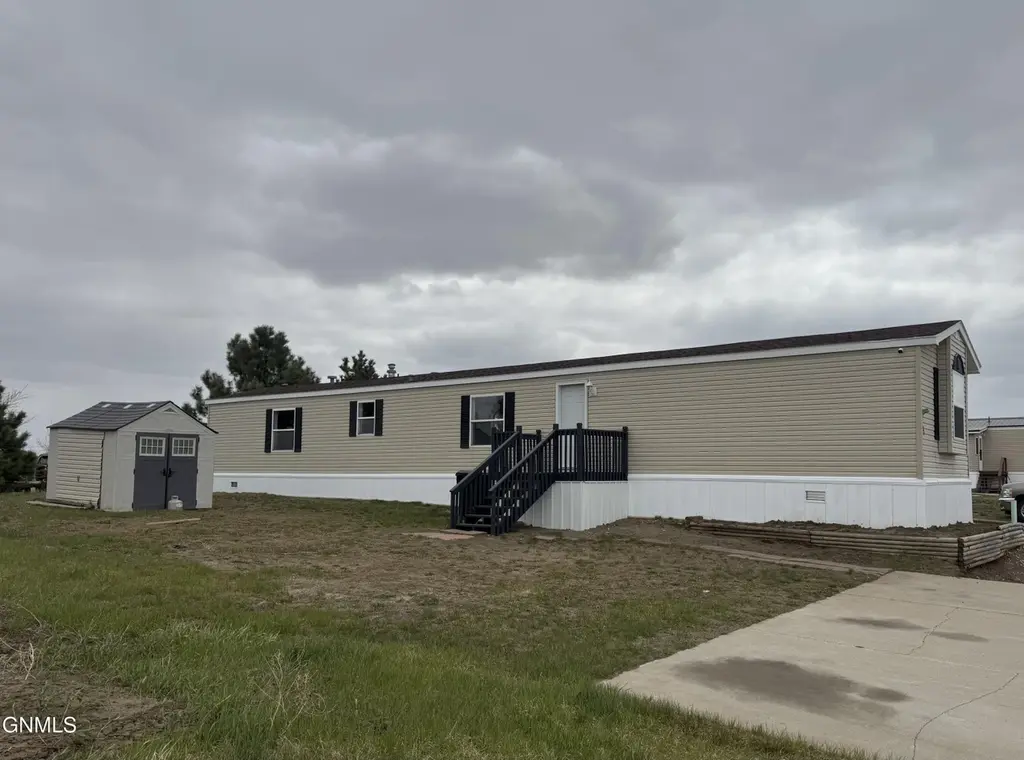
306 Hawk St · Lincoln, ND
Flood risk 1/10 · Minimal
- FEMA flood zone
- X (unshaded)
- Chance of flooding over 30 yrs
- 0.0%
- Est. flood insurance / yr
- $507 – $1,088
Fire risk 5/10 · Moderate
- Est. fire insurance / yr
- $1,289 – $2,393
Heat risk 2/10 · Minimal
- Hot days now (above 97°F)
- 7 days/yr
- Hot days in 30 yrs
- 12 days/yr
Wind risk 2/10 · Minimal
- Chance of severe wind over 30 yrs
- —
Air-quality risk 4/10 · Minor
- Unhealthy air days now
- 4 days/yr
- Unhealthy air days in 30 yrs
- 4 days/yr
Risk factors via First Street. Map © Google.
Why this score? — see what drove the B+ grade
The composite is a weighted blend of 9 inputs, each scored 0–100. Each bar is that input's sub-score; the figure is the points it added to the 100-point composite (weight × sub-score).
- Cash flow +30.0/30.0
- ARV discount +15.0/15.0
- 1% rule +10.0/10.0
- DSCR +10.0/10.0
- Schools +3.7/10.0
- Livability +3.7/5.0
- Rent growth +3.2/5.0
- Condition / age +2.5/5.0
- Appreciation +0.0/10.0
$49,900
🖨 Deal sheet 📄 Offer letter ✓ Due diligence
Key facts
- Built 1999
- Listed 44 days
Property features AI
Finance
- Financial info: Annual tax listed (reference only)
Exterior
- Parking: No parking
- Utilities: Public water; Public sewer
- Home design: Manufactured single-wide home; Residential property
- Construction: Vinyl siding
- Exterior features: No notable exterior features listed; Lot is rented
Interior
- Kitchen: Dishwasher, Range, Refrigerator
- Bathrooms: 2 full bathrooms
- Heating & cooling: Central air conditioning; Forced air heating (natural gas)
- Interior features: Dishwasher, Range, Refrigerator; No basement
Neighborhood map
What this means for you Summary
Snapshot
- This is a 3-bed/2.0-bath manufactured listed at $50k.
Deal economics
- At list price, monthly cash flow is $1k ($13k/yr) — positive.
- The deal already cash-flows at list — no discount required.
- Meets the 1% rule at list price ($2k rent vs $50k).
- Recommended offer: $48k (3.0% below list) — sets the bar for market timing.
- Cap rate 33.2% vs local median 3.8% in Lincoln — top-decile yield for the area; either an underpriced asset or a hidden risk that comps aren't pricing in. Stress-test before assuming the spread holds.
Location & tenants
- Location reads 73/100 on livability (#38 in ND) — a middle-class / working-renter tenant base. Strengths: crime A+, employment A+, housing A+; Watch: schools C-, amenities F, commute F.
- Bismarck 1 (urban): math 41% / reading 42% proficiency, ranked #25 of 53 in ND (top 47%) — families likely to look elsewhere, expect single-tenant / working-renter base with shorter leases; only 19% free/reduced lunch — higher-income household profile.
- Market conditions: Rents rising (+2.8%/yr); 258 active listings in the ZIP; 1 comparable units currently listed for rent nearby; solid renter incomes; 259 units permitted in Burleigh County in 2024 (0 in 5+ unit buildings).
Forward outlook
- Local home prices are declining (-3.0%/yr); year-one equity from $345 of loan paydown is wiped out by about $1k of value loss. Plan a longer hold.
- Burleigh County population projected at +61% by 2050 — long-run rental-demand tailwind backs the buy-and-hold thesis.
- At projected returns (-3.0% appreciation + 2.8% rent growth), your $14k cash investment doubles in ~2 years — after that, you're playing with house money.
Negotiation context
- It's been on market 45 days — a 3% lower offer ($48k) is reasonable based on typical stale-listing flexibility.
Risks & watch-outs
- Climate carrying-cost: moderate wildfire risk — expect insurance premiums to compound above CPI over the hold.
Questions for the listing agent
- It's been on market 45 days. Have you received any prior offers? Is the seller open to a 3% concession, seller financing, or rate buy-down credit?
- Is there a deadline driving the sale (1031 exchange, divorce, estate, relocation)? That informs how much negotiation room exists.
- What's the average days-on-market for RENTAL listings here right now (not sales)? A rising rental-DOM trend means longer vacancies and softer asking-rent achievability than the comps imply.
- What's the recent tenant-quality profile in this submarket — average credit score on applications, eviction rate, late-payment / NSF rate, and stable-employment percentage? A property-management company in the area should have these aggregated.
- How much new for-sale + rental construction is in the pipeline within 1–3 miles? Heavy new supply typically softens prices + rents 12–24 months out; constrained supply supports both.
Investment metrics
- 1% rule
- 3.62% ✓
- Cap rate
- 33.17%
- Cash-on-cash
- 95.98%
- DSCR
- 5.27
- GRM
- 2.3
CMA / ARV
- ARV (on-the-fly)
- $77,824
- Comps found
- 11
Show comp detail 11 sales within ~0.75 mi
| Address | Dist | Beds/Ba | Sqft | Sold | Price | $/sf | Match |
|---|---|---|---|---|---|---|---|
| 289 Partridge Ln | 0.06mi | 3/2.0 | 1,216 (0%) | 4mo | $60,000 | $49 | 94 |
| 281 Partridge Ln | 0.10mi | 3/2.0 | 1,216 (0%) | 12mo | $88,660 | $73 | 85 |
| 278 Partridge Ln | 0.12mi | 3/2.0 | 1,140 (-6%) | 2mo | $78,000 | $68 | 82 |
| 280 Partridge Ln | 0.12mi | 3/2.0 | 1,140 (-6%) | 5mo | $73,000 | $64 | 80 |
| 282 Partridge Ln | 0.10mi | 3/2.0 | 1,140 (-6%) | 6mo | $73,000 | $64 | 80 |
| 298 Hawk St | 0.03mi | 3/2.0 | 1,216 (0%) | 22mo | $75,000 | $62 | 80 |
| 215 Dove St | 0.22mi | 3/2.0 | 1,280 (+5%) | 3mo | $90,000 | $70 | 79 |
| 113 Pheasant St | 0.30mi | 3/2.0 | 1,216 (0%) | 12mo | $82,500 | $68 | 76 |
| 106 Albatross Dr | 0.25mi | 3/2.0 | 1,316 (+8%) | 13mo | $25,000 | $19 | 64 |
| 261 Robin St | 0.16mi | 2/2.0 (-1) | 1,280 (+5%) | 20mo | $56,900 | $44 | 62 |
| 7037 Snappy Ln | 0.74mi | 3/2.0 | 1,280 (+5%) | 1mo | $150,000 | $117 | 56 |
Match score weights: distance 35% · size 25% · config 20% · recency 20%. Top-matched comps best support the ARV.
Projected returns pro-forma
-3.0% appreciation · 2.81% rent growth · sell at horizon
- IRR
- 96.7%
- Equity multiple
- 5.49×
- Total profit
- $62,753
- Equity at exit
- $7,440
- IRR
- 99.3%
- Equity multiple
- 11.37×
- Total profit
- $144,911
- Equity at exit
- $4,314
Cash invested: $13,972 (down + closing). Projections, not guarantees.
Landlord ↔ Tenant lean methodology
- Overall (STATE)
- 82 Strongly Landlord-Friendly
- State North Dakota
- 82 Strongly Landlord-Friendly · R+20
- County
- — inherits STATE
- City
- — inherits STATE
ZIP-level market 58504
- Rents YoY
- 2.8%
- Active inventory
- 258
- Price-to-rent
- 2.3×
Monthly cashflow live
- Estimated rent
- $1,806 medium interval (Pro) →
- Mortgage (P&I)
- −$262
- Tax from tax record
- −$26 /mo · $318/yr
- Insurance
- −$21
- HOA
- −$0
- Vacancy / Maint / Mgmt
- −$379
- Net cashflow
- $1,118
Break-even live
UW: 25.0% down · 7.5% · 30yr · 1.5% tax · 5.0% vac · 8.0% maint · 8.0% mgmt
Financing live
Cash to close
- Down payment
- $12,475
- Closing costs
- $1,497
- Reserves months
- —
- Total cash needed
- —
Loan-product check · same deal, 3 products live
Conventional
25% down · 7.5% · 30yr
- Down + closing
- —
- Monthly P&I
- —
- Monthly cashflow
- —
- DSCR
- —
- Eligible?
- —
Personal DTI + credit; lowest rate.
DSCR
20% down · 8.5% · 30yr
- Down + closing
- —
- Monthly P&I
- —
- Monthly cashflow
- —
- DSCR
- —
- Eligible?
- —
No personal income docs; deal must DSCR.
Hard money
10% down · 12.0% · 12mo
- Down + closing
- —
- Monthly P&I
- —
- Monthly cashflow
- —
- DSCR
- —
- Eligible?
- —
Short-term bridge; refi at stabilization.
Rent comps 1 comps
| Address | Beds | Baths | Sqft | Rent | $/sqft | DOM | Units | Dist |
|---|---|---|---|---|---|---|---|---|
| 133 Marshall Loop Bismarck, ND | 4.0 | 2.0 | 1396 | $2,395 | $1.72 | 20d | 1 | 0.67mi |
Listing history 19 events
-
2026-06-19days on market $49,900 Active 45 DOM
-
2026-06-18days on market $49,900 Active 44 DOM
-
2026-06-17days on market $49,900 Active 43 DOM
-
2026-06-16days on market $49,900 Active 42 DOM
-
2026-06-15days on market $49,900 Active 41 DOM
-
2026-06-14days on market $49,900 Active 39 DOM
-
2026-06-13days on market $49,900 Active 38 DOM
-
2026-06-10days on market $49,900 Active 36 DOM
-
2026-06-09days on market $49,900 Active 35 DOM
-
2026-06-08days on market $49,900 Active 34 DOM
-
2026-06-07days on market $49,900 Active 33 DOM
-
2026-06-05days on market $49,900 Active 30 DOM
-
2026-06-03days on market $49,900 Active 29 DOM
-
2026-06-02days on market $49,900 Active 28 DOM
-
2026-06-01days on market $49,900 Active 27 DOM
-
2026-05-31days on market $49,900 Active 26 DOM
-
2026-05-30days on market $49,900 Active 25 DOM
-
2026-05-05$49,900 Active
-
2026-03-30price $51,900
ⓘ Source: listings_history table (triggers on properties + properties_extension) + one-shot
backfill from property_details.listing_events for pre-trigger history.
Tax reassessment forecast ND · Resets to sale price
- Current annual tax
- $318 · $26/mo
- Projected year-2 tax
- $489 · $41/mo
- Expected delta
- +$171/yr (+$14/mo · 53.8%)
ⓘ Screening estimate from a state-policy table — verify with the county assessor before closing.
Climate risk First Street
- Flood 1/10 Low FEMA zone X (unshaded) · 0% chance over 30 yrs
- Wildfire 5/10 Major
- Heat 2/10 Low 7 d/yr ≥97°F today · 12 d/yr by 30 yrs out
- Wind 2/10 Low
- Air quality 4/10 Moderate 4 unhealthy d/yr today · 4 by 30 yrs out
Nearby sold comps map
Loading sold comps map…
Walkable amenities ~0.75 mi
Loading nearby amenities…
Taxation est. · year 1
- Rental income
- $21,669
- − Mortgage interest
- −$2,795
- − Property taxes
- −$318
- − Insurance
- −$250
- − Repairs & maintenance
- −$1,734
- − Management
- −$1,734
- − Depreciation
- −$1,452
- Taxable income
- $13,388
- Est. tax owed @ 24.0%
- −$3,213
- After-tax cash flow
- $10,198/yr
For passive investors: Depreciation is non-cash, so a rental often shows a tax loss while cash-flowing — sheltering income. Rental losses are passive: they offset passive income freely, and up to $25,000/yr can offset ordinary (W-2) income if you actively participate and your MAGI is under $100k (phasing out to $0 by $150k); unused losses carry forward. On sale, claimed depreciation is recaptured at up to 25%, and gains may owe capital-gains tax (a 1031 exchange can defer both). Figures are a year-1 estimate at your 24.0% rate — not tax advice; consult a CPA.
Schools (NCES district)
- District
- Bismarck 1
- NCES district ID
- 3800014
- Math proficiency
- 41% ▼ -5.00%
- Reading proficiency
- 42% ▼ -6.00%
- Median HH income
- $60,649
- Composite
- 36.76/100
- National rank
- #4577
- State rank
- #25 of 53 in ND
Livability — Lincoln
- Score
- 73/100
- State rank
- #38
- US rank
- #5588
Category grades
Schools grade is shown separately in the Schools card above.
Census & demographics
- Census place
- Lincoln, ND
- County
- Burleigh County · 97,300 people
- City population
- 97,300
- Metro
- Bismarck, ND
- Population (ZIP)
- 30,212
- Household income
- $85,637
- Rent vs Own
- Severe rent burden
- 400.0
Population outlook (Burleigh County) Hauer SSP2
- Today (2025)
- 119,359 people
- By 2030
- 133,047 · +11.5%
- By 2040
- 161,545 · +35.3%
- By 2050
- 191,960 · +60.8%
- By 2075
- 274,569 · +130.0%
- By 2100
- 350,910 · +194.0%
Race, ethnicity, and origin ACS 2023
- Neighborhood character
- Predominantly White (84%)
- Race & ethnicity
- White 84% Native American 8% Two or more races 5% Hispanic / Latino 4%
- Common ancestry
- Portuguese 13% Scotch-Irish 5% Romanian 2%
- Foreign-born
- 2% · Canada
- Languages at home
- 97% English-only · Spanish 2%
Political lean MEDSL · Burleigh
- 2024 margin
- Solid R (+43.2) · D 27.5% · R 70.7% · Other 1.8%
- 2008→2024 swing
- -19.7pp toward R · 2008: -23.6pp · 2024: -43.2pp
- All cycles
- 2024: R+43.2 2020: R+40.2 2016: R+46.1 2012: R+32.1 2008: R+23.6
Not yet ingested
- Civics
- —
Market trends
- HPI YoY
- ▼ -158.70%
- Current HPI
- 210.0651
- Rent YoY
- ▲ 2.81%
- Metro
- Bismarck, ND
- State GDP YoY
- ▲ 2.09%
- F500 in state
- 2
Industry mix (Fortune 500 HQ in ND)
| Industry | F500 HQs | Revenue |
|---|---|---|
| Utilities / Construction | 1 | $6B |
|
||
Price history
-3.9% since first listed2 events — show timeline
- 2026-05-05 Listed $49,900 GNMLS
- 2026-03-30 Price Changed $51,900 GNMLS
Cash-flow waterfall
monthlySold comps — $/sqft
last 12 mo · ≤1 miLoading sold comps…