3883-SPC 45 Buchanan St · Riverside, CA
Flood risk 4/10 · Minor
- FEMA flood zone
- X (unshaded)
- Chance of flooding over 30 yrs
- 0.22%
- Est. flood insurance / yr
- $507 – $1,088
Fire risk 8/10 · Major
- Est. fire insurance / yr
- $659 – $1,223
Heat risk 7/10 · Major
- Hot days now (above 102°F)
- 7 days/yr
- Hot days in 30 yrs
- 19 days/yr
Wind risk 1/10 · Minimal
- Chance of severe wind over 30 yrs
- —
Air-quality risk 9/10 · Severe
- Unhealthy air days now
- 19 days/yr
- Unhealthy air days in 30 yrs
- 23 days/yr
Risk factors via First Street. Map © Google.
Why this score? — see what drove the C+ grade
The composite is a weighted blend of 9 inputs, each scored 0–100. Each bar is that input's sub-score; the figure is the points it added to the 100-point composite (weight × sub-score).
- Cash flow +30.0/30.0
- DSCR +10.0/10.0
- 1% rule +8.7/10.0
- Condition / age +4.0/5.0
- Rent growth +3.4/5.0
- Schools +3.4/10.0
- Livability +3.3/5.0
- ARV discount +0.0/15.0
- Appreciation +0.0/10.0
$189,000
🖨 Deal sheet (PDF) 📄 Offer letter ✓ Due diligence
Listing remarks MLS
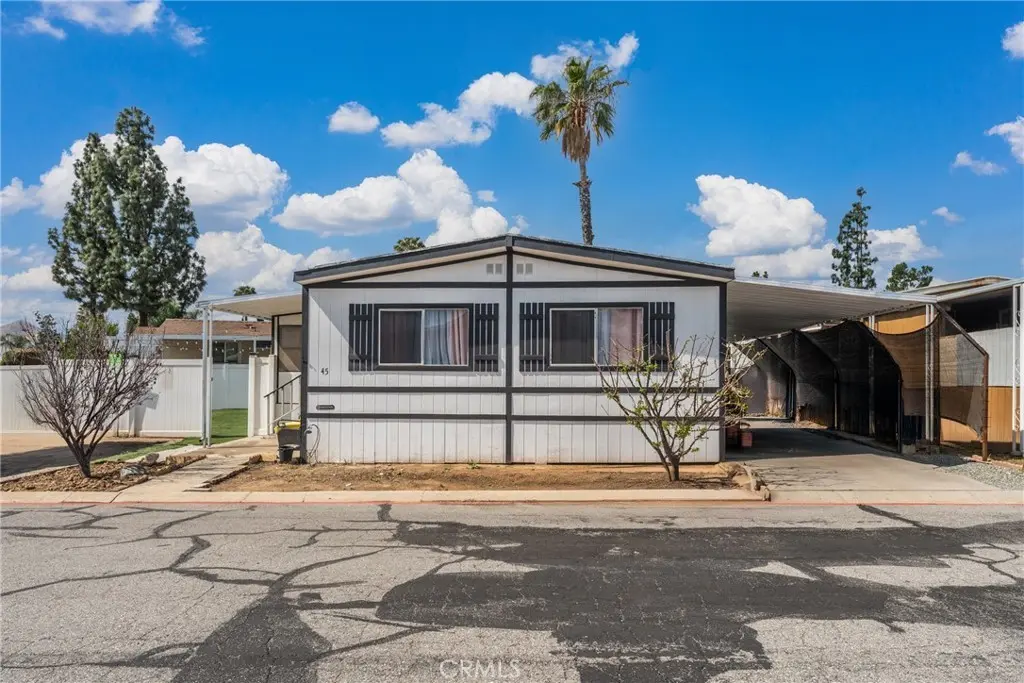
Welcome to this beautifully updated 2 bedroom 2 bathroom home located in Sierra Pines an all ages community at 3883 Buchanan Street Space 45 in Riverside. Situated on a desirable corner lot, this home offers added privacy along with a spacious front patio area that is perfect for outdoor gatherings, relaxing, or enjoying the Southern California weather. Inside, you will find a bright and inviting layout featuring updated flooring, upgraded bathrooms, and a stylish interior that is truly move in ready. The home also includes a sunroom that provides additional versatile living space, ideal for a home office, lounge, or entertainment area. The kitchen has been tastefully updated and offers a functional layout for everyday living. Washer and dryer hookups are conveniently located inside the home. Residents enjoy access to community amenities including a clubhouse, library, pool, spa, and on site laundry facility. Conveniently located on the border of Riverside and Corona, this home offers easy access to shopping, dining, and major freeways.
Key facts
- Clubhouse
- Community amenities
- Sunroom
Tags
Neighborhood map
What this means for you Summary
Snapshot
- This is a 2-bed/2.0-bath manufactured listed at $189k. Condition is rated good.
Deal economics
- At list price, monthly cash flow is $744 ($9k/yr) — positive.
- The deal already cash-flows at list — no discount required.
- Meets the 1% rule at list price ($3k rent vs $189k).
- Recommended offer: $178k (6.0% below list) — sets the bar for market timing.
- Cap rate 11.0% vs local median 3.0% in Riverside — top-decile yield for the area; either an underpriced asset or a hidden risk that comps aren't pricing in. Stress-test before assuming the spread holds.
Location & tenants
- Location reads 66/100 on livability (#337 in CA) — a middle-class / working-renter tenant base. Strengths: housing A+, employment A-, commute B+; Watch: health & safety D, crime F, cost of living F.
- Alvord Unified (urban): math 28% / reading 42% proficiency, ranked #852 of 1,400 in CA (top 61%) — families likely to look elsewhere, expect single-tenant / working-renter base with shorter leases; 63% free/reduced lunch — lower-income household profile, screen leases tightly.
- Zoned schools: Phillip M. Stokoe Elementary (604 students, 89% FRL); Ysmael Villegas Middle (1,262 students, 74% FRL); Hillcrest High (1,824 students, 73% FRL) — zoned schools average 79% FRL vs 63% district-wide (16 pts higher); higher-poverty schools than district average — tighter screening recommended.
- Market conditions: Rents rising (+3.4%/yr); 197 active listings in the ZIP; 27 comparable units currently listed for rent nearby; rentals at typical pace (median 17d on market — plan ~3-4 weeks tenant-placement turnaround); solid renter incomes; 9,195 units permitted in Riverside County in 2024 (1,512 in 5+ unit buildings).
- This rent runs 32% of the median local income ($96k/yr) — at the standard rent-burdened threshold; future hikes will face affordability resistance.
Forward outlook
- Local home prices are declining (-3.0%/yr); year-one equity from $1k of loan paydown is wiped out by about $6k of value loss. Plan a longer hold.
- Riverside County population projected at +22% by 2050 — long-run rental-demand tailwind backs the buy-and-hold thesis.
- At projected returns (-3.0% appreciation + 3.4% rent growth), your $53k cash investment doubles in ~7 years — after that, you're playing with house money.
Negotiation context
- It's been on market 76 days — a 6% lower offer ($178k) is reasonable based on typical stale-listing flexibility.
Risks & watch-outs
- Climate carrying-cost: severe wildfire risk; extreme-heat days projected 7→19/yr by 2055 (HVAC capex compounding) — expect insurance premiums to compound above CPI over the hold.
Questions for the listing agent
- It's been on market 76 days. Have you received any prior offers? Is the seller open to a 6% concession, seller financing, or rate buy-down credit?
- Built in 1976 — when were the roof, HVAC, electrical panel, plumbing, and water heater last replaced?
- Why hasn't it sold? Are there any deal-killer items the seller is aware of (foundation, flood, title, zoning, code violations)?
- Is there a deadline driving the sale (1031 exchange, divorce, estate, relocation)? That informs how much negotiation room exists.
- Crime grade is F in this area — have there been break-ins, vandalism, or insurance claims at this property in the last 3 years? What carrier currently insures it and at what premium?
- What's the average days-on-market for RENTAL listings here right now (not sales)? A rising rental-DOM trend means longer vacancies and softer asking-rent achievability than the comps imply.
- What's the recent tenant-quality profile in this submarket — average credit score on applications, eviction rate, late-payment / NSF rate, and stable-employment percentage? A property-management company in the area should have these aggregated.
- How much new for-sale + rental construction is in the pipeline within 1–3 miles? Heavy new supply typically softens prices + rents 12–24 months out; constrained supply supports both.
Investment metrics
- 1% rule
- 1.37% ✓
- Cap rate
- 11.02%
- Cash-on-cash
- 16.87%
- DSCR
- 1.75
- GRM
- 6.1
CMA / ARV
- ARV (median comp)
- $138,561
- List price
- $189,000
- Delta
- 36.40%
- Verdict
- OVERPRICED
- Comps
- 20 within 1.0 mi
Show comp detail 12 sales within ~0.75 mi
| Address | Dist | Beds/Ba | Sqft | Sold | Price | $/sf | Match |
|---|---|---|---|---|---|---|---|
| 3883 Buchanan St #65 | 0.00mi | 2/2.0 | 1,152 (-4%) | 4mo | $22,000 | $19 | 90 |
| 3500 Buchanan St #57 | 0.59mi | 2/2.0 | 1,200 (0%) | 6mo | $62,000 | $52 | 68 |
| 4000 Pierce St #284 | 0.27mi | 2/2.0 | 1,344 (+12%) | 0mo | $150,000 | $112 | 67 |
| 4000 Pierce #135 | 0.36mi | 2/2.0 | 1,344 (+12%) | 0mo | $115,000 | $86 | 63 |
| 3700 Buchanan St #131 | 0.44mi | 2/2.0 | 1,344 (+12%) | 0mo | $171,000 | $127 | 60 |
| 3700 Buchanan St #105 | 0.44mi | 2/2.0 | 1,344 (+12%) | 1mo | $86,000 | $64 | 59 |
| 3663 Buchanan #112 | 0.33mi | 3/2.0 (+1) | 1,344 (+12%) | 1mo | $169,000 | $126 | 59 |
| 3700 Buchanan St #69 | 0.44mi | 2/2.0 | 1,344 (+12%) | 6mo | $120,000 | $89 | 55 |
| 3700 Buchanan St #98 | 0.44mi | 3/2.0 (+1) | 1,344 (+12%) | 2mo | $120,000 | $89 | 53 |
| 3500 Buchanan #73 | 0.59mi | 2/2.0 | 1,344 (+12%) | 2mo | $71,111 | $53 | 51 |
| 3500 Buchanan St #230 | 0.59mi | 2/2.0 | 1,356 (+13%) | 3mo | $173,000 | $128 | 49 |
| 3500 Buchanan #103 | 0.59mi | 3/2.0 (+1) | 1,344 (+12%) | 1mo | $139,900 | $104 | 47 |
Match score weights: distance 35% · size 25% · config 20% · recency 20%. Top-matched comps best support the ARV.
Projected returns pro-forma
-3.0% appreciation · 3.41% rent growth · sell at horizon
- IRR
- 8.6%
- Equity multiple
- 1.34×
- Total profit
- $17,881
- Equity at exit
- $28,181
- IRR
- 18.1%
- Equity multiple
- 2.53×
- Total profit
- $81,203
- Equity at exit
- $16,341
Cash invested: $52,920 (down + closing). Projections, not guarantees.
Landlord ↔ Tenant lean methodology
- Overall (STATE)
- 18 Strongly Tenant-Friendly
- State California
- 18 Strongly Tenant-Friendly · D+13
- County
- — inherits STATE
- City
- — inherits STATE
ZIP-level market 92503
- Rents YoY
- 3.4%
- Active inventory
- 197
- Price-to-rent
- 6.1×
Monthly cashflow live
- Estimated rent
- $2,595 high interval (Pro) →
- Mortgage (P&I)
- −$991
- Tax est. 1.5%
- −$236 /mo · $2,835/yr
- Insurance
- −$79
- HOA
- −$0
- Vacancy / Maint / Mgmt
- −$545
- Net cashflow
- $744
Break-even live
Sensitivity live
| Price | -10% $875 | -5% $809 | +0% $744 | +5% $679 | +10% $613 |
|---|---|---|---|---|---|
| Rent | -10% $539 | -5% $642 | +0% $744 | +5% $847 | +10% $949 |
| Rate | -1.0pp $839 | -0.5pp $792 | base $744 | +0.5pp $695 | +1.0pp $645 |
UW: 25.0% down · 7.5% · 30yr · 1.5% tax · 5.0% vac · 8.0% maint · 8.0% mgmt
Financing live
Cash to close
- Down payment
- $47,250
- Closing costs
- $5,670
- Reserves months
- —
- Total cash needed
- —
Loan-product check · same deal, 3 products live
Conventional
25% down · 7.5% · 30yr
- Down + closing
- —
- Monthly P&I
- —
- Monthly cashflow
- —
- DSCR
- —
- Eligible?
- —
Personal DTI + credit; lowest rate.
DSCR
20% down · 8.5% · 30yr
- Down + closing
- —
- Monthly P&I
- —
- Monthly cashflow
- —
- DSCR
- —
- Eligible?
- —
No personal income docs; deal must DSCR.
Hard money
10% down · 12.0% · 12mo
- Down + closing
- —
- Monthly P&I
- —
- Monthly cashflow
- —
- DSCR
- —
- Eligible?
- —
Short-term bridge; refi at stabilization.
Rent comps 27 comps
| Address | Beds | Baths | Sqft | Rent | $/sqft | DOM | Units | Dist |
|---|---|---|---|---|---|---|---|---|
| 2930 Via Milano Outside Area (Inside Ca), CA | 1.0 | 2.0 | 1007 | $2,500 | $2.48 | 45d | 1 | 0.36mi |
| 3957 Pierce St Riverside, CA | 1.0–2.0 | 1.0–2.0 | 845 | $2,795 | $3.31 | 0d | 21 | 0.47mi |
| 11711 Collett Ave Riverside, CA | 1.0–3.0 | 1.0–2.0 | 1018 | $3,158 | $3.10 | 0d | 22 | 0.71mi |
| 3741 Harvill Ln Unit 4 Riverside, CA | 1.0 | 1.0 | 700 | $1,500 | $2.14 | 45d | 1 | 0.78mi |
| 4408 Ambs Dr Riverside, CA | 3.0 | 2.0 | 1470 | $3,040 | $2.07 | 45d | 1 | 0.78mi |
| 545 Hamilton Dr Corona, CA | 1.0 | 1.0 | 900 | $1,900 | $2.11 | 26d | 1 | 0.81mi |
| 11520 Magnolia Ave Riverside, CA | 1.0–3.0 | 1.0–2.0 | 902 | $2,862 | $3.17 | 0d | 7 | 0.86mi |
| 3713 Calle Curacso Riverside, CA | 3.0 | 2.5 | 1300 | $3,090 | $2.38 | 45d | 1 | 1.04mi |
| 3713 Calle Curacso Riverside, CA | 3.0 | 2.0 | 1300 | $3,090 | $2.38 | 18d | 1 | 1.04mi |
| 2365 Promenade Ave Corona, CA | 1.0–2.0 | 1.0–2.0 | 892 | $2,559 | $2.87 | 1d | 17 | 1.05mi |
| 11255 Magnolia Ave Riverside, CA | 1.0 | 1.0 | 744 | $1,850 | $2.49 | 45d | 1 | 1.18mi |
| 11207 Magnolia Ave Riverside, CA | 2.0 | 2.0 | 1200 | $2,250 | $1.88 | 26d | 1 | 1.22mi |
| 2361 Mary Helen St Unit 102 Corona, CA | 2.0 | 1.5 | 1000 | $2,395 | $2.40 | 4d | 1 | 1.24mi |
| 2235 Treehouse Ln Corona, CA | 1.0–2.0 | 1.0–2.0 | 886 | $2,779 | $3.13 | 1d | 18 | 1.25mi |
| 2341 Mary Helen St Unit 104 Corona, CA | 3.0 | 2.5 | 1000 | $2,550 | $2.55 | 45d | 1 | 1.25mi |
| 4259 Redstar Ct Riverside, CA | 3.0 | 2.0 | 1178 | $3,000 | $2.55 | 7d | 1 | 1.25mi |
| 4259 Redstar Ct Riverside, CA | 3.0 | 2.0 | 1178 | $3,000 | $2.55 | 22d | 1 | 1.25mi |
| 4259 Redstar Ct Riverside, CA | 3.0 | 2.0 | 1178 | $3,000 | $2.55 | 17d | 1 | 1.25mi |
| 4259 Redstar Ct Riverside, CA | 3.0 | 2.0 | 1178 | $3,000 | $2.55 | 26d | 1 | 1.25mi |
| 3900 Fir Tree Dr Riverside, CA | 1.0–2.0 | 1.0–2.0 | 789 | $2,695 | $3.42 | 1d | 6 | 1.31mi |
| 4655 Sierra Vista Ave Riverside, CA | 1.0–3.0 | 1.0–2.0 | 950 | $2,935 | $3.09 | 1d | 12 | 1.35mi |
| 4725 Sierra Vista Ave Riverside, CA | 1.0–2.0 | 1.0–2.0 | 785 | $2,890 | $3.68 | 1d | 9 | 1.36mi |
| 2215 Lakeside Pl Corona, CA | 2.0–3.0 | 1.0–2.0 | 1043 | $2,265 | $2.17 | 1d | 25 | 1.36mi |
| 2235 Indigo Hills Dr #6 Corona, CA | 2.0 | 2.0 | 1380 | $2,950 | $2.14 | 45d | 1 | 1.43mi |
| 3935 La Sierra Ave Riverside, CA | 1.0–2.0 | 1.0 | 630 | $2,318 | $3.68 | 0d | 13 | 1.47mi |
| 2178 Stoneridge Dr Corona, CA | 1.0–3.0 | 1.0–2.0 | 946 | $2,528 | $2.67 | 0d | 10 | 1.47mi |
| 13370 Magnolia Ave Corona, CA | 3.0 | 2.0 | 900 | $2,450 | $2.72 | 45d | 1 | 1.50mi |
Listing history 16 events
-
2026-06-21days on market $189,000 Active 76 DOM
-
2026-06-18days on market $189,000 Active 73 DOM
-
2026-06-17days on market $189,000 Active 72 DOM
-
2026-06-16days on market $189,000 Active 71 DOM
-
2026-06-15days on market $189,000 Active 70 DOM
-
2026-06-13days on market $189,000 Active 68 DOM
-
2026-06-13days on market $189,000 Active 67 DOM
-
2026-06-09days on market $189,000 Active 64 DOM
-
2026-06-08days on market $189,000 Active 63 DOM
-
2026-06-07days on market $189,000 Active 62 DOM
-
2026-06-04days on market $189,000 Active 59 DOM
-
2026-06-03days on market $189,000 Active 58 DOM
-
2026-06-02days on market $189,000 Active 57 DOM
-
2026-06-01days on market $189,000 Active 56 DOM
-
2026-05-31days on market $189,000 Active 55 DOM
-
2026-04-06$189,000 Active 1052-char remark
Show marketing remark (1052 chars)
Welcome to this beautifully updated 2 bedroom 2 bathroom home located in Sierra Pines an all ages community at 3883 Buchanan Street Space 45 in Riverside. Situated on a desirable corner lot, this home offers added privacy along with a spacious front patio area that is perfect for outdoor gatherings, relaxing, or enjoying the Southern California weather. Inside, you will find a bright and inviting layout featuring updated flooring, upgraded bathrooms, and a stylish interior that is truly move in ready. The home also includes a sunroom that provides additional versatile living space, ideal for a home office, lounge, or entertainment area. The kitchen has been tastefully updated and offers a functional layout for everyday living. Washer and dryer hookups are conveniently located inside the home. Residents enjoy access to community amenities including a clubhouse, library, pool, spa, and on site laundry facility. Conveniently located on the border of Riverside and Corona, this home offers easy access to shopping, dining, and major freeways.
ⓘ Source: listings_history table (triggers on properties + properties_extension) + one-shot
backfill from property_details.listing_events for pre-trigger history.
Climate risk First Street
- Flood 4/10 Moderate FEMA zone X (unshaded) · 22% chance over 30 yrs
- Wildfire 8/10 Severe
- Heat 7/10 Severe 7 d/yr ≥102°F today · 19 d/yr by 30 yrs out
- Wind 1/10 Low
- Air quality 9/10 Extreme 19 unhealthy d/yr today · 23 by 30 yrs out
Nearby sold comps map
Loading sold comps map…
Walkable amenities ~0.75 mi
Loading nearby amenities…
Taxation est. · year 1
- Rental income
- $31,143
- − Mortgage interest
- −$10,587
- − Property taxes
- −$2,835
- − Insurance
- −$945
- − Repairs & maintenance
- −$2,491
- − Management
- −$2,491
- − Depreciation
- −$5,498
- Taxable income
- $6,295
- Est. tax owed @ 24.0%
- −$1,511
- After-tax cash flow
- $7,419/yr
For passive investors: Depreciation is non-cash, so a rental often shows a tax loss while cash-flowing — sheltering income. Rental losses are passive: they offset passive income freely, and up to $25,000/yr can offset ordinary (W-2) income if you actively participate and your MAGI is under $100k (phasing out to $0 by $150k); unused losses carry forward. On sale, claimed depreciation is recaptured at up to 25%, and gains may owe capital-gains tax (a 1031 exchange can defer both). Figures are a year-1 estimate at your 24.0% rate — not tax advice; consult a CPA.
Condition & rehab AI · 12 photos
This beautifully updated 2-bedroom 2-bathroom home in Sierra Pines is move-in ready with modern updates and a spacious front patio area. It offers a good condition score and is ready for a new owner to make it their own.
Value-add opportunities
- Both Painting exterior siding — Enhances curb appeal and can increase both resale and rental value.
- Both Landscaping improvements — Enhances curb appeal and can increase both resale and rental value.
- Resale New flooring in bathrooms — Freshens up the bathrooms and can increase resale value.
- Resale New kitchen appliances — Modernizes the kitchen and can increase resale value.
- Both New window treatments — Enhances curb appeal and can increase both resale and rental value.
- Both New lighting fixtures — Enhances curb appeal and can increase both resale and rental value.
Renovation cost estimate screening
Value-add ROI direction
- Both Painting exterior siding — Enhances curb appeal and can increase both resale and rental value. ↑
- Both Landscaping improvements — Enhances curb appeal and can increase both resale and rental value. ↑
- Resale New flooring in bathrooms — Freshens up the bathrooms and can increase resale value. ↑
- Resale New kitchen appliances — Modernizes the kitchen and can increase resale value. ↑
- Both New window treatments — Enhances curb appeal and can increase both resale and rental value. ↑
- Both New lighting fixtures — Enhances curb appeal and can increase both resale and rental value. ↑
ⓘ Cost ranges are severity-bucket heuristics (US national rule-of-thumb). Get contractor quotes + a written scope before underwriting a rehab budget.
Schools (NCES district)
- District
- Alvord Unified
- NCES district ID
- 0602430
- Math proficiency
- 28% ▲ 1.00%
- Reading proficiency
- 42% ▲ 2.00%
- Median HH income
- $58,965
- Composite
- 33.81/100
- National rank
- #10383
- State rank
- #852 of 1400 in CA
Livability — Riverside
- Score
- 66/100
- State rank
- #337
- US rank
- #11613
Category grades
Schools grade is shown separately in the Schools card above.
Census & demographics
- Census place
- Riverside, CA
- County
- Riverside County · 2,287,001 people
- City population
- 367,890
- Metro
- Riverside-San Bernardino-Ontario, CA
- Population (ZIP)
- 88,395
- Household income
- $96,268
- Rent vs Own
- Severe rent burden
- 2337.0
Population outlook (Riverside County) Hauer SSP2
- Today (2025)
- 2,664,475 people
- By 2030
- 2,802,692 · +5.2%
- By 2040
- 3,050,904 · +14.5%
- By 2050
- 3,256,783 · +22.2%
- By 2075
- 3,655,058 · +37.2%
- By 2100
- 3,766,594 · +41.4%
Race, ethnicity, and origin ACS 2023
- Neighborhood character
- Diverse neighborhood (Simpson 0.57)
- Race & ethnicity
- Hispanic / Latino 61% White 24% Two or more races 15% Asian 8% Black 4%
- Hispanic origin (detail)
- Mexican 52%
- Common ancestry
- Lithuanian 1% Italian 1% Slovak 1%
- Foreign-born
- 27% · Canada, Vietnam, South Korea
- Languages at home
- 44% English-only · Spanish 45% Other Indo-European 2% Tagalog/Filipino 2%
Political lean MEDSL · Riverside
- 2024 margin
- Toss-up / Even · D 48.0% · R 49.3% · Other 2.6%
- 2008→2024 swing
- -3.6pp toward R · 2008: 2.3pp · 2024: -1.3pp
- All cycles
- 2024: R+1.3 2020: D+8.0 2016: D+4.3 2012: R+0.4 2008: D+2.3
Not yet ingested
- Civics
- —
Market trends
- HPI YoY
- ▼ -414.52%
- Current HPI
- 393.407
- Rent YoY
- ▲ 3.41%
- Metro
- Riverside-San Bernardino-Ontario, CA
- State GDP YoY
- ▲ 3.21%
- F500 in state
- 116
Industry mix (Fortune 500 HQ in CA)
| Industry | F500 HQs | Revenue |
|---|---|---|
| Technology | 27 | $1,492B |
|
||
| Financial Services | 3 | $174B |
|
||
| Retail | 3 | $44B |
|
||
| Insurance | 3 | $26B |
|
||
| Media / Entertainment | 2 | $115B |
|
||
| Pharmaceuticals / Biotech | 2 | $62B |
|
||
Price history
1 event — show timeline
- 2026-04-06 Listed $189,000 CRMLS
Cash-flow waterfall
monthlySold comps — $/sqft
last 12 mo · ≤1 miLoading sold comps…