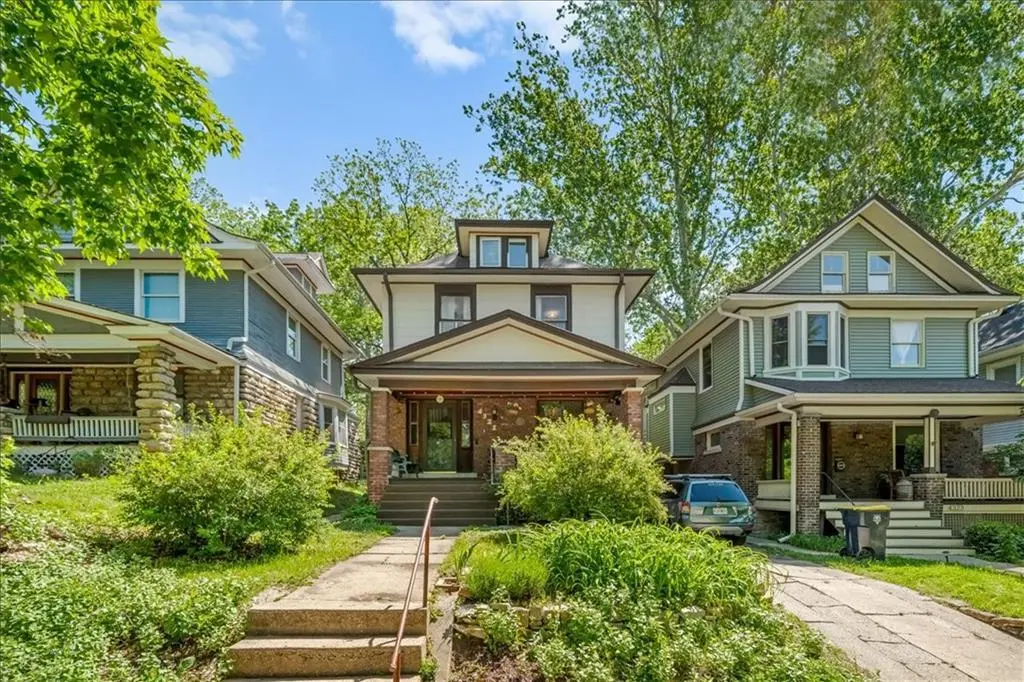
4321 Campbell St · Kansas City, MO
Flood risk 1/10 · Minimal
- FEMA flood zone
- X (unshaded)
- Chance of flooding over 30 yrs
- 0.0%
- Est. flood insurance / yr
- $473 – $860
Fire risk 1/10 · Minimal
- Est. fire insurance / yr
- $1,054 – $1,958
Heat risk 4/10 · Minor
- Hot days now (above 106°F)
- 7 days/yr
- Hot days in 30 yrs
- 17 days/yr
Wind risk 2/10 · Minimal
- Chance of severe wind over 30 yrs
- —
Air-quality risk 3/10 · Minor
- Unhealthy air days now
- 2 days/yr
- Unhealthy air days in 30 yrs
- 4 days/yr
Risk factors via First Street. Map © Google.
Why this score? — see what drove the D+ grade
The composite is a weighted blend of 9 inputs, each scored 0–100. Each bar is that input's sub-score; the figure is the points it added to the 100-point composite (weight × sub-score).
- ARV discount +15.0/15.0
- Cash flow +12.9/30.0
- DSCR +3.9/10.0
- Livability +3.9/5.0
- Rent growth +3.5/5.0
- 1% rule +3.0/10.0
- Condition / age +2.5/5.0
- Schools +1.5/10.0
- Appreciation +0.0/10.0
$265,000
🖨 Deal sheet (PDF) 📄 Offer letter ✓ Due diligence
Listing remarks MLS
Charming and updated 4-bedroom, 1.5-bath shirtwaist home offering 1,546 sq ft in the heart of South Hyde Park! Full of character, this classic property showcases the beautiful woodwork and architectural details that Hyde Park homes are known for, along with a welcoming front brick porch—perfect for morning coffee or relaxing evenings in this vibrant neighborhood. Inside, you’ll find a spacious layout filled with natural light and plenty of room to make it your own. The home has seen meaningful updates, including a newly expanded and renovated kitchen designed for both everyday living and entertaining, along with a new bathroom on the main floor for added convenience. Additional improvements include fresh paint in several rooms. Step outside to enjoy the brand-new deck and backyard fencing—ideal for relaxing or hosting gatherings. The exterior has also been enhanced with new gutters and thoughtful front yard landscaping, featuring a rock wall and low-maintenance ground cover that adds to the home’s curb appeal. Located in one of Kansas City’s most beloved historic communities, you’ll enjoy tree-lined streets, a strong sense of community, and unbeatable proximity to downtown, the Plaza, restaurants, parks, and more. Whether you’re looking for your next home or an investment opportunity, this South Hyde Park gem offers timeless charm, thoughtful updates, and an unbeatable location!
Key facts
- 4,578 sq ft lot
- Garage
- Built 1908
Neighborhood map
What this means for you Summary
Snapshot
- This is a 4-bed/2.0-bath single-family listed at $265k.
Deal economics
- At list price, monthly cash flow is $-18 ($-214/yr) — negative.
- To cash-flow at today's rent, offer at most $262k (1.2% below list).
- To meet the 1% rule (rent ≥ 1% of price), the offer needs to be $212k (19.8% below list).
- Recommended offer: $212k (19.8% below list) — sets the bar for 1% rule.
- Cap rate 6.2% vs local median 3.9% in Kansas City — top-decile yield for the area; either an underpriced asset or a hidden risk that comps aren't pricing in. Stress-test before assuming the spread holds.
Location & tenants
- Location reads 78/100 on livability (#28 in MO, #2,671 nationally) — a middle-class / working-renter tenant base. Strengths: amenities A+, commute A+, cost of living A+; Watch: crime F.
- Kansas City 33 (urban): math 12% / reading 24% proficiency, ranked #308 of 324 in MO (top 95%) — low school quality limits family demand, transient renter base, plan for 1-2y turnover; 75% free/reduced lunch — lower-income household profile, screen leases tightly.
- Zoned schools: Ac Prep Elementary (math 12% / reading 27%, grade F, #941 of 1,115 statewide, top 86%, 341 students, 99% FRL); Central Middle School (math 0% / reading 9%, grade F, #388 of 391 statewide, top 99%, 428 students, 99% FRL); Southeast High School (math 2% / reading 12%, grade F, #512 of 521 statewide, top 99%, 487 students, 99% FRL) — zoned schools average 99% FRL vs 75% district-wide (24 pts higher); higher-poverty schools than district average — tighter screening recommended.
- Market conditions: Rents rising (+4.0%/yr); tight market (median 1 DOM); 126 active listings in the ZIP; 40 comparable units currently listed for rent nearby; rentals at typical pace (median 17d on market — plan ~3-4 weeks tenant-placement turnaround); 4,002 units permitted in Jackson County in 2024 (2,271 in 5+ unit buildings).
- This rent runs 40% of the median local income ($63k/yr) — at the standard rent-burdened threshold; future hikes will face affordability resistance.
Forward outlook
- Local home prices are declining (-3.0%/yr); year-one equity from $2k of loan paydown is wiped out by about $8k of value loss. Plan a longer hold.
- Jackson County population projected at +4% by 2050 — modest demand growth; plan on rents tracking national, not racing it.
Negotiation context
- Only 3 days on market — expect competitive offers; lowballing is unlikely to land.
Risks & watch-outs
- Watch-outs: built in 1908 — expect roof / HVAC / electrical / plumbing capex.
Questions for the listing agent
- What do current leases actually rent for vs. the listed asking? Can we see a recent rent roll and the last 12 months of T-12 income?
- Built in 1908 — when were the roof, HVAC, electrical panel, plumbing, and water heater last replaced?
- Is there a deadline driving the sale (1031 exchange, divorce, estate, relocation)? That informs how much negotiation room exists.
- Crime grade is F in this area — have there been break-ins, vandalism, or insurance claims at this property in the last 3 years? What carrier currently insures it and at what premium?
- The area grade is low — what's the realistic commute time and amenity access for the typical tenant pool here? Any planned neighborhood developments (good or bad) we should know about?
- What's the average days-on-market for RENTAL listings here right now (not sales)? A rising rental-DOM trend means longer vacancies and softer asking-rent achievability than the comps imply.
- What's the recent tenant-quality profile in this submarket — average credit score on applications, eviction rate, late-payment / NSF rate, and stable-employment percentage? A property-management company in the area should have these aggregated.
- How much new for-sale + rental construction is in the pipeline within 1–3 miles? Heavy new supply typically softens prices + rents 12–24 months out; constrained supply supports both.
Investment metrics
- 1% rule
- 0.80% ✗
- Cap rate
- 6.21%
- Cash-on-cash
- -0.29%
- DSCR
- 0.99
- GRM
- 10.4
CMA / ARV
- ARV (median comp)
- $320,030
- List price
- $265,000
- Delta
- -17.20%
- Verdict
- UNDERPRICED
- Comps
- 20 within 1.0 mi
Show comp detail 12 sales within ~0.75 mi
| Address | Dist | Beds/Ba | Sqft | Sold | Price | $/sf | Match |
|---|---|---|---|---|---|---|---|
| 4239 Tracy Ave | 0.27mi | 3/2.5 (-1) | 1,602 (+4%) | 1mo | $425,000 | $265 | 74 |
| 4423 Forest Ave | 0.23mi | 4/2.0 | 1,407 (-9%) | 3mo | $285,000 | $203 | 72 |
| 4102 Charlotte St | 0.30mi | 3/2.5 (-1) | 1,622 (+5%) | 1mo | $189,000 | $117 | 70 |
| 4423 Flora Ave | 0.46mi | 4/2.0 | 1,636 (+6%) | 1mo | $140,000 | $86 | 68 |
| 4214 Campbell St | 0.14mi | 3/2.0 (-1) | 1,756 (+14%) | 2mo | $325,000 | $185 | 64 |
| 4109 Charlotte St | 0.29mi | 4/1.5 | 1,700 (+10%) | 8mo | $285,000 | $168 | 61 |
| 3920 Paseo Blvd | 0.60mi | 4/1.5 | 1,630 (+5%) | 2mo | $190,000 | $117 | 60 |
| 619 E 42nd St | 0.23mi | 3/1.5 (-1) | 1,376 (-11%) | 5mo | $250,000 | $182 | 60 |
| 3915 Charlotte St | 0.52mi | 3/1.5 (-1) | 1,624 (+5%) | 3mo | $338,000 | $208 | 58 |
| 304 E 43rd St | 0.43mi | 3/2.5 (-1) | 1,680 (+9%) | 2mo | $375,000 | $223 | 56 |
| 4142 Locust St | 0.39mi | 3/2.0 (-1) | 1,752 (+13%) | 1mo | $339,000 | $193 | 54 |
| 4028 Mcgee St | 0.56mi | 4/2.5 | 1,703 (+10%) | 9mo | $355,000 | $208 | 47 |
Match score weights: distance 35% · size 25% · config 20% · recency 20%. Top-matched comps best support the ARV.
Projected returns pro-forma
-3.0% appreciation · 3.95% rent growth · sell at horizon
- IRR
- -15.8%
- Equity multiple
- 0.43×
- Total profit
- $-42,077
- Equity at exit
- $39,512
- IRR
- -6.0%
- Equity multiple
- 0.60×
- Total profit
- $-29,730
- Equity at exit
- $22,912
Cash invested: $74,200 (down + closing). Projections, not guarantees.
Landlord ↔ Tenant lean methodology
- Overall (STATE)
- 81 Strongly Landlord-Friendly
- State Missouri
- 81 Strongly Landlord-Friendly · R+10
- County
- — inherits STATE
- City
- — inherits STATE
ZIP-level market 64110
- Rents YoY
- 4.0%
- Median DOM (109 sales)
- 1 d
- Active inventory
- 126
- Price-to-rent
- 10.4×
Monthly cashflow live
- Estimated rent
- $2,125 high interval (Pro) →
- Mortgage (P&I)
- −$1,390
- Tax from tax record
- −$196 /mo · $2,356/yr
- Insurance
- −$110
- HOA
- −$0
- Vacancy / Maint / Mgmt
- −$446
- Net cashflow
- $-18
Break-even live
Sensitivity live
| Price | -10% $132 | -5% $57 | +0% $-18 | +5% $-93 | +10% $-168 |
|---|---|---|---|---|---|
| Rent | -10% $-186 | -5% $-102 | +0% $-18 | +5% $66 | +10% $150 |
| Rate | -1.0pp $116 | -0.5pp $50 | base $-18 | +0.5pp $-86 | +1.0pp $-156 |
UW: 25.0% down · 7.5% · 30yr · 1.5% tax · 5.0% vac · 8.0% maint · 8.0% mgmt
Financing live
Cash to close
- Down payment
- $66,250
- Closing costs
- $7,950
- Reserves months
- —
- Total cash needed
- —
Loan-product check · same deal, 3 products live
Conventional
25% down · 7.5% · 30yr
- Down + closing
- —
- Monthly P&I
- —
- Monthly cashflow
- —
- DSCR
- —
- Eligible?
- —
Personal DTI + credit; lowest rate.
DSCR
20% down · 8.5% · 30yr
- Down + closing
- —
- Monthly P&I
- —
- Monthly cashflow
- —
- DSCR
- —
- Eligible?
- —
No personal income docs; deal must DSCR.
Hard money
10% down · 12.0% · 12mo
- Down + closing
- —
- Monthly P&I
- —
- Monthly cashflow
- —
- DSCR
- —
- Eligible?
- —
Short-term bridge; refi at stabilization.
Rent comps 40 comps
| Address | Beds | Baths | Sqft | Rent | $/sqft | DOM | Units | Dist |
|---|---|---|---|---|---|---|---|---|
| 4220 Harrison St Unit 1S Kansas City, MO | 3.0 | 2.0 | 1200 | $1,795 | $1.50 | 9d | 1 | 0.15mi |
| 4232 Virginia Ave Unit 3 Kansas City, MO | 3.0 | 1.0 | 1296 | $1,100 | $0.85 | 14d | 1 | 0.33mi |
| 4228 Virginia Ave Kansas City, MO | 3.0 | 1.0 | 1200 | $1,250 | $1.04 | 12d | 1 | 0.33mi |
| 4031 Campbell St Kansas City, MO | 4.0 | 1.5 | 2074 | $2,500 | $1.21 | 18d | 1 | 0.37mi |
| 4610 Forest Ave Kansas City, MO | 3.0 | 2.0 | 1365 | $2,450 | $1.79 | 45d | 1 | 0.38mi |
| 4138 Locust St Kansas City, MO | 4.0 | 2.0 | 1763 | $2,600 | $1.47 | 9d | 1 | 0.39mi |
| 404 E 41st St Kansas City, MO | 4.0 | 3.0 | 1711 | $2,650 | $1.55 | 22d | 1 | 0.48mi |
| 4515 Walnut St Kansas City, MO | 1.0–3.0 | 1.0–2.5 | 1235 | $3,075 | $2.49 | 0d | 13 | 0.58mi |
| 4219 Woodland Ave Kansas City, MO | 4.0 | 2.0 | 1566 | $1,900 | $1.21 | 4d | 1 | 0.65mi |
| 4211 Woodland Ave Kansas City, MO | 4.0 | 2.5 | 1926 | $2,010 | $1.04 | 18d | 1 | 0.66mi |
| 4800 Oak St Kansas City, MO | 1.0–3.0 | 1.0–2.0 | 967 | $2,604 | $2.69 | 0d | 17 | 0.68mi |
| 4434 Mill Creek Pkwy Kansas City, MO | 3.0 | 2.0 | 1196 | $1,950 | $1.63 | 45d | 1 | 0.78mi |
| 3830 Warwick Blvd Unit 1S Kansas City, MO | 3.0 | 2.0 | 1500 | $1,600 | $1.07 | 16d | 1 | 0.79mi |
| 4112 Park Ave Kansas City, MO | 4.0 | 2.0 | 1700 | $1,800 | $1.06 | 16d | 1 | 0.97mi |
| 551 W 44th St Kansas City, MO | 1.0–3.0 | 1.0–3.5 | 1293 | $4,827 | $3.73 | 0d | 12 | 0.97mi |
| 5017 Grand Ave Kansas City, MO | 4.0 | 4.5 | 2000 | $4,600 | $2.30 | 23d | 1 | 0.98mi |
| 4511 Park Ave Kansas City, MO | 4.0 | 2.5 | 1915 | $1,982 | $1.03 | 25d | 1 | 0.98mi |
| 4910 Michigan Ave Kansas City, MO | 3.0 | 1.5 | 1199 | $1,400 | $1.17 | 9d | 1 | 0.98mi |
| 4014 Park Ave Kansas City, MO | 3.0 | 2.0 | 1271 | $1,273 | $1.00 | 45d | 1 | 1.01mi |
| 4415 Jefferson St #101 Kansas City, MO | 3.0 | 2.0 | 1304 | $2,125 | $1.63 | 45d | 1 | 1.03mi |
| 3609 Wayne Ave Kansas City, MO | 3.0 | 1.5 | 1118 | $1,900 | $1.70 | 25d | 1 | 1.05mi |
| 610 W 46th St Kansas City, MO | 3.0 | 1.0–3.5 | 1824 | $2,600 | $1.43 | 4d | 3 | 1.05mi |
| 4107 Olive St Kansas City, MO | 3.0 | 1.5 | 1271 | $1,578 | $1.24 | 9d | 1 | 1.06mi |
| 5122 Paseo Blvd Kansas City, MO | 3.0 | 1.0 | 1573 | $1,595 | $1.01 | 12d | 1 | 1.07mi |
| 1330 Rockhurst Rd Kansas City, MO | 4.0 | 2.0 | 1984 | $2,500 | $1.26 | 45d | 1 | 1.09mi |
| 4901 Wornall Rd Kansas City, MO | 1.0–3.0 | 1.0–3.0 | 1525 | $3,195 | $2.10 | 16d | 1 | 1.11mi |
| 520 E Armour Blvd Kansas City, MO | 3.0 | 1.0–2.0 | 882 | $2,575 | $2.92 | 0d | 22 | 1.12mi |
| 520 E Armour Blvd Kansas City, MO | 3.0 | 1.0–2.0 | 782 | $1,970 | $2.52 | 18d | 19 | 1.12mi |
| 760 W 46th St Kansas City, MO | 1.0–3.0 | 1.0–2.0 | 1342 | $3,140 | $2.34 | 16d | 1 | 1.14mi |
| 5125 Walnut St Kansas City, MO | 3.0 | 3.0 | 1400 | $2,690 | $1.92 | 0d | 1 | 1.14mi |
| 5115 Woodland Ave Kansas City, MO | 4.0 | 1.0 | 1136 | $1,700 | $1.50 | 45d | 1 | 1.17mi |
| 4018 Prospect Ave Kansas City, MO | 4.0 | 1.5 | 1900 | $1,695 | $0.89 | 45d | 1 | 1.18mi |
| 4445 Madison Ave Kansas City, MO | 1.0–3.0 | 1.0–2.0 | 978 | $2,472 | $2.53 | 0d | 18 | 1.18mi |
| 4544 Summit St Kansas City, MO | 3.0 | 2.0 | 1187 | $2,195 | $1.85 | 45d | 1 | 1.18mi |
| 3902 Wabash Ave Kansas City, MO | 4.0 | 2.0 | 1400 | $1,850 | $1.32 | 45d | 1 | 1.19mi |
| 3333 Gillham Rd Kansas City, MO | 4.0 | 2.0 | 1500 | $2,000 | $1.33 | 16d | 1 | 1.20mi |
| 641 W 39th Ter Kansas City, MO | 3.0 | 2.5 | 2187 | $2,550 | $1.17 | 0d | 1 | 1.21mi |
| 3314 Tracy Ave Unit B Kansas City, MO | 3.0 | 1.0 | 1100 | $947 | $0.86 | 23d | 1 | 1.29mi |
| 3314 Tracy Ave Kansas City, MO | 3.0 | 1.0 | 1100 | $947 | $0.86 | 9d | 1 | 1.29mi |
| 5346 Harrison St Kansas City, MO | 3.0 | 1.0 | 1580 | $1,695 | $1.07 | 18d | 1 | 1.30mi |
Listing history 6 events
-
2026-05-11status Pending 1443-char remark
Show marketing remark (1443 chars)
Charming and updated 4-bedroom, 1.5-bath shirtwaist home offering 1,546 sq ft in the heart of South Hyde Park! Full of character, this classic property showcases the beautiful woodwork and architectural details that Hyde Park homes are known for, along with a welcoming front brick porch—perfect for morning coffee or relaxing evenings in this vibrant neighborhood. Inside, you’ll find a spacious layout filled with natural light and plenty of room to make it your own. The home has seen meaningful updates, including a newly expanded and renovated kitchen designed for both everyday living and entertaining, along with a new bathroom on the main floor for added convenience. Additional improvements include fresh paint in several rooms. Step outside to enjoy the brand-new deck and backyard fencing—ideal for relaxing or hosting gatherings. The exterior has also been enhanced with new gutters and thoughtful front yard landscaping, featuring a rock wall and low-maintenance ground cover that adds to the home’s curb appeal. Located in one of Kansas City’s most beloved historic communities, you’ll enjoy tree-lined streets, a strong sense of community, and unbeatable proximity to downtown, the Plaza, restaurants, parks, and more. Whether you’re looking for your next home or an investment opportunity, this South Hyde Park gem offers timeless charm, thoughtful updates, and an unbeatable location!
-
2026-05-08$265,000 Active 1443-char remark
Show marketing remark (1443 chars)
Charming and updated 4-bedroom, 1.5-bath shirtwaist home offering 1,546 sq ft in the heart of South Hyde Park! Full of character, this classic property showcases the beautiful woodwork and architectural details that Hyde Park homes are known for, along with a welcoming front brick porch—perfect for morning coffee or relaxing evenings in this vibrant neighborhood. Inside, you’ll find a spacious layout filled with natural light and plenty of room to make it your own. The home has seen meaningful updates, including a newly expanded and renovated kitchen designed for both everyday living and entertaining, along with a new bathroom on the main floor for added convenience. Additional improvements include fresh paint in several rooms. Step outside to enjoy the brand-new deck and backyard fencing—ideal for relaxing or hosting gatherings. The exterior has also been enhanced with new gutters and thoughtful front yard landscaping, featuring a rock wall and low-maintenance ground cover that adds to the home’s curb appeal. Located in one of Kansas City’s most beloved historic communities, you’ll enjoy tree-lined streets, a strong sense of community, and unbeatable proximity to downtown, the Plaza, restaurants, parks, and more. Whether you’re looking for your next home or an investment opportunity, this South Hyde Park gem offers timeless charm, thoughtful updates, and an unbeatable location!
-
2026-04-14historical $265,000 1443-char remark
Show marketing remark (1443 chars)
Charming and updated 4-bedroom, 1.5-bath shirtwaist home offering 1,546 sq ft in the heart of South Hyde Park! Full of character, this classic property showcases the beautiful woodwork and architectural details that Hyde Park homes are known for, along with a welcoming front brick porch—perfect for morning coffee or relaxing evenings in this vibrant neighborhood. Inside, you’ll find a spacious layout filled with natural light and plenty of room to make it your own. The home has seen meaningful updates, including a newly expanded and renovated kitchen designed for both everyday living and entertaining, along with a new bathroom on the main floor for added convenience. Additional improvements include fresh paint in several rooms. Step outside to enjoy the brand-new deck and backyard fencing—ideal for relaxing or hosting gatherings. The exterior has also been enhanced with new gutters and thoughtful front yard landscaping, featuring a rock wall and low-maintenance ground cover that adds to the home’s curb appeal. Located in one of Kansas City’s most beloved historic communities, you’ll enjoy tree-lined streets, a strong sense of community, and unbeatable proximity to downtown, the Plaza, restaurants, parks, and more. Whether you’re looking for your next home or an investment opportunity, this South Hyde Park gem offers timeless charm, thoughtful updates, and an unbeatable location!
-
2007-09-07soldstatus
-
2004-02-09soldstatus
-
1999-10-26soldstatus
ⓘ Source: listings_history table (triggers on properties + properties_extension) + one-shot
backfill from property_details.listing_events for pre-trigger history.
Tax reassessment forecast MO · Resets to sale price
- Current annual tax
- $2,356 · $196/mo
- Projected year-2 tax
- $2,570 · $214/mo
- Expected delta
- +$214/yr (+$18/mo · 9.1%)
ⓘ Screening estimate from a state-policy table — verify with the county assessor before closing.
Climate risk First Street
- Flood 1/10 Low FEMA zone X (unshaded) · 0% chance over 30 yrs
- Wildfire 1/10 Low
- Heat 4/10 Moderate 7 d/yr ≥106°F today · 17 d/yr by 30 yrs out
- Wind 2/10 Low
- Air quality 3/10 Moderate 2 unhealthy d/yr today · 4 by 30 yrs out
Nearby sold comps map
Loading sold comps map…
Walkable amenities ~0.75 mi
Loading nearby amenities…
Taxation est. · year 1
- Rental income
- $25,498
- − Mortgage interest
- −$14,844
- − Property taxes
- −$2,356
- − Insurance
- −$1,325
- − Repairs & maintenance
- −$2,040
- − Management
- −$2,040
- − Depreciation
- −$7,709
- Taxable loss
- −$4,816
- Est. tax savings @ 24.0%
- +$1,156
- After-tax cash flow
- $942/yr
For passive investors: Depreciation is non-cash, so a rental often shows a tax loss while cash-flowing — sheltering income. Rental losses are passive: they offset passive income freely, and up to $25,000/yr can offset ordinary (W-2) income if you actively participate and your MAGI is under $100k (phasing out to $0 by $150k); unused losses carry forward. On sale, claimed depreciation is recaptured at up to 25%, and gains may owe capital-gains tax (a 1031 exchange can defer both). Figures are a year-1 estimate at your 24.0% rate — not tax advice; consult a CPA.
Schools (NCES district)
- District
- Kansas City 33
- NCES district ID
- 2916400
- Math proficiency
- 12% ▼ -8.00%
- Reading proficiency
- 24% ▬ 0.00%
- Median HH income
- $35,227
- Composite
- 14.8/100
- National rank
- #9387
- State rank
- #308 of 324 in MO
Livability — Kansas City
- Score
- 78/100
- State rank
- #28
- US rank
- #2671
Category grades
Schools grade is shown separately in the Schools card above.
Census & demographics
- Census place
- Kansas City, MO
- County
- Jackson County · 687,798 people
- City population
- 439,467
- Metro
- Kansas City, MO-KS
- Population (ZIP)
- 16,878
- Household income
- $63,044
- Rent vs Own
- Severe rent burden
- 962.0
Population outlook (Jackson County) Hauer SSP2
- Today (2025)
- 719,589 people
- By 2030
- 731,456 · +1.6%
- By 2040
- 746,689 · +3.8%
- By 2050
- 749,289 · +4.1%
- By 2075
- 736,227 · +2.3%
- By 2100
- 668,210 · -7.1%
Race, ethnicity, and origin ACS 2023
- Neighborhood character
- Diverse neighborhood (Simpson 0.63)
- Race & ethnicity
- White 49% Black 34% Two or more races 10% Hispanic / Latino 9% Asian 2%
- Hispanic origin (detail)
- Mexican 6%
- Common ancestry
- Romanian 2% Lithuanian 2% Italian 2%
- Foreign-born
- 4% · Canada
- Languages at home
- 92% English-only · Spanish 6% French/Haitian/Cajun 1% Other Indo-European 1%
Political lean MEDSL · Jackson
- 2024 margin
- D (+19.3) · D 58.9% · R 39.5% · Other 1.6%
- 2008→2024 swing
- -6.1pp toward R · 2008: 25.4pp · 2024: 19.3pp
- All cycles
- 2024: D+19.3 2020: D+22.0 2016: D+16.6 2012: D+19.0 2008: D+25.4
Not yet ingested
- Civics
- —
Market trends
- HPI YoY
- ▼ -514.37%
- Current HPI
- 371.8501
- Rent YoY
- ▲ 3.95%
- Metro
- Kansas City, MO-KS
- State GDP YoY
- ▲ 1.84%
- F500 in state
- 20
Industry mix (Fortune 500 HQ in MO)
| Industry | F500 HQs | Revenue |
|---|---|---|
| Healthcare | 1 | $163B |
|
||
| Insurance | 1 | $21B |
|
||
| Industrial Technology | 1 | $17B |
|
||
| Retail | 1 | $16B |
|
||
| Industrial Distribution | 1 | $10B |
|
||
| Utilities | 1 | $9B |
|
||
Price history
+0.0% since first listed6 events — show timeline
- 2026-05-11 Pending — Heartland MLS as Distributed by MLS Grid
- 2026-05-08 Listed $265,000 Heartland MLS as Distributed by MLS Grid
- 2026-04-14 Coming Soon $265,000 Heartland MLS as Distributed by MLS Grid
- 2007-09-07 Sold (Public Records) — Public Records
- 2004-02-09 Sold (Public Records) — Public Records
- 1999-10-26 Sold (Public Records) — Public Records
Property tax history
+3.1%/yrLatest (2025): $2,356 · +22.2% YoY. Source: county tax records.
Cash-flow waterfall
monthlySold comps — $/sqft
last 12 mo · ≤1 miLoading sold comps…