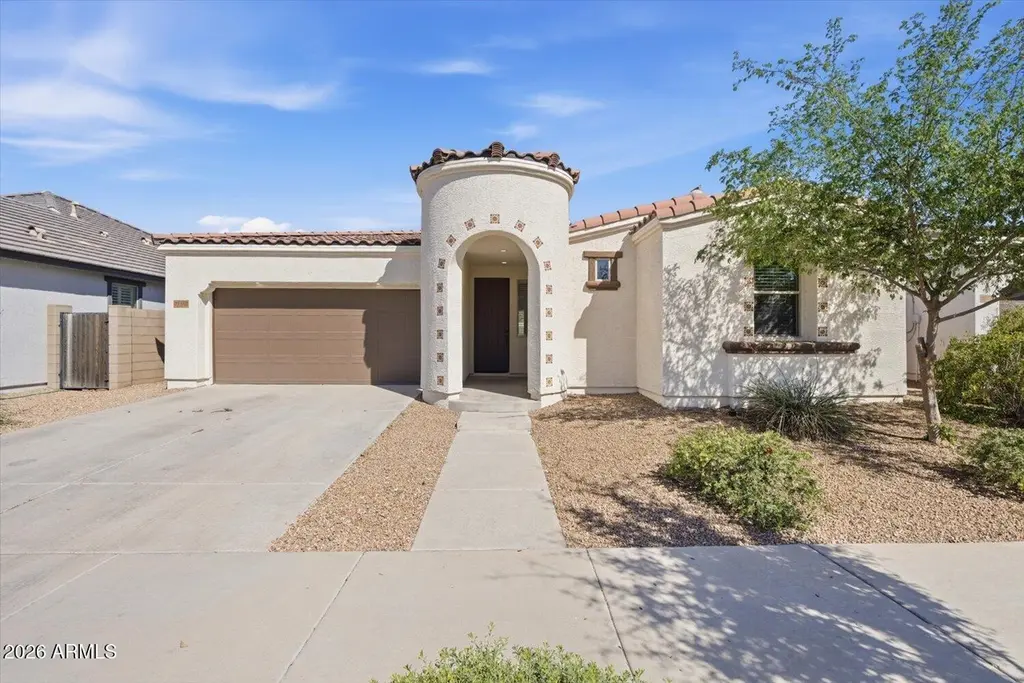
22462 E Camina Plata Ave · Queen Creek, AZ
Flood risk 1/10 · Minimal
- FEMA flood zone
- X (shaded)
- Chance of flooding over 30 yrs
- 0.0%
- Est. flood insurance / yr
- $507 – $1,088
Fire risk 2/10 · Minimal
- Est. fire insurance / yr
- $610 – $1,132
Heat risk 9/10 · Severe
- Hot days now (above 111°F)
- 7 days/yr
- Hot days in 30 yrs
- 19 days/yr
Wind risk 1/10 · Minimal
- Chance of severe wind over 30 yrs
- —
Air-quality risk 2/10 · Minimal
- Unhealthy air days now
- 1 days/yr
- Unhealthy air days in 30 yrs
- 1 days/yr
Risk factors via First Street. Map © Google.
Why this score? — see what drove the D- grade
The composite is a weighted blend of 9 inputs, each scored 0–100. Each bar is that input's sub-score; the figure is the points it added to the 100-point composite (weight × sub-score).
- ARV discount +12.3/15.0
- Cash flow +7.9/30.0
- Schools +4.9/10.0
- Livability +3.6/5.0
- Rent growth +2.6/5.0
- Condition / age +2.5/5.0
- DSCR +1.9/10.0
- 1% rule +1.6/10.0
- Appreciation +0.0/10.0
$414,500
🖨 Deal sheet (PDF) 📄 Offer letter ✓ Due diligence
Listing remarks MLS
Tastefully updated with all new inside paint, carpet, lights, hardware, plumbing fixtures, epoxied garage and more. Low maintenance backyard makes this home great for families and pets.
Key facts
- 5,500 sq ft lot
- 2 garage spots
- Community pool
Neighborhood map
What this means for you Summary
Snapshot
- This is a 3-bed/3.0-bath single-family listed at $414k.
Deal economics
- At list price, monthly cash flow is $-447 ($-5k/yr) — negative.
- To cash-flow at today's rent, offer at most $336k (19.0% below list).
- To meet the 1% rule (rent ≥ 1% of price), the offer needs to be $272k (34.5% below list).
- Recommended offer: $272k (34.5% below list) — sets the bar for 1% rule.
- Cap rate 5.0% vs local median 2.6% in Queen Creek — top-decile yield for the area; either an underpriced asset or a hidden risk that comps aren't pricing in. Stress-test before assuming the spread holds.
Location & tenants
- Location reads 72/100 on livability (#27 in AZ) — a middle-class / working-renter tenant base. Strengths: crime A+, employment A+, housing A+; Watch: health & safety C-, commute F, cost of living F.
- Queen Creek Unified District (4245) (suburban): math 55% / reading 53% proficiency, ranked #25 of 249 in AZ (top 10%) — acceptable for families but not a draw, mixed tenant base, ~2y average lease.
- Market conditions: Rents flat; 860 active listings in the ZIP; 31 comparable units currently listed for rent nearby; rentals at typical pace (median 20d on market — plan ~3-4 weeks tenant-placement turnaround); high-income renter base; 36,011 units permitted in Maricopa County in 2024 (12,801 in 5+ unit buildings).
Forward outlook
- Local home prices are declining (-3.0%/yr); year-one equity from $3k of loan paydown is wiped out by about $12k of value loss. Plan a longer hold.
- Maricopa County population projected at +38% by 2050 — long-run rental-demand tailwind backs the buy-and-hold thesis.
Negotiation context
- It's been on market 76 days — a 6% lower offer ($390k) is reasonable based on typical stale-listing flexibility.
- 2 sale attempts with the ask held roughly flat each time — persistent listings suggest the price (not the market) is what's stuck; bring a comps-based counter.
- Current owner paid $340k; 22% above their basis — modest negotiation headroom, anchor on the comps not their cost.
Risks & watch-outs
- Climate carrying-cost: extreme-heat days projected 7→19/yr by 2055 (HVAC capex compounding) — expect insurance premiums to compound above CPI over the hold.
Questions for the listing agent
- What do current leases actually rent for vs. the listed asking? Can we see a recent rent roll and the last 12 months of T-12 income?
- It's been on market 76 days. Have you received any prior offers? Is the seller open to a 34% concession, seller financing, or rate buy-down credit?
- What does the HOA fee cover, when was the last increase, and are there any pending special assessments or reserve-fund shortfalls?
- Why hasn't it sold? Are there any deal-killer items the seller is aware of (foundation, flood, title, zoning, code violations)?
- Is there a deadline driving the sale (1031 exchange, divorce, estate, relocation)? That informs how much negotiation room exists.
- Schools are A-rated — typically a magnet for longer-tenancy family renters. What's the average tenant stay here, and is there a school-zone premium baked into asking?
- The area grade is low — what's the realistic commute time and amenity access for the typical tenant pool here? Any planned neighborhood developments (good or bad) we should know about?
- What's the average days-on-market for RENTAL listings here right now (not sales)? A rising rental-DOM trend means longer vacancies and softer asking-rent achievability than the comps imply.
- What's the recent tenant-quality profile in this submarket — average credit score on applications, eviction rate, late-payment / NSF rate, and stable-employment percentage? A property-management company in the area should have these aggregated.
- How much new for-sale + rental construction is in the pipeline within 1–3 miles? Heavy new supply typically softens prices + rents 12–24 months out; constrained supply supports both.
Investment metrics
- 1% rule
- 0.66% ✗
- Cap rate
- 5.00%
- Cash-on-cash
- -4.62%
- DSCR
- 0.79
- GRM
- 12.7
CMA / ARV
- ARV (median comp)
- $463,830
- List price
- $414,500
- Delta
- -10.64%
- Verdict
- UNDERPRICED
- Comps
- 20 within 1.0 mi
Show comp detail 12 sales within ~0.75 mi
| Address | Dist | Beds/Ba | Sqft | Sold | Price | $/sf | Match |
|---|---|---|---|---|---|---|---|
| 22462 E Camina Plata Ave | 0.00mi | 3/2.0 | 1,710 (0%) | 0mo | $402,500 | $235 | 96 |
| 22438 E Camina Plata St | 0.03mi | 3/2.0 | 1,710 (0%) | 1mo | $464,000 | $271 | 94 |
| 22569 E Camina Plata -- | 0.12mi | 3/2.0 | 1,710 (0%) | 1mo | $430,000 | $251 | 90 |
| 22659 E Desert Spoon Dr | 0.26mi | 3/2.0 | 1,710 (0%) | 1mo | $453,490 | $265 | 83 |
| 22533 E Camina Plata -- | 0.09mi | 3/2.0 | 1,506 (-12%) | 1mo | $420,000 | $279 | 71 |
| 22440 E Via Del Oro -- | 0.10mi | 3/2.0 | 1,942 (+14%) | 1mo | $440,000 | $227 | 68 |
| 22749 E Poco Calle -- | 0.28mi | 3/2.0 | 1,868 (+9%) | 1mo | $560,000 | $300 | 66 |
| 22328 E Calle De Flores -- | 0.49mi | 4/2.0 (+1) | 1,692 (-1%) | 2mo | $490,000 | $290 | 65 |
| 22336 E Via Del Rancho Rd | 0.38mi | 3/2.0 | 1,527 (-11%) | 3mo | $440,000 | $288 | 58 |
| 22463 E Desert Spoon Dr | 0.21mi | 4/2.0 (+1) | 1,942 (+14%) | 1mo | $471,000 | $243 | 57 |
| 22749 E Via DE Olivos -- | 0.32mi | 3/2.0 | 1,942 (+14%) | 2mo | $460,000 | $237 | 57 |
| 22964 E Via Del Sol -- | 0.65mi | 3/2.0 | 1,935 (+13%) | 3mo | $460,000 | $238 | 42 |
Match score weights: distance 35% · size 25% · config 20% · recency 20%. Top-matched comps best support the ARV.
Projected returns pro-forma
-3.0% appreciation · 0.59% rent growth · sell at horizon
- IRR
- -26.6%
- Equity multiple
- 0.12×
- Total profit
- $-102,172
- Equity at exit
- $61,803
- IRR
- -33.2%
- Equity multiple
- -0.30×
- Total profit
- $-151,261
- Equity at exit
- $35,838
Cash invested: $116,060 (down + closing). Projections, not guarantees.
Landlord ↔ Tenant lean methodology
- Overall (STATE)
- 87 Strongly Landlord-Friendly
- State Arizona
- 87 Strongly Landlord-Friendly · R+3
- County
- — inherits STATE
- City
- — inherits STATE
ZIP-level market 85142
- Home prices YoY
- -30.6%
- Rents YoY
- 0.6%
- Active inventory
- 860
- Price-to-rent
- 12.7×
Monthly cashflow live
- Estimated rent
- $2,716 high interval (Pro) →
- Mortgage (P&I)
- −$2,174
- Tax from tax record
- −$144 /mo · $1,729/yr
- Insurance
- −$173
- HOA
- −$102
- Vacancy / Maint / Mgmt
- −$570
- Net cashflow
- $-447
Break-even live
Sensitivity live
| Price | -10% $-212 | -5% $-329 | +0% $-447 | +5% $-564 | +10% $-681 |
|---|---|---|---|---|---|
| Rent | -10% $-661 | -5% $-554 | +0% $-447 | +5% $-339 | +10% $-232 |
| Rate | -1.0pp $-238 | -0.5pp $-341 | base $-447 | +0.5pp $-554 | +1.0pp $-663 |
UW: 25.0% down · 7.5% · 30yr · 1.5% tax · 5.0% vac · 8.0% maint · 8.0% mgmt
Financing live
Cash to close
- Down payment
- $103,625
- Closing costs
- $12,435
- Reserves months
- —
- Total cash needed
- —
Loan-product check · same deal, 3 products live
Conventional
25% down · 7.5% · 30yr
- Down + closing
- —
- Monthly P&I
- —
- Monthly cashflow
- —
- DSCR
- —
- Eligible?
- —
Personal DTI + credit; lowest rate.
DSCR
20% down · 8.5% · 30yr
- Down + closing
- —
- Monthly P&I
- —
- Monthly cashflow
- —
- DSCR
- —
- Eligible?
- —
No personal income docs; deal must DSCR.
Hard money
10% down · 12.0% · 12mo
- Down + closing
- —
- Monthly P&I
- —
- Monthly cashflow
- —
- DSCR
- —
- Eligible?
- —
Short-term bridge; refi at stabilization.
Rent comps 31 comps
| Address | Beds | Baths | Sqft | Rent | $/sqft | DOM | Units | Dist |
|---|---|---|---|---|---|---|---|---|
| 22469 E Camina Plata Queen Creek, AZ | 3.0 | 2.0 | 1942 | $3,600 | $1.85 | 45d | 1 | 0.04mi |
| 22503 E Calle de Flores Queen Creek, AZ | 3.0 | 2.0 | 1710 | $3,200 | $1.87 | 25d | 1 | 0.10mi |
| 22503 E Calle de Flores Queen Creek, AZ | 3.0 | 2.0 | 1710 | $3,600 | $2.11 | 45d | 1 | 0.10mi |
| 22464 E Via del Oro Queen Creek, AZ | 3.0 | 2.0 | 1713 | $2,136 | $1.25 | 6d | 1 | 0.12mi |
| 22558 E Via Las Brisas Queen Creek, AZ | 4.0 | 2.0 | 2202 | $2,300 | $1.04 | 6d | 1 | 0.17mi |
| 22595 E Via del Palo Queen Creek, AZ | 3.0 | 2.0 | 1710 | $2,295 | $1.34 | 18d | 1 | 0.19mi |
| 22352 E Via del Palo Queen Creek, AZ | 4.0 | 2.0 | 1863 | $2,149 | $1.15 | 12d | 1 | 0.26mi |
| 22352 E Via del Palo Queen Creek, AZ | 4.0 | 2.0 | 1863 | $2,149 | $1.15 | 0d | 1 | 0.26mi |
| 22360 E Via del Rancho Queen Creek, AZ | 4.0 | 2.0 | 1527 | $2,100 | $1.38 | 0d | 1 | 0.27mi |
| 22360 E Via del Rancho Queen Creek, AZ | 4.0 | 2.0 | 1527 | $2,100 | $1.38 | 21d | 1 | 0.27mi |
| 22724 E Poco Queen Creek, AZ | 3.0 | 2.0 | 1868 | $3,550 | $1.90 | 25d | 1 | 0.29mi |
| 22659 E Desert Spoon Dr Queen Creek, AZ | 3.0 | 2.0 | 1710 | $2,200 | $1.29 | 0d | 1 | 0.29mi |
| 22659 E Desert Spoon Dr Queen Creek, AZ | 3.0 | 2.0 | 1710 | $2,200 | $1.29 | 3d | 1 | 0.29mi |
| 22545 E Silver Creek Ln Queen Creek, AZ | 3.0 | 2.0 | 2061 | $2,395 | $1.16 | 6d | 1 | 0.42mi |
| 22804 E Via de Olivos Queen Creek, AZ | 3.0 | 2.0 | 1942 | $2,485 | $1.28 | 21d | 1 | 0.42mi |
| 22217 E Via del Palo Queen Creek, AZ | 3.0 | 2.5 | 1775 | $2,100 | $1.18 | 45d | 1 | 0.56mi |
| 22691 E Rittenhouse Rd Queen Creek, AZ | 1.0–3.0 | 1.0–2.0 | 981 | $2,595 | $2.65 | 0d | 16 | 0.64mi |
| 22063 E Via del Rancho Queen Creek, AZ | 4.0 | 2.0 | 2046 | $2,725 | $1.33 | 19d | 1 | 0.71mi |
| 21858 E Puesta del Sol Queen Creek, AZ | 3.0 | 2.0 | 1320 | $1,895 | $1.44 | 25d | 1 | 0.79mi |
| 21858 E Puesta del Sol Queen Creek, AZ | 3.0 | 2.0 | 1320 | $1,895 | $1.44 | 12d | 1 | 0.79mi |
| 21870 E Gold Canyon Dr Queen Creek, AZ | 3.0 | 2.0 | 1320 | $2,150 | $1.63 | 45d | 1 | 0.84mi |
| 22483 E Quintero Rd Queen Creek, AZ | 3.0 | 2.0 | 1568 | $2,190 | $1.40 | 45d | 1 | 1.02mi |
| 22770 E Rosa Rd Queen Creek, AZ | 3.0 | 2.5 | 1946 | $2,649 | $1.36 | 6d | 1 | 1.04mi |
| 23196 S 216th St Queen Creek, AZ | 4.0 | 2.5 | 2111 | $2,470 | $1.17 | 25d | 1 | 1.05mi |
| 23277 S 215th St Queen Creek, AZ | 4.0 | 2.0 | 1692 | $2,400 | $1.42 | 45d | 1 | 1.12mi |
| 25325 S 225th Pl Queen Creek, AZ | 4.0 | 2.5 | 1933 | $2,450 | $1.27 | 19d | 1 | 1.27mi |
| 22820 E Marsh Rd Queen Creek, AZ | 3.0 | 2.0 | 2132 | $2,595 | $1.22 | 3d | 1 | 1.31mi |
| 22849 E Marsh Rd Queen Creek, AZ | 4.0 | 2.0 | 2250 | $3,800 | $1.69 | 45d | 1 | 1.35mi |
| 22203 S 214th St Queen Creek, AZ | 3.0 | 2.0 | 1695 | $2,500 | $1.47 | 25d | 1 | 1.39mi |
| 25417 S 229th Pl Queen Creek, AZ | 4.0 | 2.0 | 2184 | $2,850 | $1.30 | 6d | 1 | 1.46mi |
| 21260 E Calle Luna Queen Creek, AZ | 3.0 | 2.0 | 1284 | $1,999 | $1.56 | 6d | 1 | 1.47mi |
HOA detail
- Monthly dues
- $102 · $1,224/yr
Listing history 7 events
-
2026-05-13price $414,500 185-char remark
Show marketing remark (185 chars)
Tastefully updated with all new inside paint, carpet, lights, hardware, plumbing fixtures, epoxied garage and more. Low maintenance backyard makes this home great for families and pets.
-
2026-05-12status Active 185-char remark
Show marketing remark (185 chars)
Tastefully updated with all new inside paint, carpet, lights, hardware, plumbing fixtures, epoxied garage and more. Low maintenance backyard makes this home great for families and pets.
-
2026-05-05status Pending 185-char remark
Show marketing remark (185 chars)
Tastefully updated with all new inside paint, carpet, lights, hardware, plumbing fixtures, epoxied garage and more. Low maintenance backyard makes this home great for families and pets.
-
2026-04-10price $419,500 185-char remark
Show marketing remark (185 chars)
Tastefully updated with all new inside paint, carpet, lights, hardware, plumbing fixtures, epoxied garage and more. Low maintenance backyard makes this home great for families and pets.
-
2026-03-18price $419,900 185-char remark
Show marketing remark (185 chars)
Tastefully updated with all new inside paint, carpet, lights, hardware, plumbing fixtures, epoxied garage and more. Low maintenance backyard makes this home great for families and pets.
-
2026-03-06$429,900 Active 185-char remark
Show marketing remark (185 chars)
Tastefully updated with all new inside paint, carpet, lights, hardware, plumbing fixtures, epoxied garage and more. Low maintenance backyard makes this home great for families and pets.
-
2026-01-27soldstatus $340,000
ⓘ Source: listings_history table (triggers on properties + properties_extension) + one-shot
backfill from property_details.listing_events for pre-trigger history.
Tax reassessment forecast AZ · Resets to sale price
- Current annual tax
- $1,729 · $144/mo
- Projected year-2 tax
- $2,736 · $228/mo
- Expected delta
- +$1,006/yr (+$84/mo · 58.2%)
ⓘ Screening estimate from a state-policy table — verify with the county assessor before closing.
Climate risk First Street
- Flood 1/10 Low FEMA zone X (shaded) · 0% chance over 30 yrs
- Wildfire 2/10 Low
- Heat 9/10 Extreme 7 d/yr ≥111°F today · 19 d/yr by 30 yrs out
- Wind 1/10 Low
- Air quality 2/10 Low 1 unhealthy d/yr today · 1 by 30 yrs out
Nearby sold comps map
Loading sold comps map…
Walkable amenities ~0.75 mi
Loading nearby amenities…
Taxation est. · year 1
- Rental income
- $32,595
- − Mortgage interest
- −$23,218
- − Property taxes
- −$1,729
- − Insurance
- −$2,072
- − Repairs & maintenance
- −$2,608
- − Management
- −$2,608
- − HOA
- −$1,224
- − Depreciation
- −$12,058
- Taxable loss
- −$12,922
- Est. tax savings @ 24.0%
- +$3,101
- After-tax cash flow
- $-2,258/yr
For passive investors: Depreciation is non-cash, so a rental often shows a tax loss while cash-flowing — sheltering income. Rental losses are passive: they offset passive income freely, and up to $25,000/yr can offset ordinary (W-2) income if you actively participate and your MAGI is under $100k (phasing out to $0 by $150k); unused losses carry forward. On sale, claimed depreciation is recaptured at up to 25%, and gains may owe capital-gains tax (a 1031 exchange can defer both). Figures are a year-1 estimate at your 24.0% rate — not tax advice; consult a CPA.
Schools (NCES district)
- District
- Queen Creek Unified District (4245)
- NCES district ID
- 0406810
- Math proficiency
- 55% ▼ -8.00%
- Reading proficiency
- 53% ▼ -6.00%
- Median HH income
- $84,928
- Composite
- 49.46/100
- National rank
- #2003
- State rank
- #25 of 249 in AZ
Livability — Queen Creek
- Score
- 72/100
- State rank
- #27
- US rank
- #5874
Category grades
Schools grade is shown separately in the Schools card above.
Census & demographics
- Census place
- Queen Creek, AZ
- County
- Maricopa County · 4,537,380 people
- City population
- 93,700
- Metro
- Phoenix-Mesa-Chandler, AZ
- Population (ZIP)
- 93,700
- Household income
- $129,367
- Rent vs Own
- Severe rent burden
- 1106.0
Population outlook (Maricopa County) Hauer SSP2
- Today (2025)
- 4,979,203 people
- By 2030
- 5,378,229 · +8.0%
- By 2040
- 6,156,598 · +23.6%
- By 2050
- 6,872,376 · +38.0%
- By 2075
- 8,401,270 · +68.7%
- By 2100
- 9,247,439 · +85.7%
Race, ethnicity, and origin ACS 2023
- Neighborhood character
- Predominantly White (66%)
- Race & ethnicity
- White 66% Hispanic / Latino 22% Two or more races 14% Black 4% Asian 3%
- Hispanic origin (detail)
- Mexican 17%
- Common ancestry
- Italian 3% Romanian 3% Portuguese 2%
- Foreign-born
- 8% · Canada
- Languages at home
- 86% English-only · Spanish 11% Other Indo-European 1% Tagalog/Filipino 1%
Political lean MEDSL · Maricopa
- 2024 margin
- Toss-up / Even · D 47.7% · R 51.2% · Other 1.1%
- 2008→2024 swing
- +7.1pp toward D · 2008: -10.6pp · 2024: -3.5pp
- All cycles
- 2024: R+3.5 2020: D+2.2 2016: R+3.5 2012: R+12.0 2008: R+10.6
Not yet ingested
- Civics
- —
Market trends
- HPI YoY
- ▼ -145.50%
- Current HPI
- 329.9469
- Rent YoY
- ▲ 0.59%
- Metro
- Phoenix-Mesa-Chandler, AZ
- State GDP YoY
- ▲ 4.54%
- F500 in state
- 20
Industry mix (Fortune 500 HQ in AZ)
| Industry | F500 HQs | Revenue |
|---|---|---|
| Technology | 2 | $13B |
|
||
| Mining / Metals | 1 | $23B |
|
||
| Environmental Services | 1 | $16B |
|
||
| Metals / Steel | 1 | $14B |
|
||
| Technology Distribution | 1 | $9B |
|
||
| Homebuilding | 1 | $8B |
|
||
Price history
+21.9% since first listed7 events — show timeline
- 2026-05-13 Price Changed $414,500 ARMLS
- 2026-05-12 Relisted — ARMLS
- 2026-05-05 Pending — ARMLS
- 2026-04-10 Price Changed $419,500 ARMLS
- 2026-03-18 Price Changed $419,900 ARMLS
- 2026-03-06 Listed $429,900 ARMLS
- 2026-01-27 Sold (Public Records) $340,000 Public Records
Property tax history
+37.8%/yrLatest (2025): $1,729 · -4.3% YoY. Source: county tax records.
Cash-flow waterfall
monthlySold comps — $/sqft
last 12 mo · ≤1 miLoading sold comps…