201 Heber Ave Unit 309.E · Park City, UT
Flood risk 8/10 · Major
- FEMA flood zone
- X (unshaded)
- Chance of flooding over 30 yrs
- 0.99%
- Est. flood insurance / yr
- $507 – $1,088
Fire risk 7/10 · Major
- Est. fire insurance / yr
- $453 – $841
Heat risk 1/10 · Minimal
- Hot days now (above 81°F)
- 8 days/yr
- Hot days in 30 yrs
- 21 days/yr
Wind risk 1/10 · Minimal
- Chance of severe wind over 30 yrs
- —
Air-quality risk 3/10 · Minor
- Unhealthy air days now
- 3 days/yr
- Unhealthy air days in 30 yrs
- 4 days/yr
Risk factors via First Street. Map © Google.
Why this score? — see what drove the D grade
The composite is a weighted blend of 9 inputs, each scored 0–100. Each bar is that input's sub-score; the figure is the points it added to the 100-point composite (weight × sub-score).
- Appreciation +8.3/10.0
- ARV discount +7.5/15.0
- Cash flow +6.1/30.0
- Schools +4.7/10.0
- 1% rule +4.3/10.0
- Livability +3.6/5.0
- Rent growth +2.5/5.0
- Condition / age +2.5/5.0
- DSCR +0.5/10.0
$640,000
🖨 Deal sheet 📄 Offer letter ✓ Due diligence
Listing remarks MLS
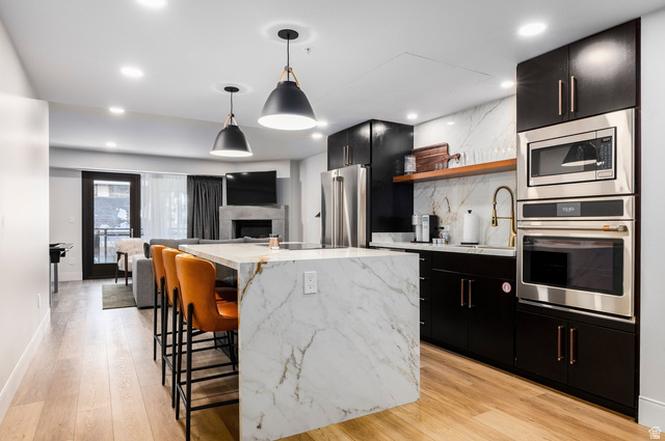
Old Town Fractional Steps from Skiing and Main Street
Key facts
- Ski-in access
- High-end finishes
- Open-concept layout
Tags
Property features AI
Finance
- Financial info: Association fee: $4,464 quarterly
- HOA & community: Homeowners association (Scofield); Quarterly HOA fee; HOA covers cable TV, gas, insurance, grounds maintenance, sewer, trash, water; Community amenities include concierge, fitness center, pool, sauna, storage, management, snow removal; pets not permitted
Exterior
- Parking: Attached garage (secured); 1 total parking space (1 covered, 1 garage space)
- Security: Secured parking; Fire alarm
- Utilities: Natural gas connected; Electricity connected; Public sewer connected; Culinary water connected
- Home design: Condo, middle level; Fractional ownership; Built and standing (effective year 2026); Metal roof
- Construction: Cement siding; Metal siding; Built/standing (2026 effective)
- Exterior features: Covered deck; Secured parking; Sliding glass doors; Hot tub; Partially landscaped; Paved road access
Interior
- Kitchen: Refrigerator; Range hood; Wall oven; Gas range
- Bedrooms: Primary bedroom on 1st floor; 3 main level bedrooms
- Flooring: Hardwood flooring; Tile flooring
- Bathrooms: 2 full bathrooms; 1 three-quarter bathroom
- Heating & cooling: Forced air heating
- Interior features: Fire alarm; Gas log; Updated kitchen; Wall oven; Gas range/oven; Drapes/window coverings; Fireplace insert
- Laundry & utility: Washer; Dryer
Neighborhood map
What this means for you Summary
Snapshot
- This is a 3-bed/3.0-bath condo listed at $640k.
Deal economics
- At list price, monthly cash flow is $-1k ($-15k/yr) — negative.
- To cash-flow at today's rent, offer at most $459k (28.3% below list).
- To meet the 1% rule (rent ≥ 1% of price), the offer needs to be $598k (6.6% below list).
- Recommended offer: $459k (28.3% below list) — sets the bar for cash-flow.
Location & tenants
- Location reads 72/100 on livability (#78 in UT) — a middle-class / working-renter tenant base. Strengths: amenities A+, commute A+, employment A+; Watch: crime D, cost of living F, health & safety F.
- Park City District (town): math 46% / reading 53% proficiency, ranked #9 of 80 in UT (top 11%) — families likely to look elsewhere, expect single-tenant / working-renter base with shorter leases; only 20% free/reduced lunch — higher-income household profile.
- Zoned schools: Mcpolin School (math 62% / reading 52%, grade C+, #75 of 585 statewide, top 14%, 403 students, 29% FRL); Park City High (math 39% / reading 58%, grade D, #33 of 171 statewide, top 19%, 1,224 students, 13% FRL) — zoned schools at 21% FRL track the district average.
- Market conditions: 705 active listings in the ZIP; 8 comparable units currently listed for rent nearby; rentals at typical pace (median 22d on market — plan ~3-4 weeks tenant-placement turnaround); high-income renter base; 917 units permitted in Summit County in 2024 (529 in 5+ unit buildings).
- At $5,980/mo this rent would consume 56% of the median local household income ($128k/yr) (locally 223% of renters already pay >50% of income on rent) — very limited rent-growth headroom before tenants either downsize or default.
Forward outlook
- In year one you build about $47k of equity ($4k loan paydown + $43k appreciation (6.7% local appreciation)).
- Summit County population projected at +42% by 2050 — long-run rental-demand tailwind backs the buy-and-hold thesis.
- By year 2, paydown + projected appreciation supports a ~$75k cash-out refi (75% LTV) — recoverable capital for the next deal without selling this one.
Negotiation context
- It's been on market 111 days — a 9% lower offer ($582k) is reasonable based on typical stale-listing flexibility.
- 2 sale attempts with the ask held roughly flat each time — persistent listings suggest the price (not the market) is what's stuck; bring a comps-based counter.
Risks & watch-outs
- Watch-outs: flood insurance adds $66/mo; HOA is 25% of rent.
- Climate carrying-cost: severe flood risk; major wildfire risk — expect insurance premiums to compound above CPI over the hold.
Questions for the listing agent
- What do current leases actually rent for vs. the listed asking? Can we see a recent rent roll and the last 12 months of T-12 income?
- It's been on market 111 days. Have you received any prior offers? Is the seller open to a 28% concession, seller financing, or rate buy-down credit?
- What's the actual annual flood-insurance premium (NFIP or private), and is the property in a SFHA with mandatory coverage?
- What does the HOA fee cover, when was the last increase, and are there any pending special assessments or reserve-fund shortfalls?
- Any open or pending special assessments — roof, HVAC, plumbing, elevator, façade? What's the per-unit balance and payoff schedule, and is the seller paying it off at close or rolling it to the buyer?
- Why hasn't it sold? Are there any deal-killer items the seller is aware of (foundation, flood, title, zoning, code violations)?
- Is there a deadline driving the sale (1031 exchange, divorce, estate, relocation)? That informs how much negotiation room exists.
- Crime grade is D in this area — have there been break-ins, vandalism, or insurance claims at this property in the last 3 years? What carrier currently insures it and at what premium?
- The area grade is low — what's the realistic commute time and amenity access for the typical tenant pool here? Any planned neighborhood developments (good or bad) we should know about?
- What's the average days-on-market for RENTAL listings here right now (not sales)? A rising rental-DOM trend means longer vacancies and softer asking-rent achievability than the comps imply.
- What's the recent tenant-quality profile in this submarket — average credit score on applications, eviction rate, late-payment / NSF rate, and stable-employment percentage? A property-management company in the area should have these aggregated.
- How much new apartment / multifamily construction is in the pipeline within 1–3 miles? Heavy new supply (>2% of stock underway) typically softens rents 12–24 months out; light construction supports rent growth.
Investment metrics
- 1% rule
- 0.93% ✗
- Cap rate
- 4.07%
- Cash-on-cash
- -7.94%
- DSCR
- 0.65
- GRM
- 8.9
CMA / ARV
No comps found within radius.
Projected returns pro-forma
6.67% appreciation · 3.0% rent growth · sell at horizon
- IRR
- 10.4%
- Equity multiple
- 1.73×
- Total profit
- $131,610
- Equity at exit
- $429,534
- IRR
- 11.5%
- Equity multiple
- 3.49×
- Total profit
- $445,975
- Equity at exit
- $803,575
Cash invested: $179,200 (down + closing). Projections, not guarantees.
Landlord ↔ Tenant lean methodology
- Overall (STATE)
- 86 Strongly Landlord-Friendly
- State Utah
- 86 Strongly Landlord-Friendly · R+15
- County
- — inherits STATE
- City
- — inherits STATE
ZIP-level market 84060
- Home prices YoY
- 2.1%
- Active inventory
- 705
- Price-to-rent
- 8.9×
Monthly cashflow live
- Estimated rent
- $5,980 high interval (Pro) →
- Mortgage (P&I)
- −$3,356
- Tax est. 1.5%
- −$800 /mo · $9,600/yr
- Insurance
- −$267
- Flood insurance flood zone
- −$66 /mo · $798/yr
- HOA
- −$1,488
- Vacancy / Maint / Mgmt
- −$1,256
- Net cashflow
- $-1,253
Break-even live
UW: 25.0% down · 7.5% · 30yr · 1.5% tax · 5.0% vac · 8.0% maint · 8.0% mgmt
Financing live
Cash to close
- Down payment
- $160,000
- Closing costs
- $19,200
- Reserves months
- —
- Total cash needed
- —
Loan-product check · same deal, 3 products live
Conventional
25% down · 7.5% · 30yr
- Down + closing
- —
- Monthly P&I
- —
- Monthly cashflow
- —
- DSCR
- —
- Eligible?
- —
Personal DTI + credit; lowest rate.
DSCR
20% down · 8.5% · 30yr
- Down + closing
- —
- Monthly P&I
- —
- Monthly cashflow
- —
- DSCR
- —
- Eligible?
- —
No personal income docs; deal must DSCR.
Hard money
10% down · 12.0% · 12mo
- Down + closing
- —
- Monthly P&I
- —
- Monthly cashflow
- —
- DSCR
- —
- Eligible?
- —
Short-term bridge; refi at stabilization.
Rent comps 8 comps
| Address | Beds | Baths | Sqft | Rent | $/sqft | DOM | Units | Dist |
|---|---|---|---|---|---|---|---|---|
| 1000 Park Ave Unit C203 Park City, UT | 3.0 | 3.0 | 1704 | $6,500 | $3.81 | 23d | 1 | 0.24mi |
| 670 Deer Valley Loop #11 Park City, UT | 3.0 | 3.0 | 1815 | $8,200 | $4.52 | 3d | 1 | 0.42mi |
| 214 Woodside Ave Park City, UT | 3.0 | 3.5 | 2500 | $8,500 | $3.40 | 21d | 1 | 0.43mi |
| 1670 Deer Valley Dr N Park City, UT | 3.0 | 3.0 | 2090 | $7,500 | $3.59 | 21d | 1 | 0.90mi |
| 1521 Three Kings Dr Park City, UT | 3.0 | 2.5 | 1349 | $4,000 | $2.97 | 2d | 1 | 0.97mi |
| 1975 Paddington Dr #1975 Park City, UT | 3.0 | 2.5 | 2100 | $5,000 | $2.38 | 23d | 1 | 1.14mi |
| 2410 Deer Lake Dr Unit NA Park City, UT | 2.0 | 3.0 | 1728 | $6,500 | $3.76 | 3d | 1 | 1.17mi |
| 2317 Calumet Cir Park City, UT | 3.0 | 2.5 | 1909 | $5,000 | $2.62 | 23d | 1 | 1.41mi |
HOA detail condo
- Monthly dues
- $1,488 · $17,856/yr
- Assessments
- None detected in remarks — confirm with the listing agent.
Listing history 15 events
-
2026-06-18days on market $640,000 Active 111 DOM
-
2026-06-17days on market $640,000 Active 110 DOM
-
2026-06-16days on market $640,000 Active 109 DOM
-
2026-06-15days on market $640,000 Active 108 DOM
-
2026-06-13days on market $640,000 Active 106 DOM
-
2026-06-13days on market $640,000 Active 105 DOM
-
2026-06-09days on market $640,000 Active 102 DOM
-
2026-06-08days on market $640,000 Active 101 DOM
-
2026-06-07days on market $640,000 Active 100 DOM
-
2026-06-03days on market $640,000 Active 96 DOM
-
2026-06-02days on market $640,000 Active 95 DOM
-
2026-06-01days on market $640,000 Active 94 DOM
-
2026-05-31days on market $640,000 Active 93 DOM
-
2026-02-27$640,000 Active
Show marketing remark (53 chars)
Old Town Fractional Steps from Skiing and Main Street
-
2026-02-27$640,000 Active 53-char remark
Show marketing remark (53 chars)
Old Town Fractional Steps from Skiing and Main Street
ⓘ Source: listings_history table (triggers on properties + properties_extension) + one-shot
backfill from property_details.listing_events for pre-trigger history.
Climate risk First Street
- Flood 8/10 Severe FEMA zone X (unshaded) · 99% chance over 30 yrs
- Wildfire 7/10 Severe
- Heat 1/10 Low 8 d/yr ≥81°F today · 21 d/yr by 30 yrs out
- Wind 1/10 Low
- Air quality 3/10 Moderate 3 unhealthy d/yr today · 4 by 30 yrs out
Nearby sold comps map
Loading sold comps map…
Walkable amenities ~0.75 mi
Loading nearby amenities…
Taxation est. · year 1
- Rental income
- $71,766
- − Mortgage interest
- −$35,850
- − Property taxes
- −$9,600
- − Insurance
- −$3,998
- − Repairs & maintenance
- −$5,741
- − Management
- −$5,741
- − HOA
- −$17,856
- − Depreciation
- −$18,618
- Taxable loss
- −$25,638
- Est. tax savings @ 24.0%
- +$6,153
- After-tax cash flow
- $-8,880/yr
For passive investors: Depreciation is non-cash, so a rental often shows a tax loss while cash-flowing — sheltering income. Rental losses are passive: they offset passive income freely, and up to $25,000/yr can offset ordinary (W-2) income if you actively participate and your MAGI is under $100k (phasing out to $0 by $150k); unused losses carry forward. On sale, claimed depreciation is recaptured at up to 25%, and gains may owe capital-gains tax (a 1031 exchange can defer both). Figures are a year-1 estimate at your 24.0% rate — not tax advice; consult a CPA.
Schools (NCES district)
- District
- Park City District
- NCES district ID
- 4900750
- Math proficiency
- 46% ▼ -5.00%
- Reading proficiency
- 53% ▼ -2.00%
- Median HH income
- $103,108
- Composite
- 47.42/100
- National rank
- #2284
- State rank
- #9 of 80 in UT
Livability — Park City
- Score
- 72/100
- State rank
- #78
- US rank
- #6121
Category grades
Schools grade is shown separately in the Schools card above.
Census & demographics
- Census place
- Park City, UT
- County
- Summit County · 28,976 people
- City population
- 28,976
- Metro
- Heber, UT
- Population (ZIP)
- 8,619
- Household income
- $128,295
- Rent vs Own
- Severe rent burden
- 223.0
Population outlook (Summit County) Hauer SSP2
- Today (2025)
- 48,272 people
- By 2030
- 52,532 · +8.8%
- By 2040
- 60,766 · +25.9%
- By 2050
- 68,678 · +42.3%
- By 2075
- 90,024 · +86.5%
- By 2100
- 107,150 · +122.0%
Race, ethnicity, and origin ACS 2023
- Neighborhood character
- Predominantly White (78%)
- Race & ethnicity
- White 78% Hispanic / Latino 16% Two or more races 6% Asian 3% Black 1%
- Hispanic origin (detail)
- Mexican 12%
- Common ancestry
- Italian 7% Lithuanian 6% Slovak 4%
- Foreign-born
- 13% · Canada
- Languages at home
- 79% English-only · Spanish 16% Tagalog/Filipino 2% French/Haitian/Cajun 1%
Political lean MEDSL · Summit
- 2024 margin
- D (+14.8) · D 56.5% · R 41.7% · Other 1.9%
- 2008→2024 swing
- -0.5pp no change · 2008: 15.3pp · 2024: 14.8pp
- All cycles
- 2024: D+14.8 2020: D+19.1 2016: D+15.4 2012: R+4.9 2008: D+15.3
Not yet ingested
- Civics
- —
Market trends
- HPI YoY
- ▲ 6.67%
- Current HPI
- 318.2413
- Rent YoY
- —
- Metro
- Heber, UT
- State GDP YoY
- ▲ 3.54%
- F500 in state
- 2
Industry mix (Fortune 500 HQ in UT)
| Industry | F500 HQs | Revenue |
|---|---|---|
| Financial Services | 1 | $3B |
|
||
Price history
+0.0% since first listed2 events — show timeline
- 2026-02-27 Listed $640,000 WFRMLS
- 2026-02-27 Listed $640,000 PCMLS
Cash-flow waterfall
monthlySold comps — $/sqft
last 12 mo · ≤1 miLoading sold comps…