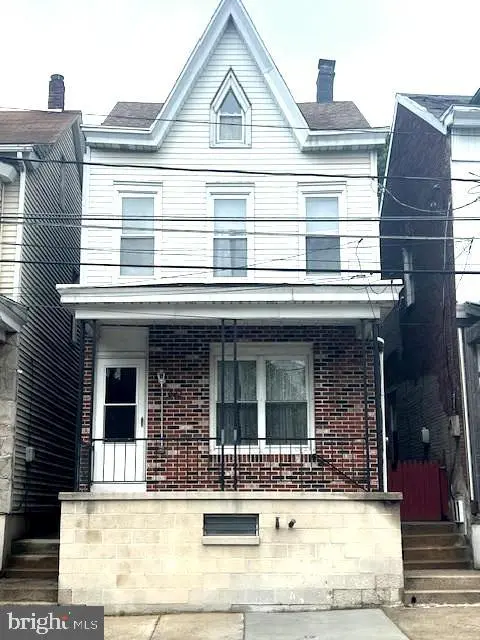
222 Dock St · Schuylkill Haven, PA
Flood risk 4/10 · Minor
- FEMA flood zone
- X (unshaded)
- Chance of flooding over 30 yrs
- 0.22%
- Est. flood insurance / yr
- $473 – $860
Fire risk 1/10 · Minimal
- Est. fire insurance / yr
- $511 – $949
Heat risk 4/10 · Minor
- Hot days now (above 97°F)
- 7 days/yr
- Hot days in 30 yrs
- 16 days/yr
Wind risk 4/10 · Minor
- Chance of severe wind over 30 yrs
- 8.0%
Air-quality risk 2/10 · Minimal
- Unhealthy air days now
- 1 days/yr
- Unhealthy air days in 30 yrs
- 2 days/yr
Risk factors via First Street. Map © Google.
Why this score? — see what drove the D+ grade
The composite is a weighted blend of 9 inputs, each scored 0–100. Each bar is that input's sub-score; the figure is the points it added to the 100-point composite (weight × sub-score).
- Cash flow +16.0/30.0
- ARV discount +9.0/15.0
- DSCR +5.0/10.0
- 1% rule +4.4/10.0
- Livability +4.0/5.0
- Schools +3.6/10.0
- Rent growth +2.5/5.0
- Condition / age +2.5/5.0
- Appreciation +0.0/10.0
$159,900
🖨 Deal sheet 📄 Offer letter ✓ Due diligence
Listing remarks
Nestled in the charming community of Schuylkill Haven, this traditional detached home offers a unique blend of historic character and modern convenience. With three separate bedrooms and a full bath, newer carpet in the two living rooms, lovely wooden pocket doors , large yard, cute ally , side porch and front porch . .The unfinished basement provides ample storage . The neighborhood boasts a vibrant community spirit, with local parks just a stone's throw away, perfect for leisurely strolls or weekend picnics. Enjoy the convenience of off-street parking for two vehicles, ensuring easy access to your home. Schuylkill Haven is not just a place to live; it's a lifestyle. With friendly neighbor
Key facts
- Modern convenience
- Large yard
- Historic character
Tags
Property features AI
Finance
- Other: Fee simple ownership; Pets allowed with no restrictions
Exterior
- Parking: Off-street parking for two vehicles (total 2 parking spaces)
- Utilities: Public water; Public sewer; Electric service (standard)
- Home design: Detached home; Estimated year built
- Construction: Combination construction materials; Stone foundation; Architectural shingle / asphalt roof
- Exterior features: Not in a federal flood zone; No tidal water on the lot; Above-grade other structures
Interior
- Bedrooms: Three bedrooms on the main level
- Bathrooms: One full bathroom (main level)
- Heating & cooling: Radiator heating; Oil-fired hot water
- Interior features: Estimated living area; Unfinished basement; Two or more access exits
Neighborhood map
What this means for you Summary
Snapshot
- This is a 3-bed/1.0-bath single-family listed at $160k.
Deal economics
- At list price, monthly cash flow is $80 ($960/yr) — positive.
- The deal already cash-flows at list — no discount required.
- To meet the 1% rule (rent ≥ 1% of price), the offer needs to be $150k (6.2% below list).
- Recommended offer: $150k (6.2% below list) — sets the bar for 1% rule.
Location & tenants
- Location reads 80/100 on livability (#197 in PA, #1,714 nationally) — a professional / high-income tenant draw. Strengths: crime A+, cost of living A+, housing A+; Watch: amenities C-, commute F, employment F.
- Schuylkill Haven Area SD (town): math 27% / reading 56% proficiency, ranked #330 of 539 in PA (top 61%) — families likely to look elsewhere, expect single-tenant / working-renter base with shorter leases.
- Market conditions: 52 active listings in the ZIP; 1 comparable units currently listed for rent nearby; 169 units permitted in Schuylkill County in 2024 (0 in 5+ unit buildings).
Forward outlook
- Local home prices are declining (-3.0%/yr); year-one equity from $1k of loan paydown is wiped out by about $5k of value loss. Plan a longer hold.
- Schuylkill County population projected at -16% by 2050 — secular population decline; favor cash flow + early exit over multi-decade hold.
Negotiation context
- It's been on market 16 days — a 2% lower offer ($158k) is reasonable based on typical stale-listing flexibility.
Risks & watch-outs
- Watch-outs: built in 1906 — expect roof / HVAC / electrical / plumbing capex.
Questions for the listing agent
- Built in 1906 — when were the roof, HVAC, electrical panel, plumbing, and water heater last replaced?
- Is there a deadline driving the sale (1031 exchange, divorce, estate, relocation)? That informs how much negotiation room exists.
- Schools are B-rated — typically a magnet for longer-tenancy family renters. What's the average tenant stay here, and is there a school-zone premium baked into asking?
- The area grade is low — what's the realistic commute time and amenity access for the typical tenant pool here? Any planned neighborhood developments (good or bad) we should know about?
- What's the average days-on-market for RENTAL listings here right now (not sales)? A rising rental-DOM trend means longer vacancies and softer asking-rent achievability than the comps imply.
- What's the recent tenant-quality profile in this submarket — average credit score on applications, eviction rate, late-payment / NSF rate, and stable-employment percentage? A property-management company in the area should have these aggregated.
- How much new for-sale + rental construction is in the pipeline within 1–3 miles? Heavy new supply typically softens prices + rents 12–24 months out; constrained supply supports both.
Investment metrics
- 1% rule
- 0.94% ✗
- Cap rate
- 6.89%
- Cash-on-cash
- 2.14%
- DSCR
- 1.10
- GRM
- 8.9
CMA / ARV
- ARV (median comp)
- $165,452
- List price
- $159,900
- Delta
- -3.36%
- Verdict
- FAIR
- Comps
- 20 within 1.0 mi
Show comp detail 12 sales within ~0.75 mi
| Address | Dist | Beds/Ba | Sqft | Sold | Price | $/sf | Match |
|---|---|---|---|---|---|---|---|
| 50 Stanton St | 0.21mi | 4/2.5 (+1) | 1,680 (-2%) | 6mo | $290,000 | $173 | 70 |
| 306 E Main St | 0.24mi | 3/2.0 | 1,598 (-7%) | 4mo | $160,000 | $100 | 70 |
| 409 St John | 0.55mi | 3/1.0 | 1,669 (-3%) | 5mo | $133,500 | $80 | 65 |
| 206 High St | 0.43mi | 4/1.5 (+1) | 1,775 (+3%) | 8mo | $230,000 | $130 | 62 |
| 202 High St | 0.42mi | 3/1.5 | 1,568 (-9%) | 3mo | $179,900 | $115 | 61 |
| 140 W Main St | 0.49mi | 4/1.5 (+1) | 1,777 (+3%) | 4mo | $147,500 | $83 | 61 |
| 120 Ave E | 0.51mi | 3/2.0 | 1,571 (-9%) | 4mo | $300,000 | $191 | 54 |
| 609 Hillcroft Ave | 0.69mi | 4/2.5 (+1) | 1,720 (-0%) | 4mo | $244,000 | $142 | 53 |
| 135 W Columbia St | 0.55mi | 4/1.0 (+1) | 1,570 (-9%) | 3mo | $165,000 | $105 | 52 |
| 611 N Orchard Ave | 0.67mi | 3/2.5 | 1,800 (+4%) | 4mo | $373,765 | $208 | 52 |
| 24 N Berne St | 0.66mi | 4/1.5 (+1) | 1,878 (+9%) | 4mo | $141,000 | $75 | 44 |
| 429 W Columbia St | 0.72mi | 3/1.5 | 1,472 (-14%) | 3mo | $178,000 | $121 | 38 |
Match score weights: distance 35% · size 25% · config 20% · recency 20%. Top-matched comps best support the ARV.
Projected returns pro-forma
-3.0% appreciation · 3.0% rent growth · sell at horizon
- IRR
- -12.9%
- Equity multiple
- 0.54×
- Total profit
- $-20,795
- Equity at exit
- $23,842
- IRR
- -3.9%
- Equity multiple
- 0.74×
- Total profit
- $-11,458
- Equity at exit
- $13,825
Cash invested: $44,772 (down + closing). Projections, not guarantees.
Landlord ↔ Tenant lean methodology
- Overall (STATE)
- 62 Landlord-Friendly
- State Pennsylvania
- 62 Landlord-Friendly · EVEN
- County
- — inherits STATE
- City
- — inherits STATE
ZIP-level market 17972
- Home prices YoY
- -9.1%
- Active inventory
- 52
- Price-to-rent
- 8.9×
Monthly cashflow live
- Estimated rent
- $1,500 medium interval (Pro) →
- Mortgage (P&I)
- −$839
- Tax est. 1.5%
- −$200 /mo · $2,398/yr
- Insurance
- −$67
- HOA
- −$0
- Vacancy / Maint / Mgmt
- −$315
- Net cashflow
- $80
Break-even live
UW: 25.0% down · 7.5% · 30yr · 1.5% tax · 5.0% vac · 8.0% maint · 8.0% mgmt
Financing live
Cash to close
- Down payment
- $39,975
- Closing costs
- $4,797
- Reserves months
- —
- Total cash needed
- —
Loan-product check · same deal, 3 products live
Conventional
25% down · 7.5% · 30yr
- Down + closing
- —
- Monthly P&I
- —
- Monthly cashflow
- —
- DSCR
- —
- Eligible?
- —
Personal DTI + credit; lowest rate.
DSCR
20% down · 8.5% · 30yr
- Down + closing
- —
- Monthly P&I
- —
- Monthly cashflow
- —
- DSCR
- —
- Eligible?
- —
No personal income docs; deal must DSCR.
Hard money
10% down · 12.0% · 12mo
- Down + closing
- —
- Monthly P&I
- —
- Monthly cashflow
- —
- DSCR
- —
- Eligible?
- —
Short-term bridge; refi at stabilization.
Rent comps 1 comps
| Address | Beds | Baths | Sqft | Rent | $/sqft | DOM | Units | Dist |
|---|---|---|---|---|---|---|---|---|
| 136 W Main St Schuylkill Haven, PA | 3.0 | 2.0 | 1400 | $1,500 | $1.07 | 43d | 1 | 0.50mi |
Listing history 1 events
-
2026-05-07$159,000 Active 968-char remark
ⓘ Source: listings_history table (triggers on properties + properties_extension) + one-shot
backfill from property_details.listing_events for pre-trigger history.
Climate risk First Street
- Flood 4/10 Moderate FEMA zone X (unshaded) · 22% chance over 30 yrs
- Wildfire 1/10 Low
- Heat 4/10 Moderate 7 d/yr ≥97°F today · 16 d/yr by 30 yrs out
- Wind 4/10 Moderate 8% chance of damaging wind over 30 yrs
- Air quality 2/10 Low 1 unhealthy d/yr today · 2 by 30 yrs out
Nearby sold comps map
Loading sold comps map…
Walkable amenities ~0.75 mi
Loading nearby amenities…
Taxation est. · year 1
- Rental income
- $18,000
- − Mortgage interest
- −$8,957
- − Property taxes
- −$2,398
- − Insurance
- −$800
- − Repairs & maintenance
- −$1,440
- − Management
- −$1,440
- − Depreciation
- −$4,652
- Taxable loss
- −$1,687
- Est. tax savings @ 24.0%
- +$405
- After-tax cash flow
- $1,364/yr
For passive investors: Depreciation is non-cash, so a rental often shows a tax loss while cash-flowing — sheltering income. Rental losses are passive: they offset passive income freely, and up to $25,000/yr can offset ordinary (W-2) income if you actively participate and your MAGI is under $100k (phasing out to $0 by $150k); unused losses carry forward. On sale, claimed depreciation is recaptured at up to 25%, and gains may owe capital-gains tax (a 1031 exchange can defer both). Figures are a year-1 estimate at your 24.0% rate — not tax advice; consult a CPA.
Schools (NCES district)
- District
- Schuylkill Haven Area SD
- NCES district ID
- 4220910
- Math proficiency
- 27% ▼ -15.00%
- Reading proficiency
- 56% ▼ -11.00%
- Median HH income
- $51,147
- Composite
- 35.73/100
- National rank
- #4857
- State rank
- #330 of 539 in PA
Livability — Schuylkill Haven
- Score
- 80/100
- State rank
- #197
- US rank
- #1714
Category grades
Schools grade is shown separately in the Schools card above.
Census & demographics
- Census place
- Schuylkill Haven, PA
- Population (ZIP)
- 11,294
Population outlook (Schuylkill County) Hauer SSP2
- Today (2025)
- 137,447 people
- By 2030
- 133,121 · -3.1%
- By 2040
- 124,172 · -9.7%
- By 2050
- 115,611 · -15.9%
- By 2075
- 100,796 · -26.7%
- By 2100
- 86,667 · -36.9%
Race, ethnicity, and origin ACS 2023
- Neighborhood character
- Predominantly White (92%)
- Race & ethnicity
- White 92% Two or more races 5% Hispanic / Latino 3% Asian 2%
- Common ancestry
- Romanian 5% Iranian 3% Lithuanian 3%
- Foreign-born
- 1%
- Languages at home
- 97% English-only · Spanish 1% German/W. Germanic 1% Other Asian/Pacific 1%
Political lean MEDSL · Schuylkill
- 2024 margin
- Solid R (+42.1) · D 28.5% · R 70.6%
- 2008→2024 swing
- -33.4pp toward R · 2008: -8.7pp · 2024: -42.1pp
- All cycles
- 2024: R+42.1 2020: R+39.9 2016: R+43.4 2012: R+13.4 2008: R+8.7
Not yet ingested
- Civics
- —
Market trends
- HPI YoY
- ▼ -21.14%
- Current HPI
- 212.0474
- Rent YoY
- —
- Metro
- —
- State GDP YoY
- ▲ 1.68%
- F500 in state
- 34
Industry mix (Fortune 500 HQ in PA)
| Industry | F500 HQs | Revenue |
|---|---|---|
| Healthcare | 2 | $309B |
|
||
| Insurance | 2 | $27B |
|
||
| Telecommunications / Media | 1 | $124B |
|
||
| Industrial Distribution | 1 | $22B |
|
||
| Financial Services | 1 | $20B |
|
||
| Chemicals / Materials | 1 | $18B |
|
||
Price history
+0.6% since first listed3 events — show timeline
- 2026-05-23 Pending — BRIGHT MLS
- 2026-05-23 Price Changed $159,900 BRIGHT MLS
- 2026-05-07 Listed $159,000 BRIGHT MLS
Property tax history
+22.5%/yrLatest (2026): $11,097 · +710.2% YoY. Source: county tax records.
Cash-flow waterfall
monthlySold comps — $/sqft
last 12 mo · ≤1 miLoading sold comps…