 🏷️ Likely Rental
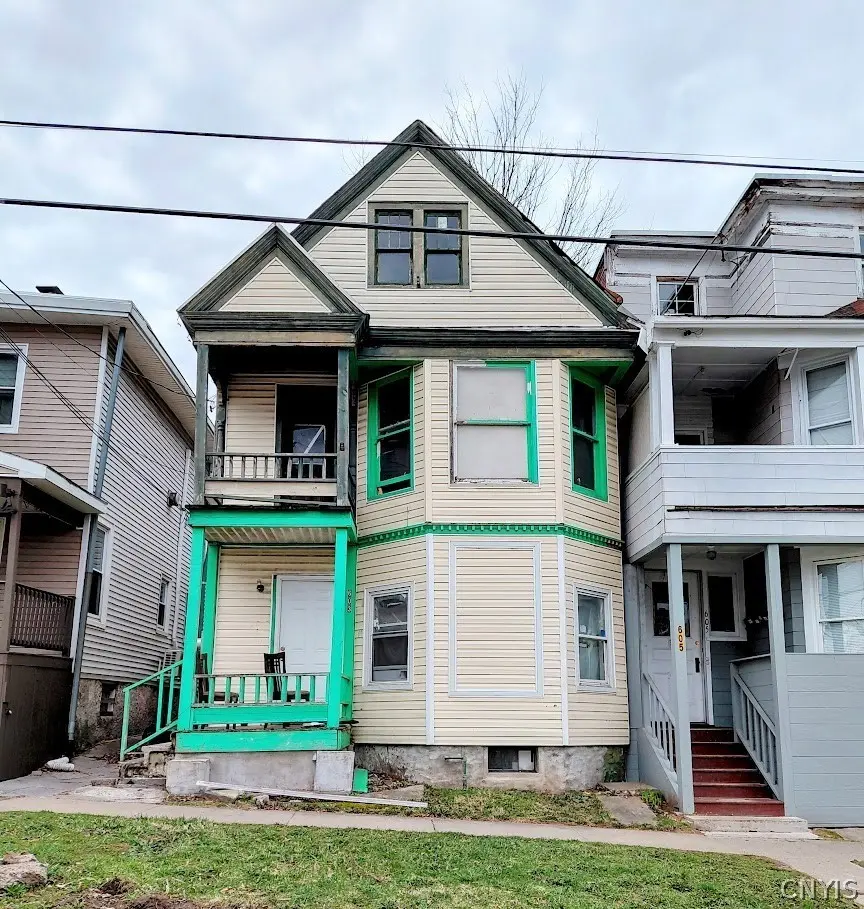
603 William St · Utica, NY
Flood risk 1/10 · Minimal
- FEMA flood zone
- X (unshaded)
- Chance of flooding over 30 yrs
- 0.0%
- Est. flood insurance / yr
- $473 – $860
Fire risk 2/10 · Minimal
- Est. fire insurance / yr
- $691 – $1,283
Heat risk 3/10 · Minor
- Hot days now (above 95°F)
- 7 days/yr
- Hot days in 30 yrs
- 16 days/yr
Wind risk 1/10 · Minimal
- Chance of severe wind over 30 yrs
- 1.0%
Air-quality risk 2/10 · Minimal
- Unhealthy air days now
- 0 days/yr
- Unhealthy air days in 30 yrs
- 1 days/yr
Risk factors via First Street. Map © Google.
Why this score? — see what drove the B+ grade
The composite is a weighted blend of 9 inputs, each scored 0–100. Each bar is that input's sub-score; the figure is the points it added to the 100-point composite (weight × sub-score).
- Cash flow +30.0/30.0
- ARV discount +15.0/15.0
- 1% rule +10.0/10.0
- DSCR +10.0/10.0
- Livability +4.0/5.0
- Schools +2.9/10.0
- Rent growth +2.5/5.0
- Condition / age +2.5/5.0
- Appreciation +0.0/10.0
$69,000
🖨 Deal sheet 📄 Offer letter ✓ Due diligence
Listing remarks MLS
Single family with 4 bedrooms and 2 full baths. Can be used as investment as property is currently tenant occupied. Almost zero exterior maintenance required. Steps away from Munson Arts. Street parking only. Photos were taken prior to tenant move in. Rent is $1,011 ($711 paid by section 8, remained paid by tenant). Rent includes water. Property is being sold in as is condition.
Key facts
- Built 1900
- Listed 59 days
Tags
Neighborhood map
What this means for you Summary
Snapshot
- This is a 4-bed/2.0-bath single-family listed at $69k.
Deal economics
- At list price, monthly cash flow is $939 ($11k/yr) — positive.
- The deal already cash-flows at list — no discount required.
- Meets the 1% rule at list price ($2k rent vs $69k).
- Recommended offer: $67k (3.0% below list) — sets the bar for market timing.
- Cap rate 22.6% vs local median 7.7% in Utica — top-decile yield for the area; either an underpriced asset or a hidden risk that comps aren't pricing in. Stress-test before assuming the spread holds.
Location & tenants
- Location reads 80/100 on livability (#104 in NY, #1,589 nationally) — a professional / high-income tenant draw. Strengths: commute A+, cost of living A+, housing A+; Watch: employment D, schools D-, crime F.
- Utica City School District (urban): math 33% / reading 38% proficiency, ranked #562 of 590 in NY (top 95%) — families likely to look elsewhere, expect single-tenant / working-renter base with shorter leases; 71% free/reduced lunch — lower-income household profile, screen leases tightly.
- Market conditions: 150 active listings in the ZIP; 5 comparable units currently listed for rent nearby; rentals lingering (median 44d on market — plan ~5-8 weeks vacancy on turnover, expect pricing pressure); 100% of comp listings sitting > 30 days — soft ceiling on asking rent; 204 units permitted in Oneida County in 2024 (68 in 5+ unit buildings).
- This rent runs 37% of the median local income ($58k/yr) — at the standard rent-burdened threshold; future hikes will face affordability resistance.
Forward outlook
- Local home prices are declining (-3.0%/yr); year-one equity from $477 of loan paydown is wiped out by about $2k of value loss. Plan a longer hold.
- Oneida County population projected at -12% by 2050 — secular population decline; favor cash flow + early exit over multi-decade hold.
- At projected returns (-3.0% appreciation + 3.0% rent growth), your $19k cash investment doubles in ~2 years — after that, you're playing with house money.
Negotiation context
- It's been on market 60 days — a 3% lower offer ($67k) is reasonable based on typical stale-listing flexibility.
- 4 sale attempts since 5y ago; this cycle's ask has dropped $20k (22%) from the opening price — seller is motivated, your offer sets the floor, not the list.
- Current owner paid $35k; list at $69k implies a 97% gain — meaningful room to come down on a strong offer.
Risks & watch-outs
- Watch-outs: built in 1900 — expect roof / HVAC / electrical / plumbing capex.
Questions for the listing agent
- It's been on market 60 days. Have you received any prior offers? Is the seller open to a 3% concession, seller financing, or rate buy-down credit?
- Built in 1900 — when were the roof, HVAC, electrical panel, plumbing, and water heater last replaced?
- Is there a deadline driving the sale (1031 exchange, divorce, estate, relocation)? That informs how much negotiation room exists.
- Schools are D-rated, which usually means shorter tenancies and higher turnover. Who's the typical renter profile here, and what's been the actual vacancy rate?
- Crime grade is F in this area — have there been break-ins, vandalism, or insurance claims at this property in the last 3 years? What carrier currently insures it and at what premium?
- What's the average days-on-market for RENTAL listings here right now (not sales)? A rising rental-DOM trend means longer vacancies and softer asking-rent achievability than the comps imply.
- What's the recent tenant-quality profile in this submarket — average credit score on applications, eviction rate, late-payment / NSF rate, and stable-employment percentage? A property-management company in the area should have these aggregated.
- How much new for-sale + rental construction is in the pipeline within 1–3 miles? Heavy new supply typically softens prices + rents 12–24 months out; constrained supply supports both.
Investment metrics
- 1% rule
- 2.56% ✓
- Cap rate
- 22.62%
- Cash-on-cash
- 58.32%
- DSCR
- 3.59
- GRM
- 3.3
CMA / ARV
- ARV (median comp)
- $94,790
- List price
- $69,000
- Delta
- -27.21%
- Verdict
- UNDERPRICED
- Comps
- 20 within 1.0 mi
Show comp detail 12 sales within ~0.75 mi
| Address | Dist | Beds/Ba | Sqft | Sold | Price | $/sf | Match |
|---|---|---|---|---|---|---|---|
| 721 Bristol St | 0.18mi | 3/2.0 (-1) | 1,380 (+1%) | 7mo | $175,000 | $127 | 79 |
| 919 Lenox Ave | 0.45mi | 4/2.0 | 1,376 (+1%) | 8mo | $80,000 | $58 | 71 |
| 832 Waverly Pl | 0.53mi | 4/1.0 | 1,352 (-1%) | 5mo | $85,000 | $63 | 66 |
| 1517 Miller St | 0.74mi | 4/2.0 | 1,364 (0%) | 0mo | $60,000 | $44 | 65 |
| 822 E Warren St W | 0.27mi | 5/1.5 (+1) | 1,464 (+7%) | 9mo | $94,000 | $64 | 60 |
| 1305 Oak St | 0.73mi | 5/1.5 (+1) | 1,368 (+0%) | 2mo | $76,000 | $56 | 57 |
| 1103 Oak St | 0.60mi | 3/1.0 (-1) | 1,372 (+1%) | 9mo | $63,000 | $46 | 54 |
| 1114 Stark St | 0.32mi | 3/2.0 (-1) | 1,567 (+15%) | 2mo | $148,400 | $95 | 54 |
| 1308 Maple St | 0.71mi | 3/2.0 (-1) | 1,275 (-6%) | 10mo | $205,000 | $161 | 43 |
| 1216 Oak St | 0.66mi | 3/1.0 (-1) | 1,196 (-12%) | 3mo | $69,000 | $58 | 37 |
| 1310 Oak St | 0.74mi | 3/1.0 (-1) | 1,254 (-8%) | 7mo | $160,000 | $128 | 37 |
| 905 Shaw St | 0.70mi | 3/1.0 (-1) | 1,212 (-11%) | 10mo | $180,000 | $149 | 31 |
Match score weights: distance 35% · size 25% · config 20% · recency 20%. Top-matched comps best support the ARV.
Projected returns pro-forma
-3.0% appreciation · 3.0% rent growth · sell at horizon
- IRR
- 56.9%
- Equity multiple
- 3.52×
- Total profit
- $48,638
- Equity at exit
- $10,288
- IRR
- 61.8%
- Equity multiple
- 7.18×
- Total profit
- $119,421
- Equity at exit
- $5,966
Cash invested: $19,320 (down + closing). Projections, not guarantees.
Landlord ↔ Tenant lean methodology
- Overall (STATE)
- 15 Strongly Tenant-Friendly
- State New York
- 15 Strongly Tenant-Friendly · D+10
- County
- — inherits STATE
- City
- — inherits STATE
ZIP-level market 13502
- Home prices YoY
- -12.1%
- Active inventory
- 150
- Price-to-rent
- 3.3×
Monthly cashflow live
- Estimated rent
- $1,768 high interval (Pro) →
- Mortgage (P&I)
- −$362
- Tax from tax record
- −$67 /mo · $804/yr
- Insurance
- −$29
- HOA
- −$0
- Vacancy / Maint / Mgmt
- −$371
- Net cashflow
- $939
Break-even live
UW: 25.0% down · 7.5% · 30yr · 1.5% tax · 5.0% vac · 8.0% maint · 8.0% mgmt
Financing live
Cash to close
- Down payment
- $17,250
- Closing costs
- $2,070
- Reserves months
- —
- Total cash needed
- —
Loan-product check · same deal, 3 products live
Conventional
25% down · 7.5% · 30yr
- Down + closing
- —
- Monthly P&I
- —
- Monthly cashflow
- —
- DSCR
- —
- Eligible?
- —
Personal DTI + credit; lowest rate.
DSCR
20% down · 8.5% · 30yr
- Down + closing
- —
- Monthly P&I
- —
- Monthly cashflow
- —
- DSCR
- —
- Eligible?
- —
No personal income docs; deal must DSCR.
Hard money
10% down · 12.0% · 12mo
- Down + closing
- —
- Monthly P&I
- —
- Monthly cashflow
- —
- DSCR
- —
- Eligible?
- —
Short-term bridge; refi at stabilization.
Rent comps 5 comps
| Address | Beds | Baths | Sqft | Rent | $/sqft | DOM | Units | Dist |
|---|---|---|---|---|---|---|---|---|
| 1224 Whitesboro St Unit 1 Utica, NY | 3.0 | 1.0 | 1100 | $1,125 | $1.02 | 43d | 1 | 0.71mi |
| 1124 Dudley Ave Unit 1 Utica, NY | 3.0 | 1.0 | 1300 | $1,400 | $1.08 | 43d | 1 | 0.79mi |
| 1804 Storrs Ave Utica, NY | 3.0 | 1.5 | 1633 | $3,000 | $1.84 | 43d | 1 | 1.08mi |
| 1503 Fox Pl Utica, NY | 3.0 | 1.0 | 1119 | $2,000 | $1.79 | 43d | 1 | 1.36mi |
| 807 Eagle St Utica, NY | 3.0 | 1.0 | 1526 | $1,300 | $0.85 | 43d | 1 | 1.41mi |
Listing history 30 events
-
2026-06-19days on market $69,000 Active 60 DOM
-
2026-06-18days on market $69,000 Active 59 DOM
-
2026-06-17days on market $69,000 Active 58 DOM
-
2026-06-16days on market $69,000 Active 57 DOM
-
2026-06-15price $69,000 Active 56 DOM
-
2026-06-15days on market $75,000 Active 56 DOM
-
2026-06-14days on market $75,000 Active 54 DOM
-
2026-06-13days on market $75,000 Active 53 DOM
-
2026-06-10days on market $75,000 Active 51 DOM
-
2026-06-09days on market $75,000 Active 50 DOM
-
2026-06-08days on market $75,000 Active 49 DOM
-
2026-06-07days on market $75,000 Active 48 DOM
-
2026-06-03days on market $75,000 Active 44 DOM
-
2026-06-02days on market $75,000 Active 43 DOM
-
2026-06-01days on market $75,000 Active 42 DOM
-
2026-05-31days on market $75,000 Active 41 DOM
-
2026-05-30days on market $75,000 Active 40 DOM
-
2026-05-04price $79,000 381-char remark
Show marketing remark (381 chars)
Single family with 4 bedrooms and 2 full baths. Can be used as investment as property is currently tenant occupied. Almost zero exterior maintenance required. Steps away from Munson Arts. Street parking only. Photos were taken prior to tenant move in. Rent is $1,011 ($711 paid by section 8, remained paid by tenant). Rent includes water. Property is being sold in as is condition.
-
2026-04-20$89,000 Active 381-char remark
Show marketing remark (381 chars)
Single family with 4 bedrooms and 2 full baths. Can be used as investment as property is currently tenant occupied. Almost zero exterior maintenance required. Steps away from Munson Arts. Street parking only. Photos were taken prior to tenant move in. Rent is $1,011 ($711 paid by section 8, remained paid by tenant). Rent includes water. Property is being sold in as is condition.
-
2023-07-07soldstatus $35,000 Closed Sale or Rented
-
2023-05-03status Pending Sale
-
2023-04-27status Under Contract- Do Not Show
-
2023-04-16price $44,900
-
2023-03-21$49,900 Active
-
2022-12-14historical
-
2022-11-07price $55,900
-
2022-10-10$59,900 Active
-
2021-11-08historical
-
2021-05-21$49,900 Active
-
2005-11-09soldstatus $13,000
ⓘ Source: listings_history table (triggers on properties + properties_extension) + one-shot
backfill from property_details.listing_events for pre-trigger history.
Tax reassessment forecast NY · Partial reset (capped growth)
- Current annual tax
- $804 · $67/mo
- Projected year-2 tax
- $985 · $82/mo
- Expected delta
- +$181/yr (+$15/mo · 22.5%)
ⓘ Screening estimate from a state-policy table — verify with the county assessor before closing.
Climate risk First Street
- Flood 1/10 Low FEMA zone X (unshaded) · 0% chance over 30 yrs
- Wildfire 2/10 Low
- Heat 3/10 Moderate 7 d/yr ≥95°F today · 16 d/yr by 30 yrs out
- Wind 1/10 Low 100% chance of damaging wind over 30 yrs
- Air quality 2/10 Low 0 unhealthy d/yr today · 1 by 30 yrs out
Nearby sold comps map
Loading sold comps map…
Walkable amenities ~0.75 mi
Loading nearby amenities…
Taxation est. · year 1
- Rental income
- $21,214
- − Mortgage interest
- −$3,865
- − Property taxes
- −$804
- − Insurance
- −$345
- − Repairs & maintenance
- −$1,697
- − Management
- −$1,697
- − Depreciation
- −$2,007
- Taxable income
- $10,798
- Est. tax owed @ 24.0%
- −$2,592
- After-tax cash flow
- $8,676/yr
For passive investors: Depreciation is non-cash, so a rental often shows a tax loss while cash-flowing — sheltering income. Rental losses are passive: they offset passive income freely, and up to $25,000/yr can offset ordinary (W-2) income if you actively participate and your MAGI is under $100k (phasing out to $0 by $150k); unused losses carry forward. On sale, claimed depreciation is recaptured at up to 25%, and gains may owe capital-gains tax (a 1031 exchange can defer both). Figures are a year-1 estimate at your 24.0% rate — not tax advice; consult a CPA.
Schools (NCES district)
- District
- Utica City School District
- NCES district ID
- 3629370
- Math proficiency
- 33% ▼ -7.00%
- Reading proficiency
- 38% ▲ 2.00%
- Median HH income
- $31,834
- Composite
- 29.01/100
- National rank
- #6613
- State rank
- #562 of 590 in NY
Livability — Utica
- Score
- 80/100
- State rank
- #104
- US rank
- #1589
Category grades
Schools grade is shown separately in the Schools card above.
Census & demographics
- Census place
- Utica, NY
- County
- Oneida County · 89,710 people
- City population
- 72,968
- Metro
- Utica-Rome, NY
- Population (ZIP)
- 34,037
- Household income
- $57,835
- Rent vs Own
- Severe rent burden
- 1604.0
Population outlook (Oneida County) Hauer SSP2
- Today (2025)
- 225,223 people
- By 2030
- 220,384 · -2.1%
- By 2040
- 209,071 · -7.2%
- By 2050
- 197,920 · -12.1%
- By 2075
- 175,541 · -22.1%
- By 2100
- 148,491 · -34.1%
Race, ethnicity, and origin ACS 2023
- Neighborhood character
- Predominantly White (71%)
- Race & ethnicity
- White 71% Hispanic / Latino 11% Black 9% Two or more races 7% Asian 5%
- Hispanic origin (detail)
- Mexican 2% Puerto Rican 5% Dominican 2%
- Common ancestry
- Romanian 11% Lithuanian 3% American 2%
- Foreign-born
- 12% · Canada, Philippines, China
- Languages at home
- 81% English-only · Spanish 7% Russian/Polish/Slavic 4% Other Asian/Pacific 3%
Political lean MEDSL · Oneida
- 2024 margin
- Strong R (+21.3) · D 39.4% · R 60.6%
- 2008→2024 swing
- -15.2pp toward R · 2008: -6.1pp · 2024: -21.3pp
- All cycles
- 2024: R+21.3 2020: R+15.5 2016: R+21.1 2012: R+5.3 2008: R+6.1
Not yet ingested
- Civics
- —
Market trends
- HPI YoY
- ▼ -50.76%
- Current HPI
- 368.3955
- Rent YoY
- —
- Metro
- Utica-Rome, NY
- State GDP YoY
- ▲ 2.60%
- F500 in state
- 92
Industry mix (Fortune 500 HQ in NY)
| Industry | F500 HQs | Revenue |
|---|---|---|
| Financial Services | 10 | $950B |
|
||
| Consumer Goods | 9 | $162B |
|
||
| Insurance | 4 | $225B |
|
||
| Telecommunications | 2 | $144B |
|
||
| Pharmaceuticals | 2 | $112B |
|
||
| Media / Entertainment | 2 | $69B |
|
||
Price history
+507.7% since first listed13 events — show timeline
- 2026-05-04 Price Changed $79,000 CNYIS
- 2026-04-20 Listed $89,000 CNYIS
- 2023-07-07 Sold (MLS) $35,000 CNYIS
- 2023-05-03 Pending — CNYIS
- 2023-04-27 Pending — CNYIS
- 2023-04-16 Price Changed $44,900 CNYIS
- 2023-03-21 Listed $49,900 CNYIS
- 2022-12-14 Listing Removed — CNYIS
- 2022-11-07 Price Changed $55,900 CNYIS
- 2022-10-10 Listed $59,900 CNYIS
- 2021-11-08 Listing Removed — CNYIS
- 2021-05-21 Listed $49,900 CNYIS
- 2005-11-09 Sold (Public Records) $13,000 Public Records
Property tax history
+3.4%/yrLatest (2025): $804 · -0.5% YoY. Source: county tax records.
Cash-flow waterfall
monthlySold comps — $/sqft
last 12 mo · ≤1 miLoading sold comps…