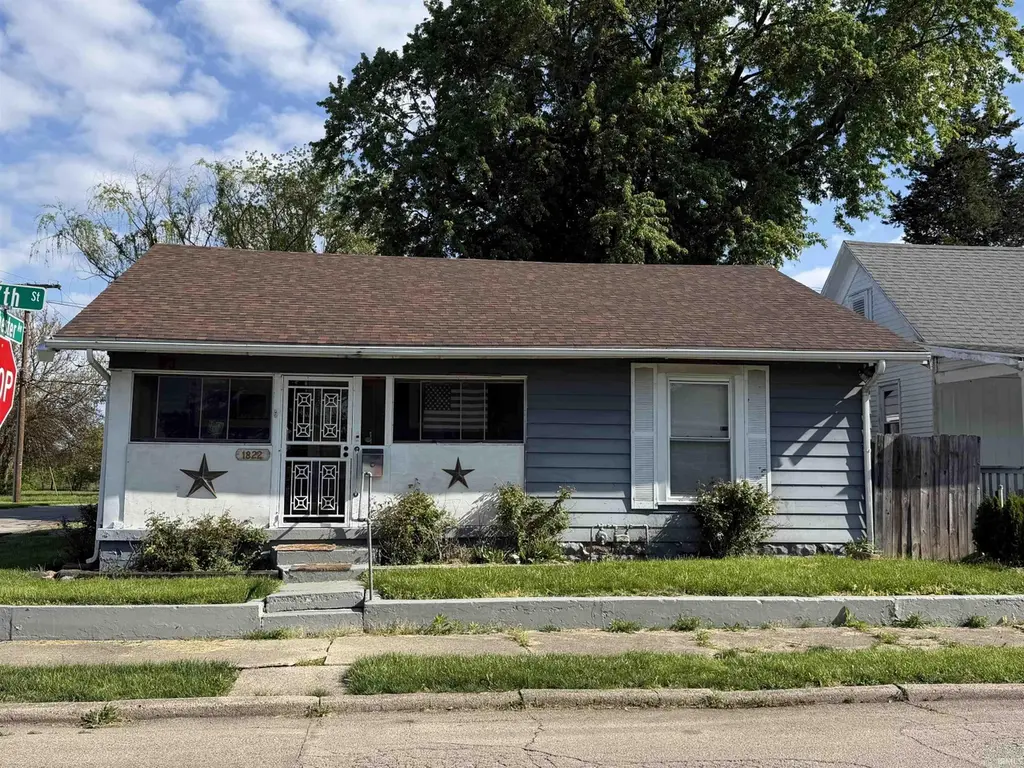
1822 W 7th St · Muncie, IN
Flood risk 1/10 · Minimal
- FEMA flood zone
- X (unshaded)
- Chance of flooding over 30 yrs
- 0.0%
- Est. flood insurance / yr
- $507 – $1,088
Fire risk 1/10 · Minimal
- Est. fire insurance / yr
- $717 – $1,331
Heat risk 3/10 · Minor
- Hot days now (above 100°F)
- 7 days/yr
- Hot days in 30 yrs
- 18 days/yr
Wind risk 2/10 · Minimal
- Chance of severe wind over 30 yrs
- 0.0%
Air-quality risk 3/10 · Minor
- Unhealthy air days now
- 2 days/yr
- Unhealthy air days in 30 yrs
- 3 days/yr
Risk factors via First Street. Map © Google.
Why this score? — see what drove the B+ grade
The composite is a weighted blend of 9 inputs, each scored 0–100. Each bar is that input's sub-score; the figure is the points it added to the 100-point composite (weight × sub-score).
- Cash flow +30.0/30.0
- ARV discount +15.0/15.0
- 1% rule +10.0/10.0
- DSCR +10.0/10.0
- Rent growth +4.0/5.0
- Livability +4.0/5.0
- Condition / age +2.5/5.0
- Schools +1.7/10.0
- Appreciation +0.0/10.0
$57,000
🖨 Deal sheet 📄 Offer letter ✓ Due diligence
Listing remarks
Perfect 2 bedroom starter home or investment property. With a little TLC this house could become the perfect home! Large lot with fenced in yard and shed. Outbuilding is in need of some work but has potential. Inside you will find a large living room dining room combo. 2 bedrooms. 3pc bathroom with large walk in shower. W/ D hook up.
Key facts
- Shed
- W d hook up
- Large lot
Tags
Property features AI
Exterior
- Parking: Detached 1-car garage
- Utilities: Public water; Public sewer
- Home design: Single-story single family residence; Site-built home; Entry faces W 7th St / corner of Rochester and W 7th
- Construction: Aluminum siding
- Exterior features: Enclosed porch; Chain link fencing; Shed on property; Corner lot
Interior
- Bedrooms: 5 total rooms
- Flooring: Hardwood; Carpet
- Bathrooms: 1 full bathroom
- Heating & cooling: Natural gas heating; Ceiling fan cooling (no central air)
- Interior features: Ceiling fans
- Laundry & utility: Laundry on the main level; Crawl space basement
Neighborhood map
What this means for you Summary
Snapshot
- This is a 3-bed/1.0-bath single-family listed at $57k.
Deal economics
- At list price, monthly cash flow is $446 ($5k/yr) — positive.
- The deal already cash-flows at list — no discount required.
- Meets the 1% rule at list price ($1k rent vs $57k).
- Recommended offer: $55k (3.0% below list) — sets the bar for market timing.
- Cap rate 15.7% vs local median 6.0% in Muncie — top-decile yield for the area; either an underpriced asset or a hidden risk that comps aren't pricing in. Stress-test before assuming the spread holds.
Location & tenants
- Location reads 80/100 on livability (#18 in IN, #1,654 nationally) — a professional / high-income tenant draw. Strengths: amenities A+, commute A+, cost of living A+; Watch: crime F, employment F.
- Muncie Community Schools (urban): math 18% / reading 25% proficiency, ranked #275 of 301 in IN (top 91%) — low school quality limits family demand, transient renter base, plan for 1-2y turnover; 68% free/reduced lunch — lower-income household profile, screen leases tightly.
- Zoned schools: Southside Middle School (math 7% / reading 15%, grade F, #312 of 330 statewide, top 95%, 443 students, 85% FRL) — zoned schools average 85% FRL vs 68% district-wide (17 pts higher); higher-poverty schools than district average — tighter screening recommended.
- Market conditions: Rents rising fast (+6.1%/yr); 148 active listings in the ZIP; 34 comparable units currently listed for rent nearby; rentals lingering (median 44d on market — plan ~5-8 weeks vacancy on turnover, expect pricing pressure); 100% of comp listings sitting > 30 days — soft ceiling on asking rent; 171 units permitted in Delaware County in 2024 (57 in 5+ unit buildings).
Forward outlook
- Local home prices are declining (-3.0%/yr); year-one equity from $394 of loan paydown is wiped out by about $2k of value loss. Plan a longer hold.
- Delaware County population projected at -11% by 2050 — secular population decline; favor cash flow + early exit over multi-decade hold.
- At projected returns (-3.0% appreciation + 6.1% rent growth), your $16k cash investment doubles in ~4 years — after that, you're playing with house money.
Negotiation context
- It's been on market 46 days — a 3% lower offer ($55k) is reasonable based on typical stale-listing flexibility.
- 6 sale attempts; this cycle's ask has dropped $7k (11%) from the opening price — seller is motivated, your offer sets the floor, not the list.
Risks & watch-outs
- Watch-outs: built in 1900 — expect roof / HVAC / electrical / plumbing capex.
Questions for the listing agent
- It's been on market 46 days. Have you received any prior offers? Is the seller open to a 3% concession, seller financing, or rate buy-down credit?
- Built in 1900 — when were the roof, HVAC, electrical panel, plumbing, and water heater last replaced?
- Is there a deadline driving the sale (1031 exchange, divorce, estate, relocation)? That informs how much negotiation room exists.
- Schools are D-rated, which usually means shorter tenancies and higher turnover. Who's the typical renter profile here, and what's been the actual vacancy rate?
- Crime grade is F in this area — have there been break-ins, vandalism, or insurance claims at this property in the last 3 years? What carrier currently insures it and at what premium?
- What's the average days-on-market for RENTAL listings here right now (not sales)? A rising rental-DOM trend means longer vacancies and softer asking-rent achievability than the comps imply.
- What's the recent tenant-quality profile in this submarket — average credit score on applications, eviction rate, late-payment / NSF rate, and stable-employment percentage? A property-management company in the area should have these aggregated.
- How much new for-sale + rental construction is in the pipeline within 1–3 miles? Heavy new supply typically softens prices + rents 12–24 months out; constrained supply supports both.
Investment metrics
- 1% rule
- 1.86% ✓
- Cap rate
- 15.67%
- Cash-on-cash
- 33.50%
- DSCR
- 2.49
- GRM
- 4.5
CMA / ARV
- ARV (median comp)
- $72,540
- List price
- $57,000
- Delta
- -21.42%
- Verdict
- UNDERPRICED
- Comps
- 20 within 1.0 mi
Show comp detail 12 sales within ~0.75 mi
| Address | Dist | Beds/Ba | Sqft | Sold | Price | $/sf | Match |
|---|---|---|---|---|---|---|---|
| 2320 W 10th St | 0.40mi | 3/1.0 | 960 (-2%) | 3mo | $73,000 | $76 | 76 |
| 1913 W 10th St | 0.21mi | 2/1.0 (-1) | 1,052 (+8%) | 4mo | $95,000 | $90 | 69 |
| 2233 W 11th St | 0.39mi | 3/1.5 | 1,034 (+6%) | 4mo | $125,000 | $121 | 67 |
| 1436 W 14th St | 0.47mi | 2/1.0 (-1) | 952 (-3%) | 5mo | $95,000 | $100 | 65 |
| 1800 W 13th St | 0.36mi | 2/1.0 (-1) | 896 (-8%) | 0mo | $97,000 | $108 | 64 |
| 1514 W Memorial Dr | 0.33mi | 2/1.5 (-1) | 1,056 (+8%) | 0mo | $85,000 | $80 | 64 |
| 1617 W 16th St | 0.57mi | 3/1.0 | 894 (-9%) | 2mo | $100,000 | $112 | 58 |
| 2504 W 8th St | 0.43mi | 3/1.0 | 1,116 (+14%) | 3mo | $115,000 | $103 | 54 |
| 1400 W 13th St | 0.47mi | 3/1.5 | 1,124 (+15%) | 0mo | $104,900 | $93 | 51 |
| 409 S Celia Ave | 0.72mi | 3/1.0 | 1,044 (+7%) | 5mo | $126,000 | $121 | 50 |
| 802 W 13th St | 0.73mi | 2/1.0 (-1) | 1,040 (+6%) | 2mo | $92,000 | $88 | 48 |
| 2003 S Phillip Dr | 0.69mi | 3/1.0 | 1,100 (+12%) | 3mo | $125,000 | $114 | 45 |
Match score weights: distance 35% · size 25% · config 20% · recency 20%. Top-matched comps best support the ARV.
Projected returns pro-forma
-3.0% appreciation · 6.11% rent growth · sell at horizon
- IRR
- 32.3%
- Equity multiple
- 2.42×
- Total profit
- $22,587
- Equity at exit
- $8,499
- IRR
- 41.0%
- Equity multiple
- 5.47×
- Total profit
- $71,275
- Equity at exit
- $4,928
Cash invested: $15,960 (down + closing). Projections, not guarantees.
Landlord ↔ Tenant lean methodology
- Overall (STATE)
- 90 Strongly Landlord-Friendly
- State Indiana
- 90 Strongly Landlord-Friendly · R+11
- County
- — inherits STATE
- City
- — inherits STATE
ZIP-level market 47302
- Home prices YoY
- -12.6%
- Rents YoY
- 6.1%
- Active inventory
- 148
- Price-to-rent
- 4.5×
Monthly cashflow live
- Estimated rent
- $1,063 high interval (Pro) →
- Mortgage (P&I)
- −$299
- Tax est. 1.5%
- −$71 /mo · $855/yr
- Insurance
- −$24
- HOA
- −$0
- Vacancy / Maint / Mgmt
- −$223
- Net cashflow
- $446
Break-even live
UW: 25.0% down · 7.5% · 30yr · 1.5% tax · 5.0% vac · 8.0% maint · 8.0% mgmt
Financing live
Cash to close
- Down payment
- $14,250
- Closing costs
- $1,710
- Reserves months
- —
- Total cash needed
- —
Loan-product check · same deal, 3 products live
Conventional
25% down · 7.5% · 30yr
- Down + closing
- —
- Monthly P&I
- —
- Monthly cashflow
- —
- DSCR
- —
- Eligible?
- —
Personal DTI + credit; lowest rate.
DSCR
20% down · 8.5% · 30yr
- Down + closing
- —
- Monthly P&I
- —
- Monthly cashflow
- —
- DSCR
- —
- Eligible?
- —
No personal income docs; deal must DSCR.
Hard money
10% down · 12.0% · 12mo
- Down + closing
- —
- Monthly P&I
- —
- Monthly cashflow
- —
- DSCR
- —
- Eligible?
- —
Short-term bridge; refi at stabilization.
Rent comps 34 comps
| Address | Beds | Baths | Sqft | Rent | $/sqft | DOM | Units | Dist |
|---|---|---|---|---|---|---|---|---|
| 2015 W Godman Ave Muncie, IN | 2.0 | 1.0 | 900 | $985 | $1.09 | 43d | 7 | 0.46mi |
| 1704 W 15th St Muncie, IN | 3.0 | 1.0 | 1026 | $1,275 | $1.24 | 43d | 1 | 0.49mi |
| 309 S McKinley Ave Muncie, IN | 2.0 | 1.0 | 875 | $1,100 | $1.26 | 43d | 1 | 0.61mi |
| 715 S Cole Ave Muncie, IN | 1.0–2.0 | 1.0 | 462 | $995 | $2.15 | 43d | 6 | 0.63mi |
| 1001 W 1st St Unit 1 Muncie, IN | 3.0 | 1.5 | 1098 | $875 | $0.80 | 43d | 1 | 0.63mi |
| 1609 S Gharkey St Muncie, IN | 2.0 | 1.0 | 744 | $750 | $1.01 | 43d | 1 | 0.70mi |
| 815 W Memorial Dr Muncie, IN | 2.0 | 1.0 | 800 | $750 | $0.94 | 43d | 1 | 0.70mi |
| 1409 W Jackson St Muncie, IN | 2.0 | 1.0 | 811 | $844 | $1.04 | 43d | 1 | 0.71mi |
| 106 N McKinley Ave Muncie, IN | 2.0 | 1.0 | 996 | $1,024 | $1.03 | 43d | 2 | 0.79mi |
| 2106 W Main St Muncie, IN | 3.0 | 1.0 | 1036 | $1,209 | $1.17 | 43d | 1 | 0.79mi |
| 509 W 8th St Muncie, IN | 3.0 | 1.0 | 1008 | $1,325 | $1.31 | 43d | 1 | 0.81mi |
| 216 N McKinley Ave Muncie, IN | 1.0–2.0 | 1.0 | 679 | $825 | $1.22 | 43d | 3 | 0.85mi |
| 415 W 9th St Muncie, IN | 2.0 | 1.0 | 705 | $925 | $1.31 | 43d | 1 | 0.88mi |
| 907 W Main St Apt 1 Muncie, IN | 2.0 | 1.0 | 750 | $775 | $1.03 | 43d | 1 | 0.94mi |
| 319 W 10th St Muncie, IN | 2.0 | 1.0 | 869 | $885 | $1.02 | 43d | 1 | 0.96mi |
| 906 W Main St Muncie, IN | 1.0–2.0 | 1.0 | 712 | $995 | $1.40 | 43d | 3 | 0.96mi |
| 402 N Calvert St Muncie, IN | 2.0 | 1.0–1.5 | 720 | $899 | $1.25 | 43d | 5 | 0.97mi |
| 514 W Charles St Muncie, IN | 2.0 | 1.0 | 1062 | $800 | $0.75 | 43d | 1 | 1.00mi |
| 1501 W University Ave Muncie, IN | 2.0–3.0 | 1.0 | 794 | $1,125 | $1.42 | 43d | 1 | 1.02mi |
| 522 W Adams St Muncie, IN | 2.0 | 1.0 | 750 | $810 | $1.08 | 43d | 6 | 1.03mi |
| 301 W 13th St Muncie, IN | 1.0–2.0 | 1.0 | 725 | $844 | $1.16 | 43d | 1 | 1.03mi |
| 519 N Dill St Muncie, IN | 1.0–2.0 | 1.0 | 900 | $1,125 | $1.25 | 43d | 7 | 1.07mi |
| 206 W 13th St Muncie, IN | 2.0 | 1.0 | 992 | $900 | $0.91 | 43d | 1 | 1.07mi |
| 1525 S Walnut St Unit 11 Muncie, IN | 2.0 | 1.0 | 800 | $775 | $0.97 | 43d | 1 | 1.08mi |
| 326 W Charles St Muncie, IN | 2.0 | 1.0 | 836 | $1,300 | $1.56 | 43d | 1 | 1.08mi |
| 701 N Dicks St Unit 1&3 Muncie, IN | 2.0 | 1.5 | 920 | $1,580 | $1.72 | 43d | 1 | 1.16mi |
| 701 N Dicks St Unit 4 Muncie, IN | 2.0 | 1.5 | 920 | $1,580 | $1.72 | 43d | 1 | 1.16mi |
| 400 W Washington St Unit 213 Muncie, IN | 2.0 | 2.0 | 1009 | $1,200 | $1.19 | 43d | 1 | 1.20mi |
| 2316 S Walnut St Muncie, IN | 3.0 | 1.0 | 956 | $1,100 | $1.15 | 43d | 1 | 1.27mi |
| 1721 S Elm St Muncie, IN | 2.0 | 1.0 | 940 | $925 | $0.98 | 43d | 1 | 1.28mi |
| 816 N New York Ave Muncie, IN | 3.0–4.0 | 1.0 | 1200 | $1,000 | $0.83 | 43d | 10 | 1.30mi |
| 1001 W Wayne St Muncie, IN | 3.0 | 2.0 | 1100 | $1,200 | $1.09 | 43d | 1 | 1.40mi |
| 920 N Linden St Muncie, IN | 2.0 | 1.0 | 745 | $925 | $1.24 | 43d | 1 | 1.43mi |
| 1001 N Tillotson Ave Unit 6 Muncie, IN | 2.0 | 1.0 | 650 | $875 | $1.35 | 43d | 1 | 1.49mi |
Listing history 22 events
-
2026-06-09status $57,000 Pending 46 DOM
-
2026-06-08days on market $57,000 Active 46 DOM
-
2026-06-07days on market $57,000 Active 45 DOM
-
2026-06-05days on market $57,000 Active 42 DOM
-
2026-06-03days on market $57,000 Active 41 DOM
-
2026-06-02pricedays on market $57,000 Active 40 DOM
-
2026-06-01days on market $61,500 Active 39 DOM
-
2026-05-31days on market $61,500 Active 38 DOM
-
2026-05-30days on market $61,500 Active 37 DOM
-
2026-05-11price $61,500 335-char remark
-
2026-05-11price $61,500
-
2026-04-23$63,900 Active 335-char remark
-
2026-04-23$63,900 Active
-
2026-04-10historical
-
2026-01-28status Active
-
2026-01-28price $64,900
-
2026-01-28status Active
-
2026-01-28price $64,900
-
2026-01-14status Pending
-
2026-01-14status Pending
-
2025-10-10$69,900 Active
-
2025-10-10$69,900 Active
ⓘ Source: listings_history table (triggers on properties + properties_extension) + one-shot
backfill from property_details.listing_events for pre-trigger history.
Climate risk First Street
- Flood 1/10 Low FEMA zone X (unshaded) · 0% chance over 30 yrs
- Wildfire 1/10 Low
- Heat 3/10 Moderate 7 d/yr ≥100°F today · 18 d/yr by 30 yrs out
- Wind 2/10 Low 0% chance of damaging wind over 30 yrs
- Air quality 3/10 Moderate 2 unhealthy d/yr today · 3 by 30 yrs out
Nearby sold comps map
Loading sold comps map…
Walkable amenities ~0.75 mi
Loading nearby amenities…
Taxation est. · year 1
- Rental income
- $12,752
- − Mortgage interest
- −$3,193
- − Property taxes
- −$855
- − Insurance
- −$285
- − Repairs & maintenance
- −$1,020
- − Management
- −$1,020
- − Depreciation
- −$1,658
- Taxable income
- $4,720
- Est. tax owed @ 24.0%
- −$1,133
- After-tax cash flow
- $4,214/yr
For passive investors: Depreciation is non-cash, so a rental often shows a tax loss while cash-flowing — sheltering income. Rental losses are passive: they offset passive income freely, and up to $25,000/yr can offset ordinary (W-2) income if you actively participate and your MAGI is under $100k (phasing out to $0 by $150k); unused losses carry forward. On sale, claimed depreciation is recaptured at up to 25%, and gains may owe capital-gains tax (a 1031 exchange can defer both). Figures are a year-1 estimate at your 24.0% rate — not tax advice; consult a CPA.
Schools (NCES district)
- District
- Muncie Community Schools
- NCES district ID
- 1807320
- Math proficiency
- 18% ▼ -9.00%
- Reading proficiency
- 25% ▼ -4.00%
- Median HH income
- $30,052
- Composite
- 17.22/100
- National rank
- #9099
- State rank
- #275 of 301 in IN
Livability — Muncie
- Score
- 80/100
- State rank
- #18
- US rank
- #1654
Category grades
Schools grade is shown separately in the Schools card above.
Census & demographics
- Census place
- Muncie, IN
- County
- Delaware County · 84,658 people
- City population
- 84,658
- Metro
- Muncie, IN
- Population (ZIP)
- 25,473
- Household income
- $47,837
- Rent vs Own
- Severe rent burden
- 1150.0
Population outlook (Delaware County) Hauer SSP2
- Today (2025)
- 113,036 people
- By 2030
- 111,313 · -1.5%
- By 2040
- 106,432 · -5.8%
- By 2050
- 100,747 · -10.9%
- By 2075
- 91,000 · -19.5%
- By 2100
- 80,687 · -28.6%
Race, ethnicity, and origin ACS 2023
- Neighborhood character
- Predominantly White (84%)
- Race & ethnicity
- White 84% Two or more races 6% Black 6% Hispanic / Latino 4%
- Common ancestry
- Italian 2% Slovak 1% Romanian 1%
- Foreign-born
- 1% · Canada
- Languages at home
- 98% English-only · Spanish 1% German/W. Germanic 1%
Political lean MEDSL · Delaware
- 2024 margin
- R (+15.8) · D 41.2% · R 57.0% · Other 1.8%
- 2008→2024 swing
- -30.8pp toward R · 2008: 15.0pp · 2024: -15.8pp
- All cycles
- 2024: R+15.8 2020: R+13.2 2016: R+13.7 2012: D+3.1 2008: D+15.0
Not yet ingested
- Civics
- —
Market trends
- HPI YoY
- ▼ -30.32%
- Current HPI
- 210.431
- Rent YoY
- ▲ 6.11%
- Metro
- Muncie, IN
- State GDP YoY
- ▲ 2.90%
- F500 in state
- 18
Industry mix (Fortune 500 HQ in IN)
| Industry | F500 HQs | Revenue |
|---|---|---|
| Industrial Machinery | 2 | $37B |
|
||
| Healthcare | 1 | $177B |
|
||
| Pharmaceuticals | 1 | $45B |
|
||
| Metals / Steel | 1 | $18B |
|
||
| Agriculture | 1 | $17B |
|
||
| Packaging | 1 | $12B |
|
||
Price history
-18.5% since first listed16 events — show timeline
- 2026-06-08 Pending — IRMLS
- 2026-06-01 Price Changed $57,000 IRMLS
- 2026-06-01 Price Changed $57,000 MIBOR as Distributed by MLS Grid
- 2026-05-11 Price Changed $61,500 IRMLS
- 2026-05-11 Price Changed $61,500 MIBOR as Distributed by MLS Grid
- 2026-04-23 Listed $63,900 IRMLS
- 2026-04-23 Listed $63,900 MIBOR as Distributed by MLS Grid
- 2026-04-10 Listing Removed — MIBOR as Distributed by MLS Grid
- 2026-01-28 Relisted — IRMLS
- 2026-01-28 Price Changed $64,900 IRMLS
- 2026-01-28 Relisted — MIBOR as Distributed by MLS Grid
- 2026-01-28 Price Changed $64,900 MIBOR as Distributed by MLS Grid
- 2026-01-14 Pending — MIBOR as Distributed by MLS Grid
- 2026-01-14 Pending — IRMLS
- 2025-10-10 Listed $69,900 IRMLS
- 2025-10-10 Listed $69,900 MIBOR as Distributed by MLS Grid
Property tax history
-22.3%/yrLatest (2024): $108 · +0.0% YoY. Source: county tax records.
Cash-flow waterfall
monthlySold comps — $/sqft
last 12 mo · ≤1 miLoading sold comps…