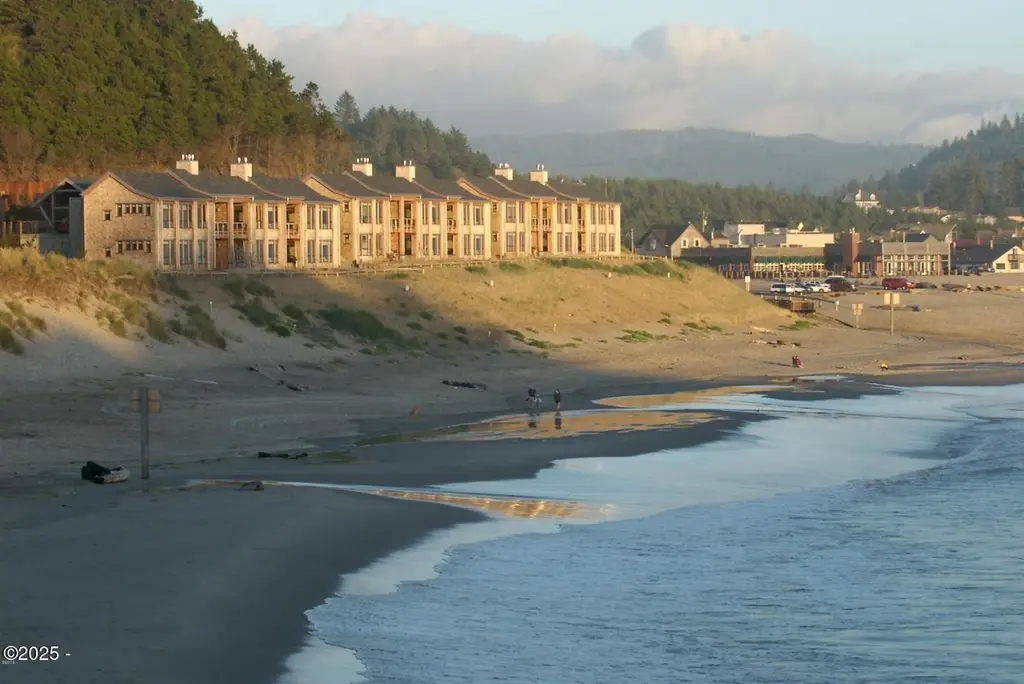
33000 Cape Kiwanda Dr Unit 4 WK 37 · Pacific City, OR
Flood risk 1/10 · Minimal
- FEMA flood zone
- X (unshaded)
- Chance of flooding over 30 yrs
- 0.0%
- Est. flood insurance / yr
- $473 – $860
Fire risk 1/10 · Minimal
- Est. fire insurance / yr
- $498 – $926
Heat risk 1/10 · Minimal
- Hot days now (above 77°F)
- 8 days/yr
- Hot days in 30 yrs
- 18 days/yr
Wind risk 1/10 · Minimal
- Chance of severe wind over 30 yrs
- —
Air-quality risk 7/10 · Major
- Unhealthy air days now
- 11 days/yr
- Unhealthy air days in 30 yrs
- 11 days/yr
Risk factors via First Street. Map © Google.
Why this score? — see what drove the C grade
The composite is a weighted blend of 9 inputs, each scored 0–100. Each bar is that input's sub-score; the figure is the points it added to the 100-point composite (weight × sub-score).
- Cash flow +15.0/30.0
- ARV discount +15.0/15.0
- Appreciation +5.4/10.0
- 1% rule +5.0/10.0
- DSCR +5.0/10.0
- Schools +3.7/10.0
- Livability +3.4/5.0
- Rent growth +2.5/5.0
- Condition / age +2.5/5.0
$41,000
🖨 Deal sheet 📄 Offer letter ✓ Due diligence
Listing remarks MLS
We are excited to offer a lower-level, oceanfront cottage. Deeded property 3 weeks per year! The cottage offers a patio perfect for watching whales, surfers, Dory Boats, wildlife, and the dynamic, ever-changing ocean. You will be just steps from miles of sandy beach, Cape Kiwanda, and the tidepools. At the end of the day, you can watch the sun set behind Haystack Rock. This two-bedroom, two-bath cottage features a fully equipped kitchen, a cozy gas fireplace for cool mornings, and a washer and dryer in the unit. This is the perfect vacation spot, as housekeeping, maintenance, and all bills are paid. All you need to do is show up. For many this is the best set up for your vacation memories.
Key facts
- Oceanfront cottage
- Cozy gas fireplace
- Parking
Tags
Neighborhood map
What this means for you Summary
Snapshot
- This is a 2-bed/2.0-bath single-family listed at $41k.
Deal economics
- At list price, monthly cash flow is $981 ($12k/yr) — positive.
- The deal already cash-flows at list — no discount required.
- Meets the 1% rule at list price ($2k rent vs $41k).
- Recommended offer: $36k (12.0% below list) — sets the bar for market timing.
- Cap rate 35.0% vs local median 1.9% in Pacific City — top-decile yield for the area; either an underpriced asset or a hidden risk that comps aren't pricing in. Stress-test before assuming the spread holds.
Location & tenants
- Location reads 67/100 on livability (#173 in OR) — a middle-class / working-renter tenant base. Strengths: crime A+, employment B, housing B; Watch: commute D+, health & safety D+, schools F.
- Nestucca Valley SD 101J (rural): math 33% / reading 50% proficiency, ranked #101 of 183 in OR (top 55%) — families likely to look elsewhere, expect single-tenant / working-renter base with shorter leases.
- Market conditions: 113 active listings in the ZIP; 86 units permitted in Tillamook County in 2024 (0 in 5+ unit buildings).
Forward outlook
- In year one you build about $582 of equity ($283 loan paydown + $299 appreciation (0.7% local appreciation)).
- Tillamook County population projected at +3% by 2050 — modest demand growth; plan on rents tracking national, not racing it.
- At projected returns (0.7% appreciation + 3.0% rent growth), your $11k cash investment doubles in ~1 year — after that, you're playing with house money.
Negotiation context
- It's been on market 171 days — a 12% lower offer ($36k) is reasonable based on typical stale-listing flexibility.
Questions for the listing agent
- It's been on market 171 days. Have you received any prior offers? Is the seller open to a 12% concession, seller financing, or rate buy-down credit?
- What does the HOA fee cover, when was the last increase, and are there any pending special assessments or reserve-fund shortfalls?
- Why hasn't it sold? Are there any deal-killer items the seller is aware of (foundation, flood, title, zoning, code violations)?
- Is there a deadline driving the sale (1031 exchange, divorce, estate, relocation)? That informs how much negotiation room exists.
- Schools are F-rated, which usually means shorter tenancies and higher turnover. Who's the typical renter profile here, and what's been the actual vacancy rate?
- What's the average days-on-market for RENTAL listings here right now (not sales)? A rising rental-DOM trend means longer vacancies and softer asking-rent achievability than the comps imply.
- What's the recent tenant-quality profile in this submarket — average credit score on applications, eviction rate, late-payment / NSF rate, and stable-employment percentage? A property-management company in the area should have these aggregated.
- How much new for-sale + rental construction is in the pipeline within 1–3 miles? Heavy new supply typically softens prices + rents 12–24 months out; constrained supply supports both.
Investment metrics
- 1% rule
- 5.14% ✓
- Cap rate
- 35.01%
- Cash-on-cash
- 102.55%
- DSCR
- 5.56
- GRM
- 1.6
CMA / ARV
- ARV (median comp)
- $59,714
- List price
- $41,000
- Delta
- -31.34%
- Verdict
- UNDERPRICED
- Comps
- 20 within 1.0 mi
Show comp detail 4 sales within ~0.75 mi
| Address | Dist | Beds/Ba | Sqft | Sold | Price | $/sf | Match |
|---|---|---|---|---|---|---|---|
| 33000 Cape Kiwanda Dr Unit 3WK29 | 0.01mi | 2/2.0 | 985 (0%) | 11mo | $47,000 | $48 | 90 |
| 33000 Cape Kiwanda Dr Unit 10 Wk 29 | 0.02mi | 2/2.0 | 985 (0%) | 12mo | $45,916 | $47 | 89 |
| 33000 Cape Kiwanda Dr Unit 3 Wk 29 | 0.00mi | 2/2.0 | 985 (0%) | 13mo | $47,000 | $48 | 89 |
| 33000 Cape Kiwanda Dr | 0.03mi | 2/2.0 | 985 (0%) | 22mo | $53,500 | $54 | 80 |
Match score weights: distance 35% · size 25% · config 20% · recency 20%. Top-matched comps best support the ARV.
Projected returns pro-forma
0.73% appreciation · 3.0% rent growth · sell at horizon
- IRR
- —
- Equity multiple
- 6.49×
- Total profit
- $62,990
- Equity at exit
- $13,422
- IRR
- —
- Equity multiple
- 13.50×
- Total profit
- $143,478
- Equity at exit
- $17,400
Cash invested: $11,480 (down + closing). Projections, not guarantees.
Landlord ↔ Tenant lean methodology
- Overall (STATE)
- 28 Tenant-Leaning
- State Oregon
- 28 Tenant-Leaning · D+6
- County
- — inherits STATE
- City
- — inherits STATE
ZIP-level market 97135
- Home prices YoY
- 0.4%
- Active inventory
- 113
- Price-to-rent
- 1.6×
Monthly cashflow live
- Estimated rent
- $2,106 medium interval (Pro) →
- Mortgage (P&I)
- −$215
- Tax est. 1.5%
- −$51 /mo · $615/yr
- Insurance
- −$17
- HOA
- −$399
- Vacancy / Maint / Mgmt
- −$442
- Net cashflow
- $981
Break-even live
UW: 25.0% down · 7.5% · 30yr · 1.5% tax · 5.0% vac · 8.0% maint · 8.0% mgmt
Financing live
Cash to close
- Down payment
- $10,250
- Closing costs
- $1,230
- Reserves months
- —
- Total cash needed
- —
Loan-product check · same deal, 3 products live
Conventional
25% down · 7.5% · 30yr
- Down + closing
- —
- Monthly P&I
- —
- Monthly cashflow
- —
- DSCR
- —
- Eligible?
- —
Personal DTI + credit; lowest rate.
DSCR
20% down · 8.5% · 30yr
- Down + closing
- —
- Monthly P&I
- —
- Monthly cashflow
- —
- DSCR
- —
- Eligible?
- —
No personal income docs; deal must DSCR.
Hard money
10% down · 12.0% · 12mo
- Down + closing
- —
- Monthly P&I
- —
- Monthly cashflow
- —
- DSCR
- —
- Eligible?
- —
Short-term bridge; refi at stabilization.
HOA detail
- Monthly dues
- $399 · $4,788/yr
- Likely covers
- gaspool
Listing history 15 events
-
2026-06-18days on market $41,000 Active 171 DOM
-
2026-06-17days on market $41,000 Active 170 DOM
-
2026-06-16days on market $41,000 Active 169 DOM
-
2026-06-15days on market $41,000 Active 168 DOM
-
2026-06-13days on market $41,000 Active 166 DOM
-
2026-06-12days on market $41,000 Active 165 DOM
-
2026-06-09days on market $41,000 Active 162 DOM
-
2026-06-08days on market $41,000 Active 161 DOM
-
2026-06-08days on market $41,000 Active 160 DOM
-
2026-06-07days on market $41,000 Active 159 DOM
-
2026-06-04days on market $41,000 Active 156 DOM
-
2026-06-02days on market $41,000 Active 155 DOM
-
2026-06-01days on market $41,000 Active 154 DOM
-
2026-05-31days on market $41,000 Active 153 DOM
-
2025-12-29$41,000 Active 701-char remark
Show marketing remark (701 chars)
We are excited to offer a lower-level, oceanfront cottage. Deeded property 3 weeks per year! The cottage offers a patio perfect for watching whales, surfers, Dory Boats, wildlife, and the dynamic, ever-changing ocean. You will be just steps from miles of sandy beach, Cape Kiwanda, and the tidepools. At the end of the day, you can watch the sun set behind Haystack Rock. This two-bedroom, two-bath cottage features a fully equipped kitchen, a cozy gas fireplace for cool mornings, and a washer and dryer in the unit. This is the perfect vacation spot, as housekeeping, maintenance, and all bills are paid. All you need to do is show up. For many this is the best set up for your vacation memories.
ⓘ Source: listings_history table (triggers on properties + properties_extension) + one-shot
backfill from property_details.listing_events for pre-trigger history.
Climate risk First Street
- Flood 1/10 Low FEMA zone X (unshaded) · 0% chance over 30 yrs
- Wildfire 1/10 Low
- Heat 1/10 Low 8 d/yr ≥77°F today · 18 d/yr by 30 yrs out
- Wind 1/10 Low
- Air quality 7/10 Severe 11 unhealthy d/yr today · 11 by 30 yrs out
Nearby sold comps map
Loading sold comps map…
Walkable amenities ~0.75 mi
Loading nearby amenities…
Taxation est. · year 1
- Rental income
- $25,267
- − Mortgage interest
- −$2,297
- − Property taxes
- −$615
- − Insurance
- −$205
- − Repairs & maintenance
- −$2,021
- − Management
- −$2,021
- − HOA
- −$4,788
- − Depreciation
- −$1,193
- Taxable income
- $12,127
- Est. tax owed @ 24.0%
- −$2,911
- After-tax cash flow
- $8,863/yr
For passive investors: Depreciation is non-cash, so a rental often shows a tax loss while cash-flowing — sheltering income. Rental losses are passive: they offset passive income freely, and up to $25,000/yr can offset ordinary (W-2) income if you actively participate and your MAGI is under $100k (phasing out to $0 by $150k); unused losses carry forward. On sale, claimed depreciation is recaptured at up to 25%, and gains may owe capital-gains tax (a 1031 exchange can defer both). Figures are a year-1 estimate at your 24.0% rate — not tax advice; consult a CPA.
Schools (NCES district)
- District
- Nestucca Valley SD 101J
- NCES district ID
- 4108700
- Math proficiency
- 33% ▼ -4.00%
- Reading proficiency
- 50% ▼ -4.00%
- Median HH income
- $41,958
- Composite
- 37.3/100
- National rank
- #8956
- State rank
- #101 of 183 in OR
Livability — Pacific City
- Score
- 67/100
- State rank
- #173
- US rank
- #10340
Category grades
Schools grade is shown separately in the Schools card above.
Census & demographics
- Census place
- Pacific City, OR
- City population
- 1,505
- Population (ZIP)
- 1,505
Population outlook (Tillamook County) Hauer SSP2
- Today (2025)
- 26,318 people
- By 2030
- 26,603 · +1.1%
- By 2040
- 26,898 · +2.2%
- By 2050
- 27,129 · +3.1%
- By 2075
- 27,858 · +5.9%
- By 2100
- 26,212 · -0.4%
Race, ethnicity, and origin ACS 2023
- Neighborhood character
- Predominantly White (86%)
- Race & ethnicity
- White 86% Hispanic / Latino 8% Two or more races 3%
- Hispanic origin (detail)
- Mexican 8%
- Common ancestry
- Lithuanian 8% Italian 5% Romanian 5%
- Foreign-born
- 1%
- Languages at home
- 97% English-only · Spanish 3%
Political lean MEDSL · Tillamook
- 2024 margin
- Toss-up / Even · D 47.9% · R 49.2% · Other 2.9%
- 2008→2024 swing
- -11.2pp toward R · 2008: 9.9pp · 2024: -1.4pp
- All cycles
- 2024: R+1.4 2020: R+1.7 2016: R+5.9 2012: D+4.7 2008: D+9.9
Not yet ingested
- Civics
- —
Market trends
- HPI YoY
- ▲ 0.73%
- Current HPI
- 197.7747
- Rent YoY
- —
- Metro
- —
- State GDP YoY
- ▲ 2.05%
- F500 in state
- 2
Industry mix (Fortune 500 HQ in OR)
| Industry | F500 HQs | Revenue |
|---|---|---|
| Consumer Goods | 1 | $51B |
|
||
Price history
1 event — show timeline
- 2025-12-29 Listed $41,000 OCMLS
Cash-flow waterfall
monthlySold comps — $/sqft
last 12 mo · ≤1 miLoading sold comps…