8055 Tiger Cv #608 · Lely Resort, FL
Flood risk 7/10 · Major
- FEMA flood zone
- X (shaded)
- Chance of flooding over 30 yrs
- 0.75%
- Est. flood insurance / yr
- $507 – $1,088
Fire risk 4/10 · Minor
- Est. fire insurance / yr
- $947 – $1,759
Heat risk 10/10 · Severe
- Hot days now (above 108°F)
- 7 days/yr
- Hot days in 30 yrs
- 30 days/yr
Wind risk 10/10 · Severe
- Chance of severe wind over 30 yrs
- 99.0%
Air-quality risk 2/10 · Minimal
- Unhealthy air days now
- 2 days/yr
- Unhealthy air days in 30 yrs
- 2 days/yr
Risk factors via First Street. Map © Google.
Why this score? — see what drove the B- grade
The composite is a weighted blend of 9 inputs, each scored 0–100. Each bar is that input's sub-score; the figure is the points it added to the 100-point composite (weight × sub-score).
- Cash flow +27.1/30.0
- DSCR +9.4/10.0
- 1% rule +8.9/10.0
- ARV discount +7.5/15.0
- Schools +5.0/10.0
- Rent growth +3.9/5.0
- Livability +3.1/5.0
- Condition / age +2.5/5.0
- Appreciation +0.0/10.0
$410,000
🖨 Deal sheet (PDF) 📄 Offer letter ✓ Due diligence
Listing remarks MLS
This beautiful 2nd floor end unit condo is NOT a Short Sale. Current owner has paid much more for this condo and has taken the time and expense to upgrade flooring and decor, making this a very good property to consider. Located in prestigious "LELY RESORT" you are surrounded by award winning golf courses and tropical landscapes. In this condo you can enjoy warm sunsets from the living room Lanai that over look the Flamingo Golf Course, and have your breakfasts just off the kitchen on your Veranda in the morning sun. This spacious condo has vaulted ceilings, a one car garage and just steps away from the pool, club house and tennis court.
Key facts
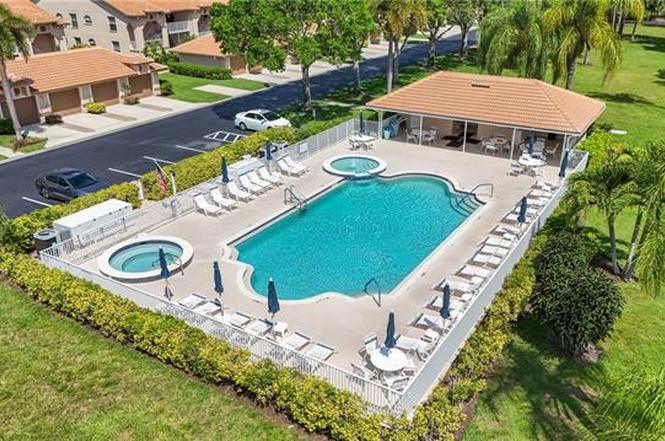
- Resort style pools
- Championship golf
- Golf course views
Tags
Property features AI
Finance
- Other: Multi-unit building with 8 units (24 units in complex); 1 floor, 2 units per floor
- HOA & community: Mandatory HOA; Quarterly condo fee; Condo fee: $1,898 quarterly; One-time fee: $500; Total annual recurring fees: $7,592; Total one-time fees: $750; Professional management; HOA maintenance covers insurance, irrigation water, lawn/land maintenance, legal/accounting, manager, master association fee, exterior pest control, recreation facilities, street lights, trash removal; Community amenities: clubhouse, community pool, community spa/hot tub, tennis courts, pickleball, bocce court, basketball, bike and jog path; Non-gated community; Public golf access
Exterior
- Parking: Deeded assigned parking (1 space); Detached garage
- Utilities: Central water; Central sewer; Cable available
- Home design: Residential low-rise (1–3 stories); End-unit; Built in 1996; Located in Lely Resort (Verandas at Tiger Island)
- Construction: Concrete block construction
- Exterior features: Tile roof; Sliding windows; Stucco exterior; Golf course view; Central irrigation; Paved road access; Zero lot line; Rear exposure to the west; Restrictions: limited number of vehicles, no commercial use, no RVs; End-unit
Interior
- Kitchen: Cooktop (electric); Self-cleaning oven; Dishwasher; Disposal; Microwave; Refrigerator/freezer; Pantry
- Bedrooms: 3 bedrooms (split bedroom floor plan)
- Flooring: Carpet; Tile
- Bathrooms: 2 full bathrooms; Master bath with dual sinks and separate tub and shower
- Heating & cooling: Central electric heat; Central electric cooling; Ceiling fans
- Interior features: Cathedral ceiling; High-speed internet available; Smoke detectors; Window coverings; Pantry; Breakfast bar; Dining in living area; Den (study); Great room; Screened lanai/porch; Partially furnished
- Laundry & utility: Washer and dryer in residence; Auto garage door
Neighborhood map
What this means for you Summary
Snapshot
- This is a 3-bed/2.0-bath condo listed at $410k.
Deal economics
- At list price, monthly cash flow is $1k ($13k/yr) — positive.
- The deal already cash-flows at list — no discount required.
- Meets the 1% rule at list price ($6k rent vs $410k).
- Recommended offer: $361k (12.0% below list) — sets the bar for market timing.
Location & tenants
- Location reads 61/100 on livability (#786 in FL) — a middle-class / working-renter tenant base. Strengths: crime A+, employment A-; Watch: health & safety D, amenities F, commute F.
- Collier (suburban): math 60% / reading 56% proficiency, ranked #16 of 73 in FL (top 22%) — acceptable for families but not a draw, mixed tenant base, ~2y average lease.
- Zoned schools: Lely Elementary School (math 45% / reading 46%, grade D-, #1,247 of 2,144 statewide, top 59%, 499 students, 62% FRL); Manatee Middle School (math 61% / reading 43%, grade C+, #217 of 571 statewide, top 40%, 749 students, 64% FRL); Lely High School (math 40% / reading 39%, grade F, #304 of 667 statewide, top 47%, 1,504 students, 54% FRL).
- Zoned-school proficiency averages 46% at this address vs 58% district-wide (-12 pts) — the specific schools serving this property underperform the Collier average; the district grade overstates school quality for this exact location.
- Market conditions: Rents rising fast (+5.6%/yr); 598 active listings in the ZIP; 40 comparable units currently listed for rent nearby; rentals at typical pace (median 25d on market — plan ~3-4 weeks tenant-placement turnaround); solid renter incomes; 3,520 units permitted in Collier County in 2024 (959 in 5+ unit buildings).
Forward outlook
- Local home prices are declining (-3.0%/yr); year-one equity from $3k of loan paydown is wiped out by about $12k of value loss. Plan a longer hold.
- Collier County population projected at +30% by 2050 — long-run rental-demand tailwind backs the buy-and-hold thesis.
- At projected returns (-3.0% appreciation + 5.6% rent growth), your $115k cash investment doubles in ~8 years — after that, you're playing with house money.
Negotiation context
- It's been on market 242 days — a 12% lower offer ($361k) is reasonable based on typical stale-listing flexibility.
- 4 sale attempts since 19y ago; this cycle's ask has dropped $35k (8%) from the opening price — seller is motivated, your offer sets the floor, not the list.
- Current owner paid $190k; list at $410k implies a 116% gain — meaningful room to come down on a strong offer.
Risks & watch-outs
- Watch-outs: flood insurance adds $66/mo.
- Climate carrying-cost: major flood risk; severe wind risk, 99% chance of damaging wind over 30y; extreme-heat days projected 7→30/yr by 2055 (HVAC capex compounding) — expect insurance premiums to compound above CPI over the hold.
Questions for the listing agent
- It's been on market 242 days. Have you received any prior offers? Is the seller open to a 12% concession, seller financing, or rate buy-down credit?
- What's the actual annual flood-insurance premium (NFIP or private), and is the property in a SFHA with mandatory coverage?
- What does the HOA fee cover, when was the last increase, and are there any pending special assessments or reserve-fund shortfalls?
- Any open or pending special assessments — roof, HVAC, plumbing, elevator, façade? What's the per-unit balance and payoff schedule, and is the seller paying it off at close or rolling it to the buyer?
- Why hasn't it sold? Are there any deal-killer items the seller is aware of (foundation, flood, title, zoning, code violations)?
- Is there a deadline driving the sale (1031 exchange, divorce, estate, relocation)? That informs how much negotiation room exists.
- Schools are F-rated, which usually means shorter tenancies and higher turnover. Who's the typical renter profile here, and what's been the actual vacancy rate?
- What's the average days-on-market for RENTAL listings here right now (not sales)? A rising rental-DOM trend means longer vacancies and softer asking-rent achievability than the comps imply.
- What's the recent tenant-quality profile in this submarket — average credit score on applications, eviction rate, late-payment / NSF rate, and stable-employment percentage? A property-management company in the area should have these aggregated.
- How much new apartment / multifamily construction is in the pipeline within 1–3 miles? Heavy new supply (>2% of stock underway) typically softens rents 12–24 months out; light construction supports rent growth.
Investment metrics
- 1% rule
- 1.39% ✓
- Cap rate
- 9.70%
- Cash-on-cash
- 12.15%
- DSCR
- 1.54
- GRM
- 6.0
CMA / ARV
No comps found within radius.
Projected returns pro-forma
-3.0% appreciation · 5.59% rent growth · sell at horizon
- IRR
- 4.2%
- Equity multiple
- 1.17×
- Total profit
- $19,038
- Equity at exit
- $61,132
- IRR
- 16.3%
- Equity multiple
- 2.52×
- Total profit
- $174,093
- Equity at exit
- $35,449
Cash invested: $114,800 (down + closing). Projections, not guarantees.
Landlord ↔ Tenant lean methodology
- Overall (STATE)
- 87 Strongly Landlord-Friendly
- State Florida
- 87 Strongly Landlord-Friendly · R+3
- County
- — inherits STATE
- City
- — inherits STATE
ZIP-level market 34113
- Rents YoY
- 5.6%
- Active inventory
- 598
- Price-to-rent
- 6.0×
Monthly cashflow live
- Estimated rent
- $5,691 high interval (Pro) →
- Mortgage (P&I)
- −$2,150
- Tax from tax record
- −$379 /mo · $4,551/yr
- Insurance
- −$171
- Flood insurance flood zone
- −$66 /mo · $798/yr
- HOA
- −$633
- Vacancy / Maint / Mgmt
- −$1,195
- Net cashflow
- $1,096
Break-even live
Sensitivity live
| Price | -10% $1,328 | -5% $1,212 | +0% $1,096 | +5% $980 | +10% $864 |
|---|---|---|---|---|---|
| Rent | -10% $647 | -5% $872 | +0% $1,096 | +5% $1,321 | +10% $1,546 |
| Rate | -1.0pp $1,303 | -0.5pp $1,201 | base $1,096 | +0.5pp $990 | +1.0pp $882 |
UW: 25.0% down · 7.5% · 30yr · 1.5% tax · 5.0% vac · 8.0% maint · 8.0% mgmt
Financing live
Cash to close
- Down payment
- $102,500
- Closing costs
- $12,300
- Reserves months
- —
- Total cash needed
- —
Loan-product check · same deal, 3 products live
Conventional
25% down · 7.5% · 30yr
- Down + closing
- —
- Monthly P&I
- —
- Monthly cashflow
- —
- DSCR
- —
- Eligible?
- —
Personal DTI + credit; lowest rate.
DSCR
20% down · 8.5% · 30yr
- Down + closing
- —
- Monthly P&I
- —
- Monthly cashflow
- —
- DSCR
- —
- Eligible?
- —
No personal income docs; deal must DSCR.
Hard money
10% down · 12.0% · 12mo
- Down + closing
- —
- Monthly P&I
- —
- Monthly cashflow
- —
- DSCR
- —
- Eligible?
- —
Short-term bridge; refi at stabilization.
Rent comps 40 comps
| Address | Beds | Baths | Sqft | Rent | $/sqft | DOM | Units | Dist |
|---|---|---|---|---|---|---|---|---|
| 8055 Tiger Cv Unit 6-606 Naples, FL | 2.0 | 2.0 | 1439 | $1,800 | $1.25 | 25d | 1 | 0.02mi |
| 8073 Panther Trl #1404 Naples, FL | 2.0 | 2.0 | 1450 | $5,500 | $3.79 | 25d | 1 | 0.05mi |
| 8065 Tiger Cv Naples, FL | 2.0 | 2.0 | 1203 | $2,495 | $2.07 | 25d | 1 | 0.05mi |
| 8065 Tiger Cv #1604 Naples, FL | 2.0 | 2.0 | 1203 | $2,495 | $2.07 | 22d | 1 | 0.06mi |
| 8949 Malibu St #304 Naples, FL | 3.0 | 2.0 | 1771 | $6,500 | $3.67 | 25d | 1 | 0.11mi |
| 8085 Celeste Dr #812 Naples, FL | 2.0 | 2.0 | 1480 | $6,000 | $4.05 | 15d | 1 | 0.11mi |
| 8177 Saratoga Dr #1002 Naples, FL | 2.0 | 2.0 | 1880 | $9,000 | $4.79 | 25d | 1 | 0.20mi |
| 8177 Saratoga Dr #1001 Naples, FL | 2.0 | 2.0 | 1880 | $8,000 | $4.26 | 25d | 1 | 0.20mi |
| 8125 Celeste Dr #5113 Naples, FL | 3.0 | 2.0 | 1635 | $7,000 | $4.28 | 25d | 1 | 0.22mi |
| 8125 Celeste Dr #5216 Naples, FL | 3.0 | 2.0 | 1640 | $4,500 | $2.74 | 25d | 1 | 0.22mi |
| 8992 Cambria Cir Unit 1546062P Naples, FL | 3.0 | 2.0 | 2002 | $3,097 | $1.55 | 15d | 1 | 0.23mi |
| 8989 Cambria Cir #1807 Naples, FL | 3.0 | 2.5 | 2008 | $7,000 | $3.49 | 15d | 1 | 0.24mi |
| 8200 Saratoga Dr #401 Naples, FL | 2.0 | 2.0 | 1880 | $8,500 | $4.52 | 25d | 1 | 0.27mi |
| 8693 Querce Ct Naples, FL | 2.0 | 2.0 | 1415 | $5,000 | $3.53 | 25d | 1 | 0.27mi |
| 8986 Cambria Cir #2204 Naples, FL | 3.0 | 2.0 | 1771 | $7,500 | $4.23 | 25d | 1 | 0.31mi |
| 8986 Cambria Cir Unit 22 Naples, FL | 2.0 | 2.0 | 1404 | $6,000 | $4.27 | 25d | 1 | 0.31mi |
| 8135 Celeste Dr #4218 Naples, FL | 2.0 | 2.0 | 1476 | $7,500 | $5.08 | 25d | 1 | 0.33mi |
| 8138 Saratoga Dr #2201 Naples, FL | 2.0 | 2.0 | 1880 | $8,000 | $4.26 | 25d | 1 | 0.34mi |
| 9025 Alturas St #3102 Naples, FL | 2.0 | 3.0 | 1531 | $3,400 | $2.22 | 25d | 1 | 0.35mi |
| 8175 Celeste Dr #1230 Naples, FL | 2.0 | 2.0 | 1476 | $2,775 | $1.88 | 25d | 1 | 0.35mi |
| 8175 Celeste Dr #1229 Naples, FL | 3.0 | 2.0 | 1640 | $2,975 | $1.81 | 25d | 1 | 0.35mi |
| 8175 Celeste Dr Naples, FL | 2.0 | 2.0 | 1460 | $2,395 | $1.64 | 25d | 1 | 0.35mi |
| 8081 Players Cove Dr #101 Naples, FL | 2.0 | 2.5 | 2091 | $9,500 | $4.54 | 25d | 1 | 0.38mi |
| 8060 Players Cove Dr #101 Naples, FL | 2.0 | 2.5 | 2091 | $4,800 | $2.30 | 25d | 1 | 0.39mi |
| 7278 Salerno Ct Unit 1049689P Naples, FL | 3.0 | 2.0 | 1539 | $6,683 | $4.34 | 15d | 1 | 0.40mi |
| 7294 Salerno Ct Naples, FL | 3.0 | 2.0 | 1542 | $4,250 | $2.76 | 25d | 1 | 0.41mi |
| 7310 Salerno Ct Naples, FL | 3.0 | 2.0 | 1540 | $5,000 | $3.25 | 25d | 1 | 0.42mi |
| 8519 Chase Preserve Dr Naples, FL | 2.0 | 2.0 | 1827 | $9,000 | $4.93 | 25d | 1 | 0.43mi |
| 9054 Capistrano St N #4003 Naples, FL | 2.0 | 2.0 | 1385 | $2,495 | $1.80 | 25d | 1 | 0.45mi |
| 9054 Capistrano St N #4002 Naples, FL | 3.0 | 2.0 | 1674 | $6,000 | $3.58 | 25d | 1 | 0.45mi |
| 8051 Players Cove Dr #102 Naples, FL | 3.0 | 2.5 | 2091 | $8,000 | $3.83 | 25d | 1 | 0.46mi |
| 7114 Marconi Ct Naples, FL | 2.0 | 2.0 | 1554 | $2,800 | $1.80 | 25d | 1 | 0.50mi |
| 8965 Malibu Ln #802 Naples, FL | 3.0 | 2.0 | 1771 | $6,595 | $3.72 | 25d | 1 | 0.52mi |
| 7895 Mahogany Run Ln Unit 1504163P Naples, FL | 2.0 | 2.0 | 1237 | $4,125 | $3.33 | 22d | 1 | 0.52mi |
| 6903 Mauna Loa Ln Naples, FL | 3.0 | 2.5 | 2224 | $13,500 | $6.07 | 25d | 1 | 0.52mi |
| 7895 Mahogany Run Ln Naples, FL | 2.0–3.0 | 2.0 | 1339 | $10,395 | $7.76 | 15d | 3 | 0.53mi |
| 9082 Capistrano St N Unit 48-5 Naples, FL | 2.0 | 2.0 | 1227 | $6,500 | $5.30 | 25d | 1 | 0.53mi |
| 8664 Genova Ct Naples, FL | 3.0 | 2.0 | 1554 | $3,200 | $2.06 | 25d | 1 | 0.53mi |
| 7885 Mahogany Run Ln Unit 1504180P Naples, FL | 2.0 | 2.0 | 1237 | $2,915 | $2.36 | 22d | 1 | 0.54mi |
| 8419 Benelli Ct Naples, FL | 3.0 | 2.0 | 1900 | $3,300 | $1.74 | 25d | 1 | 0.54mi |
HOA detail condo
- Monthly dues
- $633 · $7,596/yr
- Likely covers
- pool
- Assessments
- None detected in remarks — confirm with the listing agent.
Listing history 12 events
-
2026-06-22days on market $410,000 Active 242 DOM
-
2026-06-18days on market $410,000 Active 239 DOM
-
2026-06-17days on market $410,000 Active 238 DOM
-
2026-06-16days on market $410,000 Active 237 DOM
-
2026-06-15days on market $410,000 Active 236 DOM
-
2026-06-10days on market $410,000 Active 231 DOM
-
2026-06-09days on market $410,000 Active 230 DOM
-
2026-06-08days on market $410,000 Active 229 DOM
-
2026-06-07days on market $410,000 Active 228 DOM
-
2026-06-03days on market $410,000 Active 224 DOM
-
2026-06-03remarks 693-char remark
-
2026-06-03$410,000 Active 223 DOM
ⓘ Source: listings_history table (triggers on properties + properties_extension) + one-shot
backfill from property_details.listing_events for pre-trigger history.
Tax reassessment forecast FL · Resets to sale price
- Current annual tax
- $4,551 · $379/mo
- Projected year-2 tax
- $4,551 · $379/mo
- Expected delta
- $0/yr ($0/mo · 0.0%)
ⓘ Screening estimate from a state-policy table — verify with the county assessor before closing.
Climate risk First Street
- Flood 7/10 Severe FEMA zone X (shaded) · 75% chance over 30 yrs
- Wildfire 4/10 Moderate
- Heat 10/10 Extreme 7 d/yr ≥108°F today · 30 d/yr by 30 yrs out
- Wind 10/10 Extreme 99% chance of damaging wind over 30 yrs
- Air quality 2/10 Low 2 unhealthy d/yr today · 2 by 30 yrs out
Nearby sold comps map
Loading sold comps map…
Walkable amenities ~0.75 mi
Loading nearby amenities…
Taxation est. · year 1
- Rental income
- $68,293
- − Mortgage interest
- −$22,966
- − Property taxes
- −$4,551
- − Insurance
- −$2,848
- − Repairs & maintenance
- −$5,463
- − Management
- −$5,463
- − HOA
- −$7,596
- − Depreciation
- −$11,927
- Taxable income
- $7,478
- Est. tax owed @ 24.0%
- −$1,795
- After-tax cash flow
- $11,362/yr
For passive investors: Depreciation is non-cash, so a rental often shows a tax loss while cash-flowing — sheltering income. Rental losses are passive: they offset passive income freely, and up to $25,000/yr can offset ordinary (W-2) income if you actively participate and your MAGI is under $100k (phasing out to $0 by $150k); unused losses carry forward. On sale, claimed depreciation is recaptured at up to 25%, and gains may owe capital-gains tax (a 1031 exchange can defer both). Figures are a year-1 estimate at your 24.0% rate — not tax advice; consult a CPA.
Schools (NCES district)
- District
- Collier
- NCES district ID
- 1200330
- Math proficiency
- 60% ▼ -4.00%
- Reading proficiency
- 56% ▼ -2.00%
- Median HH income
- $58,275
- Composite
- 50.23/100
- National rank
- #1892
- State rank
- #16 of 73 in FL
Livability — Lely Resort
- Score
- 61/100
- State rank
- #786
- US rank
- #17981
Category grades
Schools grade is shown separately in the Schools card above.
Census & demographics
- Census place
- Lely Resort, FL
- County
- Collier County · 396,295 people
- Metro
- Naples-Marco Island, FL
- Population (ZIP)
- 26,056
- Household income
- $81,674
- Rent vs Own
- Severe rent burden
- 954.0
Population outlook (Collier County) Hauer SSP2
- Today (2025)
- 420,858 people
- By 2030
- 450,054 · +6.9%
- By 2040
- 502,232 · +19.3%
- By 2050
- 544,932 · +29.5%
- By 2075
- 627,203 · +49.0%
- By 2100
- 659,015 · +56.6%
Race, ethnicity, and origin ACS 2023
- Neighborhood character
- Diverse neighborhood (Simpson 0.59)
- Race & ethnicity
- White 56% Hispanic / Latino 28% Black 12% Two or more races 11% Asian 2%
- Hispanic origin (detail)
- Mexican 17% Puerto Rican 3% Cuban 2%
- Common ancestry
- Hispanic 10% Romanian 3% Lithuanian 2%
- Foreign-born
- 26% · Canada, Jamaica, Vietnam
- Languages at home
- 63% English-only · Spanish 24% French/Haitian/Cajun 9% Other Indo-European 2%
Political lean MEDSL · Collier
- 2024 margin
- Solid R (+33.1) · D 33.1% · R 66.2%
- 2008→2024 swing
- -10.6pp toward R · 2008: -22.5pp · 2024: -33.1pp
- All cycles
- 2024: R+33.1 2020: R+24.7 2016: R+26.0 2012: R+30.1 2008: R+22.5
Not yet ingested
- Civics
- —
Market trends
- HPI YoY
- ▼ -194.86%
- Current HPI
- 279.4232
- Rent YoY
- ▲ 5.59%
- Metro
- Naples-Marco Island, FL
- State GDP YoY
- ▲ 3.28%
- F500 in state
- 36
Industry mix (Fortune 500 HQ in FL)
| Industry | F500 HQs | Revenue |
|---|---|---|
| Industrial Technology | 2 | $29B |
|
||
| Insurance | 2 | $17B |
|
||
| Retail | 1 | $60B |
|
||
| Technology Distribution | 1 | $58B |
|
||
| Homebuilding | 1 | $35B |
|
||
| Technology Manufacturing | 1 | $35B |
|
||
Price history
+65.3% since first listed12 events — show timeline
- 2026-05-11 Price Changed $410,000 NAPLESMLS
- 2026-02-18 Price Changed $420,000 NAPLESMLS
- 2025-10-22 Listed $445,000 NAPLESMLS
- 2012-04-27 Sold (Public Records) $190,000 Public Records
- 2012-04-20 Sold (MLS) $190,000 NAPLESMLS
- 2011-08-19 Listed $224,900 NAPLESMLS
- 2010-02-02 Listed $229,900 NAPLESMLS
- 2007-07-05 Listed $285,000 NAPLESMLS
- 2005-07-06 Sold (Public Records) $385,000 Public Records
- 1999-08-31 Sold (Public Records) $172,000 Public Records
- 1998-05-04 Sold (Public Records) $172,000 Public Records
- 1995-11-01 Sold (Public Records) $248,000 Public Records
Property tax history
+9.2%/yrLatest (2025): $4,551 · +10.1% YoY. Source: county tax records.
Cash-flow waterfall
monthlySold comps — $/sqft
last 12 mo · ≤1 miLoading sold comps…