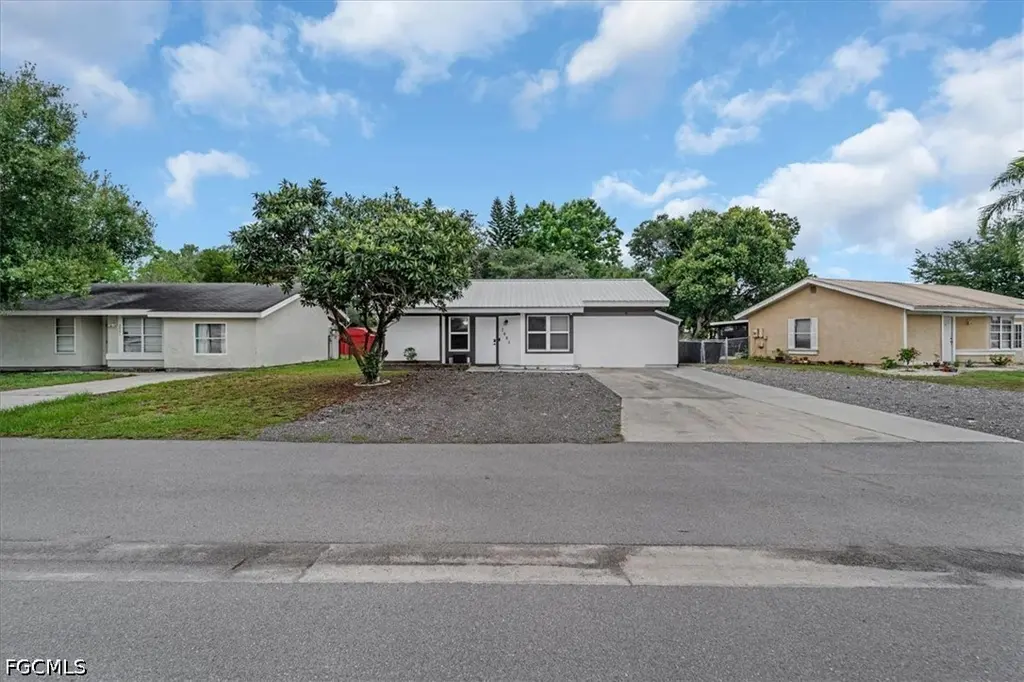
2003 Clipper Ter · Port LaBelle, FL
Flood risk 1/10 · Minimal
- FEMA flood zone
- X (unshaded)
- Chance of flooding over 30 yrs
- 0.0%
- Est. flood insurance / yr
- $507 – $1,088
Fire risk 3/10 · Minor
- Est. fire insurance / yr
- $947 – $1,759
Heat risk 9/10 · Severe
- Hot days now (above 108°F)
- 7 days/yr
- Hot days in 30 yrs
- 25 days/yr
Wind risk 10/10 · Severe
- Chance of severe wind over 30 yrs
- 99.0%
Air-quality risk 2/10 · Minimal
- Unhealthy air days now
- 0 days/yr
- Unhealthy air days in 30 yrs
- 1 days/yr
Risk factors via First Street. Map © Google.
Why this score? — see what drove the D- grade
The composite is a weighted blend of 9 inputs, each scored 0–100. Each bar is that input's sub-score; the figure is the points it added to the 100-point composite (weight × sub-score).
- Appreciation +10.0/10.0
- Cash flow +9.1/30.0
- ARV discount +3.9/15.0
- Schools +3.1/10.0
- Livability +3.1/5.0
- 1% rule +2.8/10.0
- DSCR +2.5/10.0
- Rent growth +2.5/5.0
- Condition / age +2.5/5.0
$204,999
🖨 Deal sheet (PDF) 📄 Offer letter ✓ Due diligence
Listing remarks MLS
Why rent when you can buy!! Cozy 2 bedroom 2 bath home located in Country Village right outside City of Labelle. Features 875 +/- sq. ft of living area plus a large Florida Room, galley kitchen with new cabinets and butcher block countertops, new vinyl plank flooring, new paint inside and out, new Hurricane Impact windows and new metal roof. The garage was converted, permitted, into a cozy master suite with walk in shower, double sink vanity with a split unit ac. The property also has a separate storage shed in the fenced in back yard. Make your appointment today. You will not be disappointed.
Key facts
- 6,969 sq ft lot
- Parking
- Community pool
Property features AI
Finance
- Financial info: Pets allowed
- HOA & community: Homeowners association with an annual fee of $410; Association covers management, recreation facilities, and street lights; Community amenities include clubhouse, pool, billiard room, shuffleboard court, dog park, storage, and street lights; Non-gated community
Exterior
- Parking: Driveway; Paved parking
- Security: High-impact doors
- Utilities: Cable available; Public water (assessment paid); Public sewer (assessment paid)
- Home design: Single-story home; Resale property; Faces west; Entry at level 1; Lot is rectangular with east exposure
- Construction: Stucco and wood frame construction; Metal roof
- Exterior features: Fence; Security/high-impact doors; Open patio and porch; Porch; Patio; Exterior storage; Community pool
Interior
- Kitchen: Range; Refrigerator
- Bedrooms: Includes a Florida room
- Flooring: Vinyl
- Bathrooms: 2 full bathrooms
- Heating & cooling: Central heating (electric); Central air; Ceiling fans; Window unit(s); Humidity control
- Interior features: Impact glass windows; Dual sinks; Living/dining room; Separate shower; Shower only; Split bedroom floor plan; Unfurnished
- Laundry & utility: Washer; Dryer
Neighborhood map
What this means for you Summary
Snapshot
- This is a 2-bed/2.0-bath single-family listed at $205k.
Deal economics
- At list price, monthly cash flow is $-156 ($-2k/yr) — negative.
- To cash-flow at today's rent, offer at most $177k (13.5% below list).
- To meet the 1% rule (rent ≥ 1% of price), the offer needs to be $160k (22.0% below list).
- Recommended offer: $160k (22.0% below list) — sets the bar for 1% rule.
Location & tenants
- Location reads 62/100 on livability (#750 in FL) — a middle-class / working-renter tenant base. Strengths: cost of living A+, housing A+; Watch: amenities F, commute F, employment F.
- Hendry (town): math 35% / reading 40% proficiency, ranked #65 of 73 in FL (top 89%) — families likely to look elsewhere, expect single-tenant / working-renter base with shorter leases; 75% free/reduced lunch — lower-income household profile, screen leases tightly.
- Zoned schools: Labelle Elementary School (math 37% / reading 37%, grade F, #1,609 of 2,144 statewide, top 77%, 437 students, 77% FRL); Labelle Middle School (math 37% / reading 38%, grade F, #395 of 571 statewide, top 70%, 817 students, 72% FRL); Labelle High School (math 42% / reading 41%, grade F, #284 of 667 statewide, top 43%, 1,451 students, 62% FRL).
- Market conditions: 950 active listings in the ZIP; 557 units permitted in Hendry County in 2024 (45 in 5+ unit buildings).
- This rent runs 34% of the median local income ($57k/yr) — at the standard rent-burdened threshold; future hikes will face affordability resistance.
Forward outlook
- In year one you build about $22k of equity ($1k loan paydown + $20k appreciation (10.0% local appreciation)).
- Hendry County population projected to shrink 7% by 2050 — rents likely to lag national; underwrite the cash flow, not the appreciation.
- By year 2, paydown + projected appreciation supports a ~$35k cash-out refi (75% LTV) — recoverable capital for the next deal without selling this one.
Negotiation context
- Only 8 days on market — expect competitive offers; lowballing is unlikely to land.
- 6 sale attempts since 28y ago with the ask held roughly flat each time — persistent listings suggest the price (not the market) is what's stuck; bring a comps-based counter.
- Current owner paid $177k; 16% above their basis — modest negotiation headroom, anchor on the comps not their cost.
Risks & watch-outs
- Climate carrying-cost: severe wind risk, 99% chance of damaging wind over 30y; extreme-heat days projected 7→25/yr by 2055 (HVAC capex compounding) — expect insurance premiums to compound above CPI over the hold.
Questions for the listing agent
- What do current leases actually rent for vs. the listed asking? Can we see a recent rent roll and the last 12 months of T-12 income?
- What does the HOA fee cover, when was the last increase, and are there any pending special assessments or reserve-fund shortfalls?
- Is there a deadline driving the sale (1031 exchange, divorce, estate, relocation)? That informs how much negotiation room exists.
- Schools are F-rated, which usually means shorter tenancies and higher turnover. Who's the typical renter profile here, and what's been the actual vacancy rate?
- The area grade is low — what's the realistic commute time and amenity access for the typical tenant pool here? Any planned neighborhood developments (good or bad) we should know about?
- What's the average days-on-market for RENTAL listings here right now (not sales)? A rising rental-DOM trend means longer vacancies and softer asking-rent achievability than the comps imply.
- What's the recent tenant-quality profile in this submarket — average credit score on applications, eviction rate, late-payment / NSF rate, and stable-employment percentage? A property-management company in the area should have these aggregated.
- How much new for-sale + rental construction is in the pipeline within 1–3 miles? Heavy new supply typically softens prices + rents 12–24 months out; constrained supply supports both.
Investment metrics
- 1% rule
- 0.78% ✗
- Cap rate
- 5.38%
- Cash-on-cash
- -3.26%
- DSCR
- 0.85
- GRM
- 10.7
CMA / ARV
- ARV (on-the-fly)
- $189,875
- Comps found
- 9
Show comp detail 9 sales within ~0.75 mi
| Address | Dist | Beds/Ba | Sqft | Sold | Price | $/sf | Match |
|---|---|---|---|---|---|---|---|
| 2013 Clipper Ter | 0.05mi | 2/2.0 | 964 (+10%) | 2mo | $179,900 | $187 | 79 |
| 2021 Clipper Terrace Trce | 0.10mi | 2/1.0 | 828 (-5%) | 11mo | $172,000 | $208 | 73 |
| 2016 Mariner Ct | 0.30mi | 2/2.0 | 920 (+5%) | 6mo | $200,000 | $217 | 73 |
| 2008 Lighthouse Ln | 0.12mi | 2/1.0 | 804 (-8%) | 9mo | $170,000 | $211 | 70 |
| 2001 Showboat Ln | 0.05mi | 2/1.0 | 804 (-8%) | 17mo | $185,000 | $230 | 66 |
| 2010 Mainstay St | 0.29mi | 2/2.0 | 924 (+6%) | 19mo | $218,900 | $237 | 61 |
| 2005 Showboat Ln | 0.06mi | 2/2.0 | 990 (+13%) | 19mo | $230,000 | $232 | 59 |
| 2009 Lighthouse Ln | 0.14mi | 2/2.0 | 964 (+10%) | 24mo | $197,000 | $204 | 57 |
| 2007 Clipper Ct | 0.21mi | 2/1.0 | 748 (-14%) | 15mo | $170,000 | $227 | 50 |
Match score weights: distance 35% · size 25% · config 20% · recency 20%. Top-matched comps best support the ARV.
Projected returns pro-forma
10.0% appreciation · 3.0% rent growth · sell at horizon
- IRR
- 22.0%
- Equity multiple
- 2.77×
- Total profit
- $101,728
- Equity at exit
- $184,679
- IRR
- 19.8%
- Equity multiple
- 6.36×
- Total profit
- $307,446
- Equity at exit
- $398,268
Cash invested: $57,400 (down + closing). Projections, not guarantees.
Landlord ↔ Tenant lean methodology
- Overall (STATE)
- 87 Strongly Landlord-Friendly
- State Florida
- 87 Strongly Landlord-Friendly · R+3
- County
- — inherits STATE
- City
- — inherits STATE
ZIP-level market 33935
- Home prices YoY
- 16.3%
- Active inventory
- 950
- Price-to-rent
- 10.7×
Monthly cashflow live
- Estimated rent
- $1,599 medium interval (Pro) →
- Mortgage (P&I)
- −$1,075
- Tax from tax record
- −$225 /mo · $2,703/yr
- Insurance
- −$85
- HOA
- −$34
- Vacancy / Maint / Mgmt
- −$336
- Net cashflow
- $-156
Break-even live
Sensitivity live
| Price | -10% $-40 | -5% $-98 | +0% $-156 | +5% $-214 | +10% $-272 |
|---|---|---|---|---|---|
| Rent | -10% $-283 | -5% $-219 | +0% $-156 | +5% $-93 | +10% $-30 |
| Rate | -1.0pp $-53 | -0.5pp $-104 | base $-156 | +0.5pp $-209 | +1.0pp $-263 |
UW: 25.0% down · 7.5% · 30yr · 1.5% tax · 5.0% vac · 8.0% maint · 8.0% mgmt
Financing live
Cash to close
- Down payment
- $51,250
- Closing costs
- $6,150
- Reserves months
- —
- Total cash needed
- —
Loan-product check · same deal, 3 products live
Conventional
25% down · 7.5% · 30yr
- Down + closing
- —
- Monthly P&I
- —
- Monthly cashflow
- —
- DSCR
- —
- Eligible?
- —
Personal DTI + credit; lowest rate.
DSCR
20% down · 8.5% · 30yr
- Down + closing
- —
- Monthly P&I
- —
- Monthly cashflow
- —
- DSCR
- —
- Eligible?
- —
No personal income docs; deal must DSCR.
Hard money
10% down · 12.0% · 12mo
- Down + closing
- —
- Monthly P&I
- —
- Monthly cashflow
- —
- DSCR
- —
- Eligible?
- —
Short-term bridge; refi at stabilization.
HOA detail
- Monthly dues
- $34 · $408/yr
Listing history 7 events
-
2026-06-22days on market $204,999 Active 8 DOM
-
2026-06-18days on market $204,999 Active 5 DOM
-
2026-06-17days on market $204,999 Active 4 DOM
-
2026-06-16days on market $204,999 Active 3 DOM
-
2026-06-15days on market $204,999 Active 2 DOM
-
2026-06-13remarks 695-char remark
-
2026-06-13$204,999 Active 1 DOM
ⓘ Source: listings_history table (triggers on properties + properties_extension) + one-shot
backfill from property_details.listing_events for pre-trigger history.
Tax reassessment forecast FL · Resets to sale price
- Current annual tax
- $2,703 · $225/mo
- Projected year-2 tax
- $2,703 · $225/mo
- Expected delta
- $0/yr ($0/mo · 0.0%)
ⓘ Screening estimate from a state-policy table — verify with the county assessor before closing.
Climate risk First Street
- Flood 1/10 Low FEMA zone X (unshaded) · 0% chance over 30 yrs
- Wildfire 3/10 Moderate
- Heat 9/10 Extreme 7 d/yr ≥108°F today · 25 d/yr by 30 yrs out
- Wind 10/10 Extreme 99% chance of damaging wind over 30 yrs
- Air quality 2/10 Low 0 unhealthy d/yr today · 1 by 30 yrs out
Nearby sold comps map
Loading sold comps map…
Walkable amenities ~0.75 mi
Loading nearby amenities…
Taxation est. · year 1
- Rental income
- $19,194
- − Mortgage interest
- −$11,483
- − Property taxes
- −$2,703
- − Insurance
- −$1,025
- − Repairs & maintenance
- −$1,535
- − Management
- −$1,535
- − HOA
- −$408
- − Depreciation
- −$5,964
- Taxable loss
- −$5,460
- Est. tax savings @ 24.0%
- +$1,311
- After-tax cash flow
- $-563/yr
For passive investors: Depreciation is non-cash, so a rental often shows a tax loss while cash-flowing — sheltering income. Rental losses are passive: they offset passive income freely, and up to $25,000/yr can offset ordinary (W-2) income if you actively participate and your MAGI is under $100k (phasing out to $0 by $150k); unused losses carry forward. On sale, claimed depreciation is recaptured at up to 25%, and gains may owe capital-gains tax (a 1031 exchange can defer both). Figures are a year-1 estimate at your 24.0% rate — not tax advice; consult a CPA.
Schools (NCES district)
- District
- Hendry
- NCES district ID
- 1200780
- Math proficiency
- 35% ▼ -11.00%
- Reading proficiency
- 40% ▼ -4.00%
- Median HH income
- $37,043
- Composite
- 31.16/100
- National rank
- #6054
- State rank
- #65 of 73 in FL
Livability — Port LaBelle
- Score
- 62/100
- State rank
- #750
- US rank
- #16264
Category grades
Schools grade is shown separately in the Schools card above.
Census & demographics
- Census place
- Port LaBelle, FL
- County
- Hendry County · 23,186 people
- Metro
- Clewiston, FL
- Population (ZIP)
- 23,186
- Household income
- $57,009
- Rent vs Own
- Severe rent burden
- 498.0
Population outlook (Hendry County) Hauer SSP2
- Today (2025)
- 38,866 people
- By 2030
- 38,558 · -0.8%
- By 2040
- 37,743 · -2.9%
- By 2050
- 36,117 · -7.1%
- By 2075
- 30,070 · -22.6%
- By 2100
- 21,966 · -43.5%
Race, ethnicity, and origin ACS 2023
- Neighborhood character
- Majority Hispanic (56%)
- Race & ethnicity
- Hispanic / Latino 56% White 39% Two or more races 21% Black 2% Native American 2%
- Hispanic origin (detail)
- Mexican 40% Puerto Rican 3% Cuban 5%
- Common ancestry
- Lithuanian 2% Serbian 2% Slovak 1%
- Foreign-born
- 27% · Canada, Jamaica
- Languages at home
- 50% English-only · Spanish 50%
Political lean MEDSL · Hendry
- 2024 margin
- Solid R (+38.3) · D 30.4% · R 68.7%
- 2008→2024 swing
- -31.1pp toward R · 2008: -7.2pp · 2024: -38.3pp
- All cycles
- 2024: R+38.3 2020: R+23.0 2016: R+14.2 2012: R+5.9 2008: R+7.2
Not yet ingested
- Civics
- —
Market trends
- HPI YoY
- ▲ 75.20%
- Current HPI
- 537.4928
- Rent YoY
- —
- Metro
- Clewiston, FL
- State GDP YoY
- ▲ 3.28%
- F500 in state
- 36
Industry mix (Fortune 500 HQ in FL)
| Industry | F500 HQs | Revenue |
|---|---|---|
| Industrial Technology | 2 | $29B |
|
||
| Insurance | 2 | $17B |
|
||
| Retail | 1 | $60B |
|
||
| Technology Distribution | 1 | $58B |
|
||
| Homebuilding | 1 | $35B |
|
||
| Technology Manufacturing | 1 | $35B |
|
||
Price history
+1181.2% since first listed18 events — show timeline
- 2026-06-13 Listed $204,999 FORTMLS
- 2022-05-20 Sold (Public Records) $177,000 Public Records
- 2022-05-18 Sold (MLS) $177,000 FORTMLS
- 2022-04-23 Pending — FORTMLS
- 2022-04-22 Relisted — FORTMLS
- 2022-03-29 Pending — FORTMLS
- 2022-03-25 Relisted — FORTMLS
- 2022-03-07 Pending — FORTMLS
- 2022-02-15 Listed $174,900 FORTMLS
- 2020-03-12 Sold (MLS) $81,000 FORTMLS
- 2020-02-25 Pending — FORTMLS
- 2020-02-21 Listed $89,000 FORTMLS
- 2012-08-08 Sold (MLS) $33,000 FORTMLS
- 2005-08-23 Sold (Public Records) $77,500 Public Records
- 2005-08-22 Sold (MLS) $77,500 FORTMLS
- 1998-07-06 Listed $31,000 FORTMLS
- 1989-04-01 Sold (Public Records) $19,500 Public Records
- 1988-12-01 Sold (Public Records) $16,000 Public Records
Property tax history
+12.5%/yrLatest (2025): $2,703 · +7.0% YoY. Source: county tax records.
Cash-flow waterfall
monthlySold comps — $/sqft
last 12 mo · ≤1 miLoading sold comps…