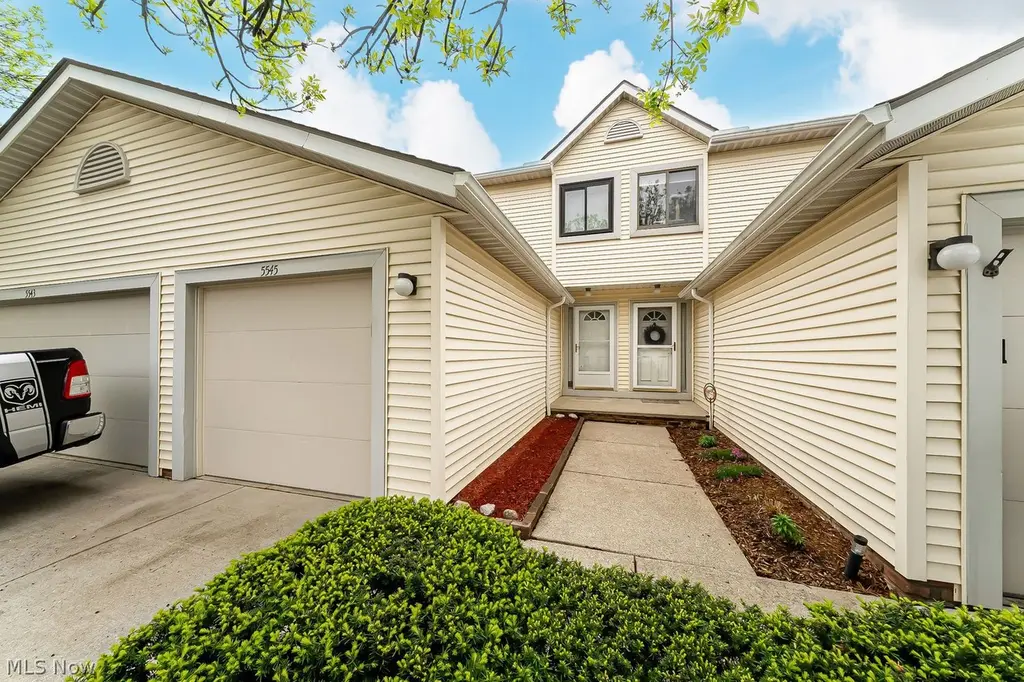
5545 Sunset Bldg A 5 Ln Unit B · Parma, OH
Flood risk 1/10 · Minimal
- FEMA flood zone
- X (unshaded)
- Chance of flooding over 30 yrs
- 0.0%
- Est. flood insurance / yr
- —
Fire risk No data
- Est. fire insurance / yr
- —
Heat risk 3/10 · Minor
- Hot days now (above 95°F)
- 7 days/yr
- Hot days in 30 yrs
- 17 days/yr
Wind risk 1/10 · Minimal
- Chance of severe wind over 30 yrs
- —
Air-quality risk No data
- Unhealthy air days now
- —
- Unhealthy air days in 30 yrs
- —
Risk factors via First Street. Map © Google.
Why this score? — see what drove the D grade
The composite is a weighted blend of 9 inputs, each scored 0–100. Each bar is that input's sub-score; the figure is the points it added to the 100-point composite (weight × sub-score).
- Cash flow +10.2/30.0
- ARV discount +8.0/15.0
- 1% rule +5.3/10.0
- Rent growth +5.0/5.0
- Schools +4.1/10.0
- Livability +4.1/5.0
- DSCR +2.9/10.0
- Condition / age +2.8/5.0
- Appreciation +0.0/10.0
$153,900
🖨 Deal sheet (PDF) 📄 Offer letter ✓ Due diligence
Listing remarks
Nice 2 Bedroom 2.5 Bath Condo With Partially Finished Basement, Large Great Room, Safe Step Walk-In Bathtub. 80X100 Community Pool! Amish Built Deck In 2024. Excellent Location Close To Restaurants & Shopping. Ready To Move In. This Won't Last!!
Key facts
- Community pool
- Excellent location
- $278 HOA
Tags
Neighborhood map
What this means for you Summary
Snapshot
- This is a 2-bed/2.5-bath condo listed at $154k. Condition is rated average.
Deal economics
- At list price, monthly cash flow is $-86 ($-1k/yr) — negative.
- To cash-flow at today's rent, offer at most $141k (8.1% below list).
- Meets the 1% rule at list price ($2k rent vs $154k).
- Recommended offer: $141k (8.1% below list) — sets the bar for cash-flow.
Location & tenants
- Location reads 82/100 on livability (#84 in OH, #1,232 nationally) — a professional / high-income tenant draw. Strengths: crime A+, amenities A+, cost of living A+; Watch: employment C-, commute F.
- Parma City (suburban): math 43% / reading 52% proficiency, ranked #469 of 656 in OH (top 72%) — families likely to look elsewhere, expect single-tenant / working-renter base with shorter leases.
- Zoned schools: John Muir Elementary School (math 37% / reading 32%, grade F, #1,113 of 1,584 statewide, top 71%, 352 students, 63% FRL); Hillside Middle School (math 63% / reading 67%, grade A-, #194 of 654 statewide, top 31%, 539 students, 44% FRL); Normandy High School (math 49% / reading 67%, grade C, #270 of 781 statewide, top 35%, 1,304 students, 39% FRL).
- Market conditions: Rents rising fast (+10.6%/yr); 120 active listings in the ZIP; 5 comparable units currently listed for rent nearby; rentals lingering (median 46d on market — plan ~5-8 weeks vacancy on turnover, expect pricing pressure); 60% of comp listings sitting > 30 days — soft ceiling on asking rent; 1,441 units permitted in Cuyahoga County in 2024 (700 in 5+ unit buildings).
Forward outlook
- Local home prices are declining (-3.0%/yr); year-one equity from $1k of loan paydown is wiped out by about $5k of value loss. Plan a longer hold.
- Cuyahoga County population projected to shrink 8% by 2050 — rents likely to lag national; underwrite the cash flow, not the appreciation.
Negotiation context
- It's been on market 52 days — a 3% lower offer ($149k) is reasonable based on typical stale-listing flexibility.
Questions for the listing agent
- What do current leases actually rent for vs. the listed asking? Can we see a recent rent roll and the last 12 months of T-12 income?
- It's been on market 52 days. Have you received any prior offers? Is the seller open to a 8% concession, seller financing, or rate buy-down credit?
- What does the HOA fee cover, when was the last increase, and are there any pending special assessments or reserve-fund shortfalls?
- Any open or pending special assessments — roof, HVAC, plumbing, elevator, façade? What's the per-unit balance and payoff schedule, and is the seller paying it off at close or rolling it to the buyer?
- Is there a deadline driving the sale (1031 exchange, divorce, estate, relocation)? That informs how much negotiation room exists.
- Schools are B-rated — typically a magnet for longer-tenancy family renters. What's the average tenant stay here, and is there a school-zone premium baked into asking?
- The area grade is low — what's the realistic commute time and amenity access for the typical tenant pool here? Any planned neighborhood developments (good or bad) we should know about?
- What's the average days-on-market for RENTAL listings here right now (not sales)? A rising rental-DOM trend means longer vacancies and softer asking-rent achievability than the comps imply.
- What's the recent tenant-quality profile in this submarket — average credit score on applications, eviction rate, late-payment / NSF rate, and stable-employment percentage? A property-management company in the area should have these aggregated.
- How much new apartment / multifamily construction is in the pipeline within 1–3 miles? Heavy new supply (>2% of stock underway) typically softens rents 12–24 months out; light construction supports rent growth.
Investment metrics
- 1% rule
- 1.03% ✓
- Cap rate
- 5.62%
- Cash-on-cash
- -2.40%
- DSCR
- 0.89
- GRM
- 8.1
CMA / ARV
- ARV (median comp)
- $155,527
- List price
- $153,900
- Delta
- -1.05%
- Verdict
- FAIR
- Comps
- 20 within 1.0 mi
Projected returns pro-forma
-3.0% appreciation · 8.0% rent growth · sell at horizon
- IRR
- -13.3%
- Equity multiple
- 0.49×
- Total profit
- $-21,836
- Equity at exit
- $22,947
- IRR
- 3.3%
- Equity multiple
- 1.30×
- Total profit
- $12,930
- Equity at exit
- $13,306
Cash invested: $43,092 (down + closing). Projections, not guarantees.
Landlord ↔ Tenant lean methodology
- Overall (STATE)
- 73 Landlord-Friendly
- State Ohio
- 73 Landlord-Friendly · R+6
- County
- — inherits STATE
- City
- — inherits STATE
ZIP-level market 44134
- Rents YoY
- 10.6%
- Active inventory
- 120
- Price-to-rent
- 8.1×
Monthly cashflow live
- Estimated rent
- $1,589 high interval (Pro) →
- Mortgage (P&I)
- −$807
- Tax est. 1.5%
- −$192 /mo · $2,308/yr
- Insurance
- −$64
- HOA
- −$278
- Lot rent
- −$0
- Vacancy / Maint / Mgmt
- −$334
- Net cashflow
- $-86
Break-even live
Sensitivity live
| Price | -10% $20 | -5% $-33 | +0% $-86 | +5% $-139 | +10% $-193 |
|---|---|---|---|---|---|
| Rent | -10% $-212 | -5% $-149 | +0% $-86 | +5% $-23 | +10% $39 |
| Rate | -1.0pp $-9 | -0.5pp $-47 | base $-86 | +0.5pp $-126 | +1.0pp $-167 |
UW: 25.0% down · 7.5% · 30yr · 1.5% tax · 5.0% vac · 8.0% maint · 8.0% mgmt
Financing live
Cash to close
- Down payment
- $38,475
- Closing costs
- $4,617
- Reserves months
- —
- Total cash needed
- —
Loan-product check · same deal, 3 products live
Conventional
25% down · 7.5% · 30yr
- Down + closing
- —
- Monthly P&I
- —
- Monthly cashflow
- —
- DSCR
- —
- Eligible?
- —
Personal DTI + credit; lowest rate.
DSCR
20% down · 8.5% · 30yr
- Down + closing
- —
- Monthly P&I
- —
- Monthly cashflow
- —
- DSCR
- —
- Eligible?
- —
No personal income docs; deal must DSCR.
Hard money
10% down · 12.0% · 12mo
- Down + closing
- —
- Monthly P&I
- —
- Monthly cashflow
- —
- DSCR
- —
- Eligible?
- —
Short-term bridge; refi at stabilization.
Rent comps 5 comps
| Address | Beds | Baths | Sqft | Rent | $/sqft | DOM | Units | Dist |
|---|---|---|---|---|---|---|---|---|
| 2611 Brookdale Ave Cleveland, OH | 3.0 | 1.0 | 1092 | $1,825 | $1.67 | 46d | 1 | 0.69mi |
| 2910 Fortune Ave Cleveland, OH | 2.0 | 1.0 | 744 | $1,775 | $2.39 | 26d | 1 | 0.82mi |
| 3027 Fortune Ave Unit 2 Parma, OH | 2.0 | 1.0 | 726 | $1,075 | $1.48 | 0d | 1 | 0.91mi |
| 3027 Fortune Ave Unit 1 Parma, OH | 2.0 | 1.0 | 880 | $1,175 | $1.34 | 46d | 1 | 0.91mi |
| 2907 Snow Rd Unit up Parma, OH | 3.0 | 1.0 | 1026 | $1,700 | $1.66 | 46d | 1 | 0.96mi |
HOA detail condo
- Monthly dues
- $278 · $3,336/yr
- Likely covers
- pool
- Assessments
- None detected in remarks — confirm with the listing agent.
Listing history 18 events
-
2026-06-22days on market $153,900 Active 52 DOM
-
2026-06-21days on market $153,900 Active 51 DOM
-
2026-06-18price $153,900 Active 48 DOM
-
2026-06-18days on market $159,000 Active 48 DOM
-
2026-06-17days on market $159,000 Active 47 DOM
-
2026-06-16days on market $159,000 Active 46 DOM
-
2026-06-15days on market $159,000 Active 45 DOM
-
2026-06-13days on market $159,000 Active 43 DOM
-
2026-06-13days on market $159,000 Active 42 DOM
-
2026-06-09days on market $159,000 Active 39 DOM
-
2026-06-08days on market $159,000 Active 38 DOM
-
2026-06-07days on market $159,000 Active 37 DOM
-
2026-06-05days on market $159,000 Active 34 DOM
-
2026-06-03days on market $159,000 Active 33 DOM
-
2026-06-02days on market $159,000 Active 32 DOM
-
2026-06-01days on market $159,000 Active 31 DOM
-
2026-05-31days on market $159,000 Active 30 DOM
-
2026-05-01$165,900 Active 252-char remark
ⓘ Source: listings_history table (triggers on properties + properties_extension) + one-shot
backfill from property_details.listing_events for pre-trigger history.
Climate risk First Street
- Flood 1/10 Low FEMA zone X (unshaded) · 0% chance over 30 yrs
- Heat 3/10 Moderate 7 d/yr ≥95°F today · 17 d/yr by 30 yrs out
- Wind 1/10 Low
Nearby sold comps map
Loading sold comps map…
Walkable amenities ~0.75 mi
Loading nearby amenities…
Taxation est. · year 1
- Rental income
- $19,069
- − Mortgage interest
- −$8,621
- − Property taxes
- −$2,308
- − Insurance
- −$770
- − Repairs & maintenance
- −$1,526
- − Management
- −$1,526
- − HOA
- −$3,336
- − Depreciation
- −$4,477
- Taxable loss
- −$3,494
- Est. tax savings @ 24.0%
- +$839
- After-tax cash flow
- $-196/yr
For passive investors: Depreciation is non-cash, so a rental often shows a tax loss while cash-flowing — sheltering income. Rental losses are passive: they offset passive income freely, and up to $25,000/yr can offset ordinary (W-2) income if you actively participate and your MAGI is under $100k (phasing out to $0 by $150k); unused losses carry forward. On sale, claimed depreciation is recaptured at up to 25%, and gains may owe capital-gains tax (a 1031 exchange can defer both). Figures are a year-1 estimate at your 24.0% rate — not tax advice; consult a CPA.
Condition & rehab AI · 12 photos
This townhouse is in average condition with some cosmetic repairs needed. It's move-in ready with a good location and community amenities.
Repairs flagged
- Minor exterior siding — Some discoloration
- Minor kitchen cabinets — Worn appearance
- Minor bathroom cabinets — Worn appearance
Value-add opportunities
- Both Paint interior walls — Fresh paint enhances curb appeal and interior aesthetics
- Both Replace carpet in living areas — New carpet improves comfort and appearance
- Both Replace kitchen cabinets — New cabinets modernize the kitchen and increase value
- Both Replace bathroom cabinets — New cabinets modernize the bathrooms and increase value
Renovation cost estimate screening
| Repair item | Severity | Est. cost |
|---|---|---|
| exterior siding · Some discoloration | Minor | $500–3,000 |
| kitchen cabinets · Worn appearance | Minor | $500–3,000 |
| bathroom cabinets · Worn appearance | Minor | $500–3,000 |
| Total estimated repair cost · 3 items | $1,500–9,000 |
Value-add ROI direction
- Both Paint interior walls — Fresh paint enhances curb appeal and interior aesthetics ↑
- Both Replace carpet in living areas — New carpet improves comfort and appearance ↑
- Both Replace kitchen cabinets — New cabinets modernize the kitchen and increase value ↑
- Both Replace bathroom cabinets — New cabinets modernize the bathrooms and increase value ↑
ⓘ Cost ranges are severity-bucket heuristics (US national rule-of-thumb). Get contractor quotes + a written scope before underwriting a rehab budget.
Schools (NCES district)
- District
- Parma City
- NCES district ID
- 3904463
- Math proficiency
- 43% ▼ -18.00%
- Reading proficiency
- 52% ▼ -10.00%
- Median HH income
- $50,371
- Composite
- 40.72/100
- National rank
- #3662
- State rank
- #469 of 656 in OH
Livability — Parma
- Score
- 82/100
- State rank
- #84
- US rank
- #1232
Category grades
Schools grade is shown separately in the Schools card above.
Census & demographics
- Census place
- Parma, OH
- County
- Cuyahoga County · 1,090,369 people
- City population
- 66,574
- Metro
- Cleveland-Elyria, OH
- Population (ZIP)
- 37,774
- Household income
- $68,625
- Rent vs Own
- Severe rent burden
- 668.0
Population outlook (Cuyahoga County) Hauer SSP2
- Today (2025)
- 1,244,621 people
- By 2030
- 1,230,093 · -1.2%
- By 2040
- 1,189,108 · -4.5%
- By 2050
- 1,145,706 · -7.9%
- By 2075
- 1,076,557 · -13.5%
- By 2100
- 978,987 · -21.3%
Race, ethnicity, and origin ACS 2023
- Neighborhood character
- Predominantly White (85%)
- Race & ethnicity
- White 85% Two or more races 6% Hispanic / Latino 5% Black 3% Asian 3%
- Common ancestry
- Romanian 14% Subsaharan African 6% Slovak 1%
- Foreign-born
- 11% · Canada, Vietnam
- Languages at home
- 84% English-only · Russian/Polish/Slavic 7% Spanish 3% Other Indo-European 2%
Political lean MEDSL · Cuyahoga
- 2024 margin
- Solid D (+31.5) · D 65.4% · R 33.9%
- 2008→2024 swing
- -7.4pp toward R · 2008: 38.9pp · 2024: 31.5pp
- All cycles
- 2024: D+31.5 2020: D+34.1 2016: D+35.0 2012: D+38.7 2008: D+38.9
Not yet ingested
- Civics
- —
Market trends
- HPI YoY
- ▼ -215.17%
- Current HPI
- 184.0553
- Rent YoY
- ▲ 10.56%
- Metro
- Cleveland-Elyria, OH
- State GDP YoY
- ▲ 1.98%
- F500 in state
- 48
Industry mix (Fortune 500 HQ in OH)
| Industry | F500 HQs | Revenue |
|---|---|---|
| Insurance | 3 | $145B |
|
||
| Industrial Machinery | 3 | $49B |
|
||
| Financial Services | 3 | $24B |
|
||
| Consumer Goods | 2 | $93B |
|
||
| Aerospace / Defense | 2 | $47B |
|
||
| Utilities | 2 | $33B |
|
||
Price history
-7.2% since first listed3 events — show timeline
- 2026-06-18 Price Changed $153,900 MLSNOW
- 2026-05-29 Price Changed $159,000 MLSNOW
- 2026-05-01 Listed $165,900 MLSNOW
Cash-flow waterfall
monthlySold comps — $/sqft
last 12 mo · ≤1 miLoading sold comps…