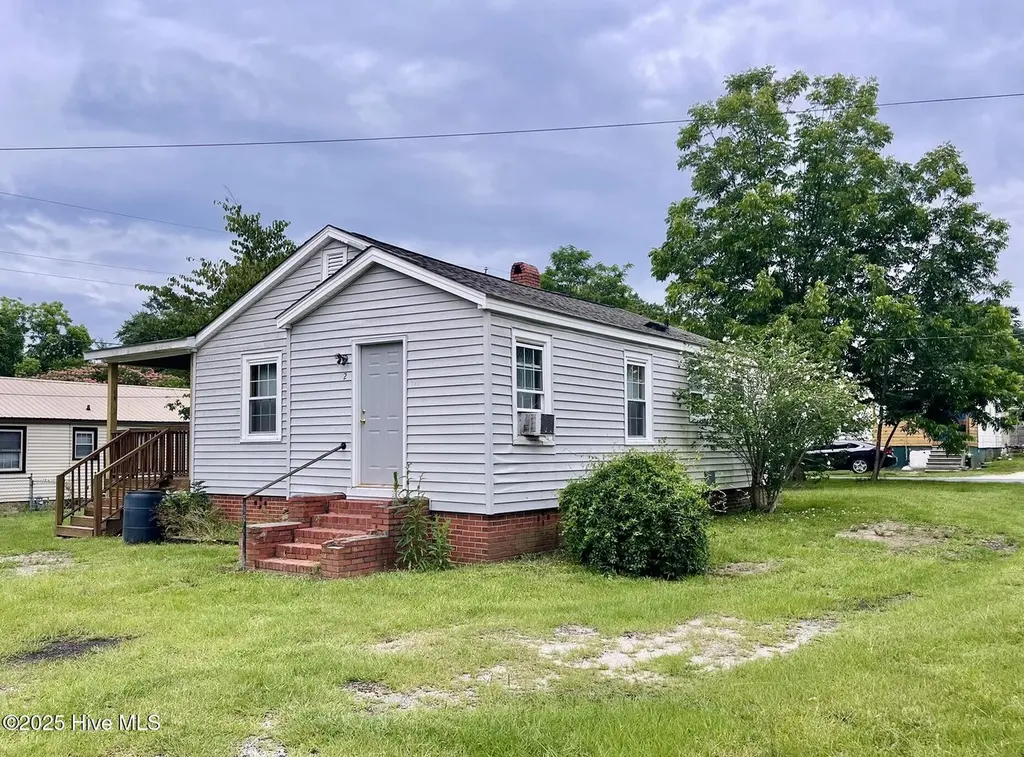
232 Aleo Seventh Ave · East Rockingham, NC
Flood risk 1/10 · Minimal
- FEMA flood zone
- X (unshaded)
- Chance of flooding over 30 yrs
- 0.0%
- Est. flood insurance / yr
- $507 – $1,088
Fire risk 5/10 · Moderate
- Est. fire insurance / yr
- $906 – $1,684
Heat risk 7/10 · Major
- Hot days now (above 108°F)
- 7 days/yr
- Hot days in 30 yrs
- 16 days/yr
Wind risk 6/10 · Moderate
- Chance of severe wind over 30 yrs
- 64.0%
Air-quality risk 1/10 · Minimal
- Unhealthy air days now
- 0 days/yr
- Unhealthy air days in 30 yrs
- 0 days/yr
Risk factors via First Street. Map © Google.
Why this score? — see what drove the B- grade
The composite is a weighted blend of 9 inputs, each scored 0–100. Each bar is that input's sub-score; the figure is the points it added to the 100-point composite (weight × sub-score).
- Cash flow +30.0/30.0
- DSCR +10.0/10.0
- 1% rule +9.3/10.0
- ARV discount +7.5/15.0
- Livability +2.9/5.0
- Schools +2.7/10.0
- Rent growth +2.5/5.0
- Condition / age +2.5/5.0
- Appreciation +0.0/10.0
$87,900
🖨 Deal sheet 📄 Offer letter ✓ Due diligence
Listing remarks
Cute and cozy, this 2 bedroom, 1 bath home has everything you need without the extra upkeep. The kitchen and dining area flow together for an easy layout, and the large covered deck is perfect for relaxing or hanging out with friends. Sitting on a . 17 acre lot, it's a great fit for first time buyers, those wanting to downsize, or anyone looking for a low maintenance home with charm.
Key facts
- Covered deck
- Low maintenance home
- Easy layout
Tags
Property features AI
Finance
- Other: Zoning: VR
Exterior
- Parking: Unpaved parking
- Utilities: Sewer connected; Water connected
- Home design: Single-family residence; One story; Entry level: 1; Vinyl siding and frame construction
- Construction: Shingle roof; Brick/mortar foundation
- Exterior features: Covered patio/porch; Deck; Has a view; Paved road access; Fencing: none
Interior
- Kitchen: Refrigerator
- Bedrooms: 4 rooms total
- Bathrooms: 1 full bathroom
- Heating & cooling: No central heating; Wall/window cooling unit(s)
- Interior features: Ceiling fan(s); Crawl space basement
Neighborhood map
What this means for you Summary
Snapshot
- This is a 2-bed/1.0-bath single-family listed at $88k.
Deal economics
- At list price, monthly cash flow is $456 ($5k/yr) — positive.
- The deal already cash-flows at list — no discount required.
- Meets the 1% rule at list price ($1k rent vs $88k).
- Recommended offer: $85k (3.0% below list) — sets the bar for market timing.
Location & tenants
- Location reads 58/100 on livability (#579 in NC) — a working-class tenant base; expect higher turnover. Strengths: cost of living A+, housing A+; Watch: amenities F, commute F, employment F.
- Richmond County Schools (town): math 30% / reading 36% proficiency, ranked #139 of 178 in NC (top 78%) — families likely to look elsewhere, expect single-tenant / working-renter base with shorter leases; 70% free/reduced lunch — lower-income household profile, screen leases tightly.
- Zoned schools: East Rockingham Elementary (math 28% / reading 32%, grade F, #965 of 1,410 statewide, top 69%, 514 students, 99% FRL); Cordova Middle (math 17% / reading 36%, grade F, #381 of 475 statewide, top 81%, 270 students, 99% FRL); Richmond Senior High (math 58% / reading 38%, grade D, #329 of 535 statewide, top 62%, 1,286 students, 99% FRL) — zoned schools average 99% FRL vs 70% district-wide (30 pts higher); higher-poverty schools than district average — tighter screening recommended.
- Market conditions: 155 active listings in the ZIP; 54 units permitted in Richmond County in 2024 (0 in 5+ unit buildings).
Forward outlook
- Local home prices are declining (-3.0%/yr); year-one equity from $608 of loan paydown is wiped out by about $3k of value loss. Plan a longer hold.
- Richmond County population projected at -22% by 2050 — secular population decline; favor cash flow + early exit over multi-decade hold.
- At projected returns (-3.0% appreciation + 3.0% rent growth), your $25k cash investment doubles in ~6 years — after that, you're playing with house money.
Negotiation context
- It's been on market 60 days — a 3% lower offer ($85k) is reasonable based on typical stale-listing flexibility.
- 2 sale attempts with the ask held roughly flat each time — persistent listings suggest the price (not the market) is what's stuck; bring a comps-based counter.
Risks & watch-outs
- Climate carrying-cost: major wind risk, 64% chance of damaging wind over 30y; moderate wildfire risk; extreme-heat days projected 7→16/yr by 2055 (HVAC capex compounding) — expect insurance premiums to compound above CPI over the hold.
Questions for the listing agent
- It's been on market 60 days. Have you received any prior offers? Is the seller open to a 3% concession, seller financing, or rate buy-down credit?
- Built in 1960 — when were the roof, HVAC, electrical panel, plumbing, and water heater last replaced?
- Is there a deadline driving the sale (1031 exchange, divorce, estate, relocation)? That informs how much negotiation room exists.
- Schools are F-rated, which usually means shorter tenancies and higher turnover. Who's the typical renter profile here, and what's been the actual vacancy rate?
- What's the average days-on-market for RENTAL listings here right now (not sales)? A rising rental-DOM trend means longer vacancies and softer asking-rent achievability than the comps imply.
- What's the recent tenant-quality profile in this submarket — average credit score on applications, eviction rate, late-payment / NSF rate, and stable-employment percentage? A property-management company in the area should have these aggregated.
- How much new for-sale + rental construction is in the pipeline within 1–3 miles? Heavy new supply typically softens prices + rents 12–24 months out; constrained supply supports both.
Investment metrics
- 1% rule
- 1.43% ✓
- Cap rate
- 12.51%
- Cash-on-cash
- 22.21%
- DSCR
- 1.99
- GRM
- 5.8
CMA / ARV
- ARV (on-the-fly)
- $53,064
- Comps found
- 5
Show comp detail 5 sales within ~0.75 mi
| Address | Dist | Beds/Ba | Sqft | Sold | Price | $/sf | Match |
|---|---|---|---|---|---|---|---|
| 156 Third Avenue Aleo | 0.16mi | 2/1.0 | 806 (+0%) | 21mo | $60,000 | $74 | 75 |
| 179 Aleo Second Ave | 0.26mi | 2/1.0 | 896 (+11%) | 4mo | $110,000 | $123 | 66 |
| 117 Smith St | 0.32mi | 3/1.0 (+1) | 720 (-10%) | 8mo | $47,500 | $66 | 56 |
| 162 Safie Fifth St | 0.63mi | 2/2.0 | 788 (-2%) | 10mo | $45,000 | $57 | 54 |
| 105 Rohanen Ave | 0.40mi | 2/1.0 | 700 (-13%) | 14mo | $36,000 | $51 | 48 |
Match score weights: distance 35% · size 25% · config 20% · recency 20%. Top-matched comps best support the ARV.
Projected returns pro-forma
-3.0% appreciation · 3.0% rent growth · sell at horizon
- IRR
- 14.9%
- Equity multiple
- 1.60×
- Total profit
- $14,747
- Equity at exit
- $13,106
- IRR
- 23.6%
- Equity multiple
- 3.04×
- Total profit
- $50,101
- Equity at exit
- $7,600
Cash invested: $24,612 (down + closing). Projections, not guarantees.
Landlord ↔ Tenant lean methodology
- Overall (STATE)
- 85 Strongly Landlord-Friendly
- State North Carolina
- 85 Strongly Landlord-Friendly · R+3
- County
- — inherits STATE
- City
- — inherits STATE
ZIP-level market 28379
- Home prices YoY
- -32.4%
- Active inventory
- 155
- Price-to-rent
- 5.8×
Monthly cashflow live
- Estimated rent
- $1,254 medium interval (Pro) →
- Mortgage (P&I)
- −$461
- Tax from tax record
- −$38 /mo · $452/yr
- Insurance
- −$37
- HOA
- −$0
- Vacancy / Maint / Mgmt
- −$263
- Net cashflow
- $456
Break-even live
UW: 25.0% down · 7.5% · 30yr · 1.5% tax · 5.0% vac · 8.0% maint · 8.0% mgmt
Financing live
Cash to close
- Down payment
- $21,975
- Closing costs
- $2,637
- Reserves months
- —
- Total cash needed
- —
Loan-product check · same deal, 3 products live
Conventional
25% down · 7.5% · 30yr
- Down + closing
- —
- Monthly P&I
- —
- Monthly cashflow
- —
- DSCR
- —
- Eligible?
- —
Personal DTI + credit; lowest rate.
DSCR
20% down · 8.5% · 30yr
- Down + closing
- —
- Monthly P&I
- —
- Monthly cashflow
- —
- DSCR
- —
- Eligible?
- —
No personal income docs; deal must DSCR.
Hard money
10% down · 12.0% · 12mo
- Down + closing
- —
- Monthly P&I
- —
- Monthly cashflow
- —
- DSCR
- —
- Eligible?
- —
Short-term bridge; refi at stabilization.
Listing history 20 events
-
2026-06-19days on market $87,900 Active 60 DOM
-
2026-06-18days on market $87,900 Active 59 DOM
-
2026-06-17days on market $87,900 Active 58 DOM
-
2026-06-16days on market $87,900 Active 57 DOM
-
2026-06-15days on market $87,900 Active 56 DOM
-
2026-06-14days on market $87,900 Active 54 DOM
-
2026-06-13days on market $87,900 Active 53 DOM
-
2026-06-10days on market $87,900 Active 51 DOM
-
2026-06-09days on market $87,900 Active 50 DOM
-
2026-06-08days on market $87,900 Active 49 DOM
-
2026-06-07days on market $87,900 Active 48 DOM
-
2026-06-05days on market $87,900 Active 45 DOM
-
2026-06-03days on market $87,900 Active 44 DOM
-
2026-06-02days on market $87,900 Active 43 DOM
-
2026-06-01days on market $87,900 Active 42 DOM
-
2026-05-31days on market $87,900 Active 41 DOM
-
2026-05-30days on market $87,900 Active 40 DOM
-
2025-12-31historical
-
2025-09-18$99,000 Active
-
2025-09-18$87,900 Active
ⓘ Source: listings_history table (triggers on properties + properties_extension) + one-shot
backfill from property_details.listing_events for pre-trigger history.
Tax reassessment forecast NC · Resets to sale price
- Current annual tax
- $452 · $38/mo
- Projected year-2 tax
- $721 · $60/mo
- Expected delta
- +$269/yr (+$22/mo · 59.6%)
ⓘ Screening estimate from a state-policy table — verify with the county assessor before closing.
Climate risk First Street
- Flood 1/10 Low FEMA zone X (unshaded) · 0% chance over 30 yrs
- Wildfire 5/10 Major
- Heat 7/10 Severe 7 d/yr ≥108°F today · 16 d/yr by 30 yrs out
- Wind 6/10 Major 64% chance of damaging wind over 30 yrs
- Air quality 1/10 Low 0 unhealthy d/yr today · 0 by 30 yrs out
Nearby sold comps map
Loading sold comps map…
Walkable amenities ~0.75 mi
Loading nearby amenities…
Taxation est. · year 1
- Rental income
- $15,050
- − Mortgage interest
- −$4,924
- − Property taxes
- −$452
- − Insurance
- −$440
- − Repairs & maintenance
- −$1,204
- − Management
- −$1,204
- − Depreciation
- −$2,557
- Taxable income
- $4,270
- Est. tax owed @ 24.0%
- −$1,025
- After-tax cash flow
- $4,442/yr
For passive investors: Depreciation is non-cash, so a rental often shows a tax loss while cash-flowing — sheltering income. Rental losses are passive: they offset passive income freely, and up to $25,000/yr can offset ordinary (W-2) income if you actively participate and your MAGI is under $100k (phasing out to $0 by $150k); unused losses carry forward. On sale, claimed depreciation is recaptured at up to 25%, and gains may owe capital-gains tax (a 1031 exchange can defer both). Figures are a year-1 estimate at your 24.0% rate — not tax advice; consult a CPA.
Schools (NCES district)
- District
- Richmond County Schools
- NCES district ID
- 3703870
- Math proficiency
- 30% ▼ -12.00%
- Reading proficiency
- 36% ▼ -3.00%
- Median HH income
- $32,224
- Composite
- 26.97/100
- National rank
- #7076
- State rank
- #139 of 178 in NC
Livability — East Rockingham
- Score
- 58/100
- State rank
- #579
- US rank
- #21339
Category grades
Schools grade is shown separately in the Schools card above.
Census & demographics
- Census place
- East Rockingham, NC
- Population (ZIP)
- 24,068
Population outlook (Richmond County) Hauer SSP2
- Today (2025)
- 42,892 people
- By 2030
- 41,257 · -3.8%
- By 2040
- 37,629 · -12.3%
- By 2050
- 33,655 · -21.5%
- By 2075
- 23,992 · -44.1%
- By 2100
- 14,782 · -65.5%
Race, ethnicity, and origin ACS 2023
- Neighborhood character
- Diverse neighborhood (Simpson 0.58)
- Race & ethnicity
- White 56% Black 32% Hispanic / Latino 8% Two or more races 4% Asian 1%
- Hispanic origin (detail)
- Mexican 6%
- Common ancestry
- Serbian 2% Slovak 2% Lithuanian 1%
- Foreign-born
- 4% · Canada, Jamaica
- Languages at home
- 91% English-only · Spanish 7%
Political lean MEDSL · Richmond
- 2024 margin
- Strong R (+20.9) · D 39.2% · R 60.1%
- 2008→2024 swing
- -22.4pp toward R · 2008: 1.5pp · 2024: -20.9pp
- All cycles
- 2024: R+20.9 2020: R+14.8 2016: R+10.1 2012: D+2.7 2008: D+1.5
Not yet ingested
- Civics
- —
Market trends
- HPI YoY
- ▼ -97.10%
- Current HPI
- 203.0628
- Rent YoY
- —
- Metro
- —
- State GDP YoY
- ▲ 3.28%
- F500 in state
- 26
Industry mix (Fortune 500 HQ in NC)
| Industry | F500 HQs | Revenue |
|---|---|---|
| Financial Services | 2 | $213B |
|
||
| Retail | 2 | $95B |
|
||
| Industrial Conglomerate | 1 | $38B |
|
||
| Metals / Steel | 1 | $35B |
|
||
| Utilities | 1 | $30B |
|
||
| Industrial Machinery | 1 | $19B |
|
||
Price history
-11.2% since first listed3 events — show timeline
- 2025-12-31 Listing Removed — Hive MLS
- 2025-09-18 Listed $87,900 Hive MLS
- 2025-09-18 Listed $99,000 Hive MLS
Property tax history
+1.3%/yrLatest (2025): $452 · -1.4% YoY. Source: county tax records.
Cash-flow waterfall
monthlySold comps — $/sqft
last 12 mo · ≤1 miLoading sold comps…