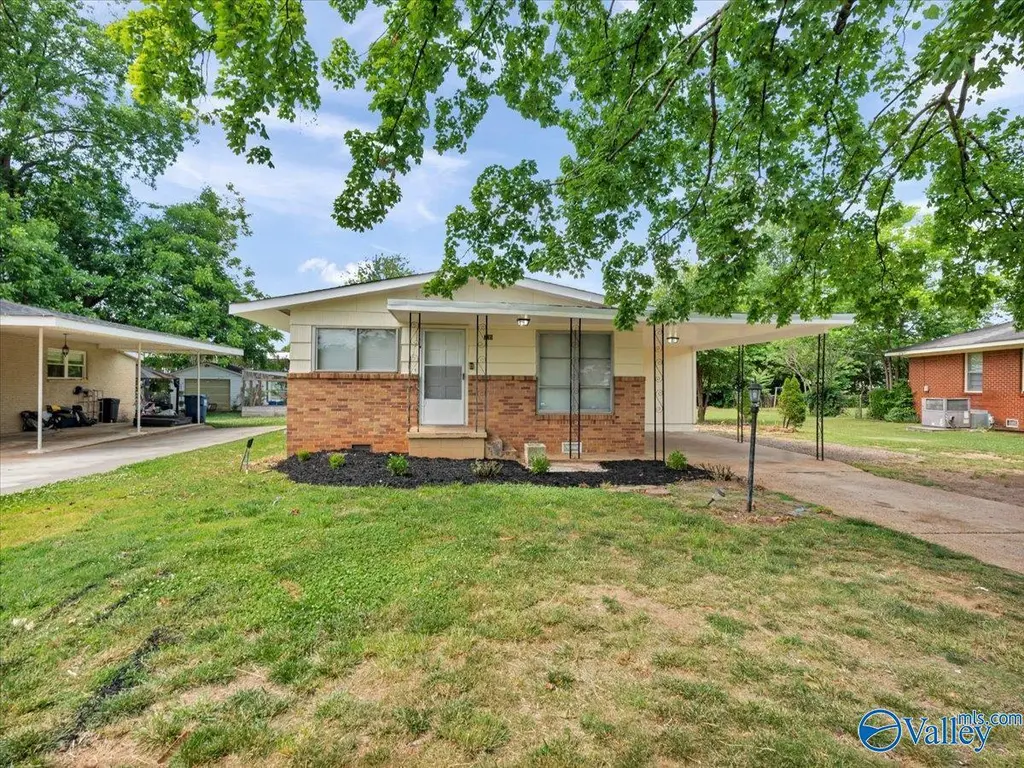
735 W Arbor Dr NW · Huntsville, AL
Flood risk 4/10 · Minor
- FEMA flood zone
- X (shaded)
- Chance of flooding over 30 yrs
- 0.22%
- Est. flood insurance / yr
- $507 – $1,088
Fire risk 1/10 · Minimal
- Est. fire insurance / yr
- $916 – $1,700
Heat risk 6/10 · Moderate
- Hot days now (above 104°F)
- 7 days/yr
- Hot days in 30 yrs
- 19 days/yr
Wind risk 4/10 · Minor
- Chance of severe wind over 30 yrs
- 19.0%
Air-quality risk 2/10 · Minimal
- Unhealthy air days now
- 1 days/yr
- Unhealthy air days in 30 yrs
- 1 days/yr
Risk factors via First Street. Map © Google.
Why this score? — see what drove the C- grade
The composite is a weighted blend of 9 inputs, each scored 0–100. Each bar is that input's sub-score; the figure is the points it added to the 100-point composite (weight × sub-score).
- Cash flow +19.8/30.0
- ARV discount +9.2/15.0
- DSCR +6.3/10.0
- 1% rule +4.2/10.0
- Rent growth +4.2/5.0
- Livability +4.1/5.0
- Schools +2.9/10.0
- Condition / age +2.5/5.0
- Appreciation +1.4/10.0
$145,000
🖨 Deal sheet 📄 Offer letter ✓ Due diligence
Listing remarks
Nice and clean! 3 bed/1 bath bungalow centrally located just off of Memorial Parkway. All hardwoods just refinished. All new fresh paint throughout the entire home. Nice kitchen with adjacent breakfast room. Updated, clean bathroom with new vanity, new commode and freshly reglazed tub/shower. Really neat fire pit/patio combo out back.
Key facts
- New fresh paint
- New vanity
- Hardwoods refinished
Tags
Property features AI
Finance
- HOA & community: No homeowners association; Located in the Pearsall Gardens subdivision
Exterior
- Parking: Carport (1 space); Concrete driveway
- Utilities: Public sewer
- Home design: Single-family residence; Residential property; Built in 1963; One-story
- Construction: Masonite exterior
- Exterior features: Patio; Public water
Interior
- Bathrooms: 1 full bathroom
- Heating & cooling: Central heating; Central cooling
- Interior features: Crawl space basement; 6 total rooms
Neighborhood map
What this means for you Summary
Snapshot
- This is a 3-bed/1.0-bath single-family listed at $145k.
Deal economics
- At list price, monthly cash flow is $171 ($2k/yr) — positive.
- The deal already cash-flows at list — no discount required.
- To meet the 1% rule (rent ≥ 1% of price), the offer needs to be $134k (7.6% below list).
- Recommended offer: $134k (7.6% below list) — sets the bar for 1% rule.
- Cap rate 7.7% vs local median 3.8% in Huntsville — top-decile yield for the area; either an underpriced asset or a hidden risk that comps aren't pricing in. Stress-test before assuming the spread holds.
Location & tenants
- Location reads 82/100 on livability (#3 in AL, #1,082 nationally) — a professional / high-income tenant draw. Strengths: commute A+, cost of living A+, housing A+; Watch: crime F.
- Huntsville City (urban): math 21% / reading 46% proficiency, ranked #48 of 129 in AL (top 37%) — families likely to look elsewhere, expect single-tenant / working-renter base with shorter leases.
- Zoned schools: Montview Elementary School (math 2% / reading 22%, grade F, #536 of 627 statewide, top 88%, 227 students, 87% FRL); Chapman Middle School (math 2% / reading 23%, grade F, #216 of 257 statewide, top 86%, 368 students, 88% FRL); Lee High School (math 2% / reading 17%, grade F, #252 of 305 statewide, top 84%, 840 students, 77% FRL) — zoned schools average 84% FRL vs 46% district-wide (38 pts higher); higher-poverty schools than district average — tighter screening recommended.
- Zoned-school proficiency averages 12% at this address vs 34% district-wide (-22 pts) — the specific schools serving this property underperform the Huntsville City average; the district grade overstates school quality for this exact location.
- Market conditions: Rents rising fast (+6.8%/yr); 560 active listings in the ZIP; 40 comparable units currently listed for rent nearby; rentals lingering (median 44d on market — plan ~5-8 weeks vacancy on turnover, expect pricing pressure); 62% of comp listings sitting > 30 days — soft ceiling on asking rent; solid renter incomes; 4,709 units permitted in Madison County in 2024 (1,186 in 5+ unit buildings).
- This rent is only 18% of the median local income ($91k/yr) — well below the 30% rent-burden line; pricing power to push rent on renewal without tenant pushback.
Forward outlook
- Local home prices are declining (-3.0%/yr); year-one equity from $1k of loan paydown is wiped out by about $4k of value loss. Plan a longer hold.
- Madison County population projected at +18% by 2050 — long-run rental-demand tailwind backs the buy-and-hold thesis.
- At projected returns (-3.0% appreciation + 6.8% rent growth), your $41k cash investment doubles in ~10 years — after that, you're playing with house money.
Negotiation context
- It's been on market 29 days — a 2% lower offer ($143k) is reasonable based on typical stale-listing flexibility.
- Current owner paid $90k; list at $145k implies a 61% gain — meaningful room to come down on a strong offer.
Risks & watch-outs
- Climate carrying-cost: extreme-heat days projected 7→19/yr by 2055 (HVAC capex compounding) — expect insurance premiums to compound above CPI over the hold.
Questions for the listing agent
- Built in 1963 — when were the roof, HVAC, electrical panel, plumbing, and water heater last replaced?
- Is there a deadline driving the sale (1031 exchange, divorce, estate, relocation)? That informs how much negotiation room exists.
- Crime grade is F in this area — have there been break-ins, vandalism, or insurance claims at this property in the last 3 years? What carrier currently insures it and at what premium?
- What's the average days-on-market for RENTAL listings here right now (not sales)? A rising rental-DOM trend means longer vacancies and softer asking-rent achievability than the comps imply.
- What's the recent tenant-quality profile in this submarket — average credit score on applications, eviction rate, late-payment / NSF rate, and stable-employment percentage? A property-management company in the area should have these aggregated.
- How much new for-sale + rental construction is in the pipeline within 1–3 miles? Heavy new supply typically softens prices + rents 12–24 months out; constrained supply supports both.
Investment metrics
- 1% rule
- 0.92% ✗
- Cap rate
- 7.71%
- Cash-on-cash
- 5.06%
- DSCR
- 1.23
- GRM
- 9.0
CMA / ARV
- ARV (on-the-fly)
- $150,675
- Comps found
- 12
Show comp detail 12 sales within ~0.75 mi
| Address | Dist | Beds/Ba | Sqft | Sold | Price | $/sf | Match |
|---|---|---|---|---|---|---|---|
| 1300 Buford St NW | 0.33mi | 2/1.0 (-1) | 1,010 (-2%) | 3mo | $180,000 | $178 | 74 |
| 2116 Virginia Blvd NW | 0.48mi | 3/1.0 | 1,000 (-2%) | 9mo | $141,750 | $142 | 66 |
| 2710 Monticello Dr NW | 0.71mi | 3/1.0 | 1,020 (-0%) | 3mo | $178,900 | $175 | 63 |
| 1213 NW Grace St | 0.37mi | 3/1.0 | 980 (-4%) | 15mo | $90,000 | $92 | 63 |
| 2409 Kildare St NW | 0.64mi | 2/1.0 (-1) | 1,030 (+0%) | 10mo | $155,000 | $150 | 56 |
| 506 Redbud Dr NW | 0.48mi | 3/1.0 | 978 (-5%) | 18mo | $99,900 | $102 | 55 |
| 2413 Kildare St NW | 0.65mi | 2/1.0 (-1) | 976 (-5%) | 8mo | $147,000 | $151 | 50 |
| 2706 Monticello Dr NW | 0.71mi | 3/1.0 | 975 (-5%) | 11mo | $153,999 | $158 | 50 |
| 2616 Huntsville St | 0.68mi | 2/1.0 (-1) | 1,000 (-2%) | 12mo | $60,000 | $60 | 49 |
| 409 Max Luther Dr | 0.70mi | 2/1.0 (-1) | 1,000 (-2%) | 12mo | $60,000 | $60 | 48 |
| 2101 Virginia Blvd | 0.46mi | 3/1.0 | 925 (-10%) | 18mo | $127,500 | $138 | 47 |
| 2606 Hanover Dr | 0.62mi | 3/1.5 | 1,158 (+13%) | 12mo | $170,000 | $147 | 37 |
Match score weights: distance 35% · size 25% · config 20% · recency 20%. Top-matched comps best support the ARV.
Projected returns pro-forma
-3.0% appreciation · 6.81% rent growth · sell at horizon
- IRR
- -4.7%
- Equity multiple
- 0.82×
- Total profit
- $-7,301
- Equity at exit
- $21,620
- IRR
- 8.7%
- Equity multiple
- 1.77×
- Total profit
- $31,160
- Equity at exit
- $12,537
Cash invested: $40,600 (down + closing). Projections, not guarantees.
Landlord ↔ Tenant lean methodology
- Overall (STATE)
- 90 Strongly Landlord-Friendly
- State Alabama
- 90 Strongly Landlord-Friendly · R+15
- County
- — inherits STATE
- City
- — inherits STATE
ZIP-level market 35811
- Home prices YoY
- -2.1%
- Rents YoY
- 6.8%
- Active inventory
- 560
- Price-to-rent
- 9.0×
Monthly cashflow live
- Estimated rent
- $1,340 high interval (Pro) →
- Mortgage (P&I)
- −$760
- Tax from tax record
- −$66 /mo · $796/yr
- Insurance
- −$60
- HOA
- −$0
- Vacancy / Maint / Mgmt
- −$281
- Net cashflow
- $171
Break-even live
UW: 25.0% down · 7.5% · 30yr · 1.5% tax · 5.0% vac · 8.0% maint · 8.0% mgmt
Financing live
Cash to close
- Down payment
- $36,250
- Closing costs
- $4,350
- Reserves months
- —
- Total cash needed
- —
Loan-product check · same deal, 3 products live
Conventional
25% down · 7.5% · 30yr
- Down + closing
- —
- Monthly P&I
- —
- Monthly cashflow
- —
- DSCR
- —
- Eligible?
- —
Personal DTI + credit; lowest rate.
DSCR
20% down · 8.5% · 30yr
- Down + closing
- —
- Monthly P&I
- —
- Monthly cashflow
- —
- DSCR
- —
- Eligible?
- —
No personal income docs; deal must DSCR.
Hard money
10% down · 12.0% · 12mo
- Down + closing
- —
- Monthly P&I
- —
- Monthly cashflow
- —
- DSCR
- —
- Eligible?
- —
Short-term bridge; refi at stabilization.
Rent comps 40 comps
| Address | Beds | Baths | Sqft | Rent | $/sqft | DOM | Units | Dist |
|---|---|---|---|---|---|---|---|---|
| 2212 Old Blue Spring Rd NW Unit B Huntsville, AL | 2.0 | 1.0 | 759 | $870 | $1.15 | 23d | 1 | 0.29mi |
| 2212 Old Blue Spring Rd NW Unit A Huntsville, AL | 2.0 | 1.0 | 970 | $970 | $1.00 | 23d | 1 | 0.29mi |
| 2416 Hanover Dr NW Huntsville, AL | 3.0 | 2.0 | 1300 | $1,395 | $1.07 | 43d | 1 | 0.61mi |
| 304 Wind Ave NW Huntsville, AL | 2.0 | 1.0 | 960 | $1,095 | $1.14 | 43d | 1 | 0.64mi |
| 2640 Blue Spring Rd NW Huntsville, AL | 1.0–3.0 | 1.0–2.0 | 944 | $1,149 | $1.22 | 43d | 3 | 0.66mi |
| 2708 Monticello Dr NW Huntsville, AL | 3.0 | 1.0 | 1025 | $1,350 | $1.32 | 43d | 1 | 0.71mi |
| 2708 Monticello Dr NW Huntsville, AL | 3.0 | 1.0 | 1025 | $1,300 | $1.27 | 23d | 1 | 0.71mi |
| 2032 Front St NE Huntsville, AL | 4.0 | 2.0 | 1304 | $1,400 | $1.07 | 43d | 1 | 0.75mi |
| 2711 Clayton Dr NW Huntsville, AL | 3.0 | 1.5 | 1030 | $1,400 | $1.36 | 43d | 1 | 0.82mi |
| 1904 Oglesby Dr NW Huntsville, AL | 3.0 | 2.0 | 1026 | $1,395 | $1.36 | 13d | 1 | 0.83mi |
| 2502 Hill St NW Huntsville, AL | 3.0 | 1.0 | 1288 | $1,200 | $0.93 | 43d | 1 | 0.84mi |
| 2601 Academy Dr NW Huntsville, AL | 2.0–4.0 | 1.0–2.0 | 971 | $1,262 | $1.30 | 43d | 1 | 0.86mi |
| 522 Lisa Ln NW Huntsville, AL | 4.0 | 3.0 | 1025 | $1,695 | $1.65 | 43d | 1 | 0.88mi |
| 2721 Clayton Dr NW Huntsville, AL | 3.0 | 1.0 | 1000 | $998 | $1.00 | 43d | 1 | 0.89mi |
| 415 Halsey Ave NE Huntsville, AL | 2.0 | 1.0–2.0 | 818 | $1,760 | $2.15 | 13d | 20 | 0.89mi |
| 621 Murray Rd NW Huntsville, AL | 3.0 | 1.5 | 1008 | $1,325 | $1.31 | 13d | 1 | 0.91mi |
| 2115 Lee High Dr NE Huntsville, AL | 3.0 | 1.0 | 870 | $1,245 | $1.43 | 13d | 1 | 0.93mi |
| 3058 Boswell Dr NW Huntsville, AL | 4.0 | 2.0 | 1450 | $1,398 | $0.96 | 43d | 1 | 0.94mi |
| 2728 Clayton Dr NW Unit B Huntsville, AL | 2.0 | 1.0 | 900 | $795 | $0.88 | 43d | 1 | 0.96mi |
| 2809 Academy Dr NW Huntsville, AL | 2.0 | 1.5 | 900 | $950 | $1.06 | 43d | 1 | 0.96mi |
| 3013 Kirkland Dr NW Huntsville, AL | 3.0 | 1.5 | 1324 | $1,295 | $0.98 | 43d | 1 | 0.97mi |
| 611 Ofallon Rd NW Huntsville, AL | 3.0 | 2.0 | 1350 | $3,000 | $2.22 | 23d | 1 | 0.98mi |
| 2401 Mount Vernon Rd NW Huntsville, AL | 3.0 | 1.0 | 950 | $1,045 | $1.10 | 43d | 1 | 0.99mi |
| 2706 Norton Ave NW Huntsville, AL | 3.0 | 2.0 | 1127 | $1,098 | $0.97 | 43d | 1 | 1.04mi |
| 202 Beirne Ave NE Huntsville, AL | 3.0 | 1.5 | 1145 | $1,450 | $1.27 | 43d | 1 | 1.05mi |
| 1715 Chester St NW Huntsville, AL | 3.0 | 1.0 | 950 | $1,250 | $1.32 | 43d | 1 | 1.10mi |
| 2219 Jonathan Dr NW Apt C Huntsville, AL | 2.0 | 1.5 | 850 | $850 | $1.00 | 43d | 1 | 1.11mi |
| 410 McCullough Ave NE Huntsville, AL | 3.0 | 1.0 | 1143 | $1,500 | $1.31 | 23d | 1 | 1.13mi |
| 218 Ward Ave NE Huntsville, AL | 2.0 | 2.0 | 932 | $1,450 | $1.56 | 13d | 1 | 1.14mi |
| 3410 Elizabeth St NW Unit 2 Huntsville, AL | 2.0 | 1.0 | 800 | $850 | $1.06 | 43d | 1 | 1.16mi |
| 3410 Elizabeth St NW Apt 7 Huntsville, AL | 2.0 | 1.0 | 800 | $799 | $1.00 | 43d | 1 | 1.16mi |
| 1713 Niblick Ave NW Huntsville, AL | 3.0 | 1.0 | 1000 | $1,195 | $1.20 | 23d | 1 | 1.16mi |
| 3205 Lewisburg Dr NW Huntsville, AL | 3.0 | 2.0 | 1408 | $1,600 | $1.14 | 23d | 1 | 1.20mi |
| 2803 Hester Ln NW Huntsville, AL | 3.0 | 1.5 | 1224 | $1,400 | $1.14 | 23d | 1 | 1.21mi |
| 401 Pratt Ave NE Huntsville, AL | 2.0 | 1.0–2.0 | 929 | $2,290 | $2.47 | 13d | 64 | 1.23mi |
| 1107 England St NE Unit A Huntsville, AL | 2.0 | 1.0 | 956 | $1,200 | $1.26 | 43d | 1 | 1.26mi |
| 1000 Hampton Fall Blvd Huntsville, AL | 1.0–3.0 | 1.0–2.0 | 1177 | $1,451 | $1.23 | 43d | 4 | 1.26mi |
| 1114 Oakwood Ave NE Unit A Huntsville, AL | 2.0 | 1.0 | 1000 | $995 | $0.99 | 13d | 1 | 1.27mi |
| 212 White St NE Huntsville, AL | 2.0 | 1.0 | 960 | $1,095 | $1.14 | 43d | 1 | 1.28mi |
| 402 Walker Ave NE Unit C Huntsville, AL | 2.0 | 1.0 | 960 | $1,000 | $1.04 | 43d | 1 | 1.29mi |
Listing history 16 events
-
2026-06-18days on market $145,000 Active 29 DOM
-
2026-06-17days on market $145,000 Active 28 DOM
-
2026-06-16days on market $145,000 Active 27 DOM
-
2026-06-15days on market $145,000 Active 26 DOM
-
2026-06-14days on market $145,000 Active 24 DOM
-
2026-06-10days on market $145,000 Active 21 DOM
-
2026-06-09days on market $145,000 Active 20 DOM
-
2026-06-08days on market $145,000 Active 19 DOM
-
2026-06-07days on market $145,000 Active 18 DOM
-
2026-06-03days on market $145,000 Active 14 DOM
-
2026-06-02days on market $145,000 Active 13 DOM
-
2026-06-01days on market $145,000 Active 12 DOM
-
2026-05-31days on market $145,000 Active 11 DOM
-
2026-05-30days on market $145,000 Active 10 DOM
-
2026-05-20$145,000 Active
-
2026-04-22soldstatus $90,000
ⓘ Source: listings_history table (triggers on properties + properties_extension) + one-shot
backfill from property_details.listing_events for pre-trigger history.
Tax reassessment forecast AL · Resets to sale price
- Current annual tax
- $796 · $66/mo
- Projected year-2 tax
- $796 · $66/mo
- Expected delta
- $0/yr ($0/mo · 0.0%)
ⓘ Screening estimate from a state-policy table — verify with the county assessor before closing.
Climate risk First Street
- Flood 4/10 Moderate FEMA zone X (shaded) · 22% chance over 30 yrs
- Wildfire 1/10 Low
- Heat 6/10 Major 7 d/yr ≥104°F today · 19 d/yr by 30 yrs out
- Wind 4/10 Moderate 19% chance of damaging wind over 30 yrs
- Air quality 2/10 Low 1 unhealthy d/yr today · 1 by 30 yrs out
Nearby sold comps map
Loading sold comps map…
Walkable amenities ~0.75 mi
Loading nearby amenities…
Taxation est. · year 1
- Rental income
- $16,078
- − Mortgage interest
- −$8,122
- − Property taxes
- −$796
- − Insurance
- −$725
- − Repairs & maintenance
- −$1,286
- − Management
- −$1,286
- − Depreciation
- −$4,218
- Taxable loss
- −$356
- Est. tax savings @ 24.0%
- +$85
- After-tax cash flow
- $2,141/yr
For passive investors: Depreciation is non-cash, so a rental often shows a tax loss while cash-flowing — sheltering income. Rental losses are passive: they offset passive income freely, and up to $25,000/yr can offset ordinary (W-2) income if you actively participate and your MAGI is under $100k (phasing out to $0 by $150k); unused losses carry forward. On sale, claimed depreciation is recaptured at up to 25%, and gains may owe capital-gains tax (a 1031 exchange can defer both). Figures are a year-1 estimate at your 24.0% rate — not tax advice; consult a CPA.
Schools (NCES district)
- District
- Huntsville City
- NCES district ID
- 0101800
- Math proficiency
- 21% ▼ -23.00%
- Reading proficiency
- 46% ▬ 0.00%
- Median HH income
- $48,264
- Composite
- 28.84/100
- National rank
- #6647
- State rank
- #48 of 129 in AL
Livability — Huntsville
- Score
- 82/100
- State rank
- #3
- US rank
- #1082
Category grades
Schools grade is shown separately in the Schools card above.
Census & demographics
- Census place
- Huntsville, AL
- County
- Madison County · 380,832 people
- City population
- 220,435
- Metro
- Huntsville, AL
- Population (ZIP)
- 31,008
- Household income
- $90,812
- Rent vs Own
- Severe rent burden
- 517.0
Population outlook (Madison County) Hauer SSP2
- Today (2025)
- 392,086 people
- By 2030
- 409,788 · +4.5%
- By 2040
- 440,557 · +12.4%
- By 2050
- 460,990 · +17.6%
- By 2075
- 502,872 · +28.3%
- By 2100
- 513,623 · +31.0%
Race, ethnicity, and origin ACS 2023
- Neighborhood character
- Majority White (64%)
- Race & ethnicity
- White 64% Black 27% Two or more races 5% Hispanic / Latino 3% Asian 2%
- Common ancestry
- Slovak 2% Italian 2% Serbian 2%
- Foreign-born
- 4% · Canada, Vietnam, China
- Languages at home
- 95% English-only · Spanish 3% Vietnamese 1%
Political lean MEDSL · Madison
- 2024 margin
- Lean R (+9.0) · D 44.7% · R 53.7% · Other 1.6%
- 2008→2024 swing
- +6.0pp toward D · 2008: -14.9pp · 2024: -9.0pp
- All cycles
- 2024: R+9.0 2020: R+8.0 2016: R+16.8 2012: R+18.7 2008: R+14.9
Not yet ingested
- Civics
- —
Market trends
- HPI YoY
- ▼ -7.13%
- Current HPI
- 332.9423
- Rent YoY
- ▲ 6.81%
- Metro
- Huntsville, AL
- State GDP YoY
- ▲ 2.94%
- F500 in state
- 4
Industry mix (Fortune 500 HQ in AL)
| Industry | F500 HQs | Revenue |
|---|---|---|
| Financial Services | 1 | $8B |
|
||
| Healthcare | 1 | $5B |
|
||
Price history
+61.1% since first listed2 events — show timeline
- 2026-05-20 Listed $145,000 VMLS
- 2026-04-22 Sold (Public Records) $90,000 Public Records
Property tax history
+5.4%/yrLatest (2024): $796 · +6.4% YoY. Source: county tax records.
Cash-flow waterfall
monthlySold comps — $/sqft
last 12 mo · ≤1 miLoading sold comps…