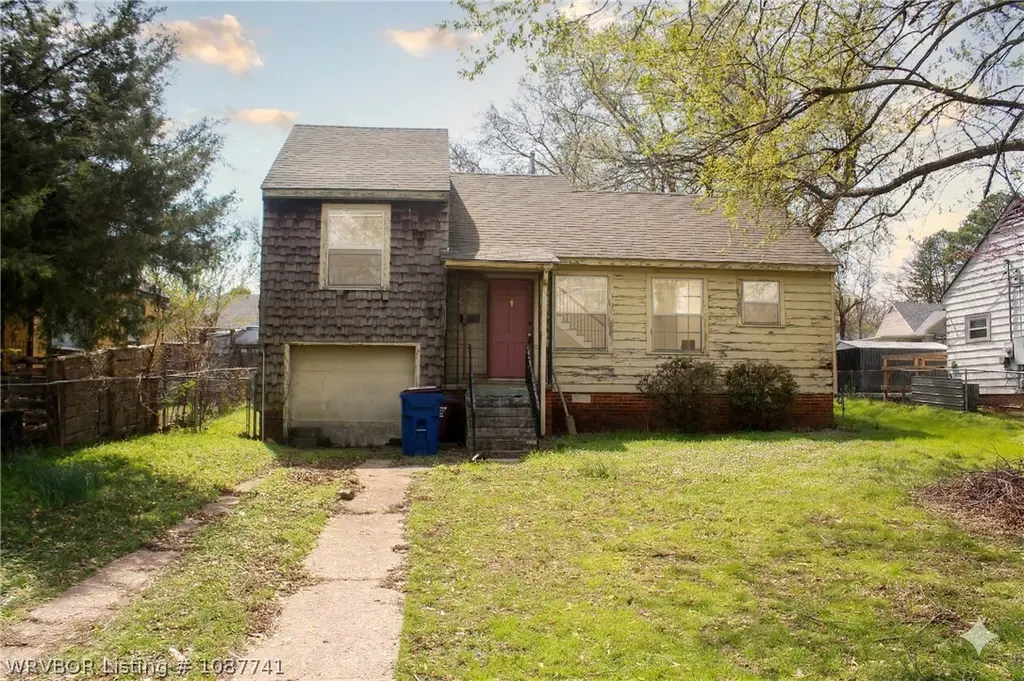
4006 Chaffee Dr · Fort Smith, AR
Flood risk 1/10 · Minimal
- FEMA flood zone
- X (unshaded)
- Chance of flooding over 30 yrs
- 0.0%
- Est. flood insurance / yr
- $507 – $1,088
Fire risk 3/10 · Minor
- Est. fire insurance / yr
- $1,499 – $2,785
Heat risk 7/10 · Major
- Hot days now (above 112°F)
- 7 days/yr
- Hot days in 30 yrs
- 20 days/yr
Wind risk 2/10 · Minimal
- Chance of severe wind over 30 yrs
- 3.0%
Air-quality risk 2/10 · Minimal
- Unhealthy air days now
- 0 days/yr
- Unhealthy air days in 30 yrs
- 1 days/yr
Risk factors via First Street. Map © Google.
Why this score? — see what drove the B+ grade
The composite is a weighted blend of 9 inputs, each scored 0–100. Each bar is that input's sub-score; the figure is the points it added to the 100-point composite (weight × sub-score).
- Cash flow +29.8/30.0
- ARV discount +15.0/15.0
- DSCR +10.0/10.0
- 1% rule +8.4/10.0
- Rent growth +3.6/5.0
- Livability +3.2/5.0
- Schools +3.1/10.0
- Condition / age +2.5/5.0
- Appreciation +0.0/10.0
$65,000
🖨 Deal sheet 📄 Offer letter ✓ Due diligence
Listing remarks
Great Investment Opportunity! This 2-bd, 1-bath, including a versatile bonus room perfect for a third bedroom or 2nd living area. New Roof installed in 2020. One-car garage. This home needs updates and is being sold AS-IS, perfect!
Key facts
- Versatile bonus room
- New roof
- 7,995 sq ft lot
Tags
Property features AI
Finance
- Other: Property listed as residential single-family residence
Exterior
- Parking: Attached garage; 1 covered space; Gravel parking areas
- Utilities: Public water; Public sewer; Electricity available; Natural gas available
- Home design: Single-family house; Multi/split levels; Facing information not provided
- Construction: Vinyl siding; Shingle roof; Slab foundation; Built year not provided
- Exterior features: Deck; Partial backyard fencing; Paved road access
Interior
- Kitchen: Range; Refrigerator; Disposal
- Flooring: Carpet; Wood
- Bathrooms: 1 full bathroom
- Heating & cooling: Central heating (natural gas); Central air conditioning
- Interior features: Disposal; Gas water heater; Range; Refrigerator; Wood-burning fireplace; 12 total rooms
- Laundry & utility: Washer hookup (no washer included)
Neighborhood map
What this means for you Summary
Snapshot
- This is a 2-bed/1.0-bath single-family listed at $65k.
Deal economics
- At list price, monthly cash flow is $240 ($3k/yr) — positive.
- The deal already cash-flows at list — no discount required.
- Meets the 1% rule at list price ($872 rent vs $65k).
- Recommended offer: $63k (3.0% below list) — sets the bar for market timing.
- Cap rate 10.7% vs local median 4.3% in Fort Smith — top-decile yield for the area; either an underpriced asset or a hidden risk that comps aren't pricing in. Stress-test before assuming the spread holds.
Location & tenants
- Location reads 65/100 on livability (#151 in AR) — a middle-class / working-renter tenant base. Strengths: cost of living A+, housing A+, health & safety A+; Watch: crime F, amenities F, commute F.
- Fort Smith School District (urban): math 35% / reading 39% proficiency, ranked #106 of 238 in AR (top 44%) — families likely to look elsewhere, expect single-tenant / working-renter base with shorter leases; 64% free/reduced lunch — lower-income household profile, screen leases tightly.
- Zoned schools: Sunnymede Elementary School (math 23% / reading 27%, grade F, #345 of 454 statewide, top 76%, 468 students, 93% FRL); Dora Kimmons Jr. High School (math 22% / reading 32%, grade F, #156 of 201 statewide, top 78%, 841 students, 91% FRL); Northside High School (math 12% / reading 27%, grade F, #239 of 292 statewide, top 85%, 2,433 students, 74% FRL) — zoned schools average 86% FRL vs 64% district-wide (22 pts higher); higher-poverty schools than district average — tighter screening recommended.
- Zoned-school proficiency averages 24% at this address vs 37% district-wide (-13 pts) — the specific schools serving this property underperform the Fort Smith School District average; the district grade overstates school quality for this exact location.
- Market conditions: Rents rising fast (+4.4%/yr); 174 active listings in the ZIP; 16 comparable units currently listed for rent nearby; rentals at typical pace (median 21d on market — plan ~3-4 weeks tenant-placement turnaround); lower-income renter base — watch delinquency; 388 units permitted in Sebastian County in 2024 (16 in 5+ unit buildings).
Forward outlook
- Local home prices are declining (-3.0%/yr); year-one equity from $449 of loan paydown is wiped out by about $2k of value loss. Plan a longer hold.
- Sebastian County population projected at +7% by 2050 — modest demand growth; plan on rents tracking national, not racing it.
- At projected returns (-3.0% appreciation + 4.4% rent growth), your $18k cash investment doubles in ~7 years — after that, you're playing with house money.
Negotiation context
- It's been on market 32 days — a 3% lower offer ($63k) is reasonable based on typical stale-listing flexibility.
- 2 sale attempts with the ask held roughly flat each time — persistent listings suggest the price (not the market) is what's stuck; bring a comps-based counter.
Risks & watch-outs
- Watch-outs: built in 1955 — expect roof / HVAC / electrical / plumbing capex.
- Climate carrying-cost: extreme-heat days projected 7→20/yr by 2055 (HVAC capex compounding) — expect insurance premiums to compound above CPI over the hold.
Questions for the listing agent
- It's been on market 32 days. Have you received any prior offers? Is the seller open to a 3% concession, seller financing, or rate buy-down credit?
- Built in 1955 — when were the roof, HVAC, electrical panel, plumbing, and water heater last replaced?
- Is there a deadline driving the sale (1031 exchange, divorce, estate, relocation)? That informs how much negotiation room exists.
- Schools are D-rated, which usually means shorter tenancies and higher turnover. Who's the typical renter profile here, and what's been the actual vacancy rate?
- Crime grade is F in this area — have there been break-ins, vandalism, or insurance claims at this property in the last 3 years? What carrier currently insures it and at what premium?
- What's the average days-on-market for RENTAL listings here right now (not sales)? A rising rental-DOM trend means longer vacancies and softer asking-rent achievability than the comps imply.
- What's the recent tenant-quality profile in this submarket — average credit score on applications, eviction rate, late-payment / NSF rate, and stable-employment percentage? A property-management company in the area should have these aggregated.
- How much new for-sale + rental construction is in the pipeline within 1–3 miles? Heavy new supply typically softens prices + rents 12–24 months out; constrained supply supports both.
Investment metrics
- 1% rule
- 1.34% ✓
- Cap rate
- 10.72%
- Cash-on-cash
- 15.80%
- DSCR
- 1.70
- GRM
- 6.2
CMA / ARV
- ARV (on-the-fly)
- $110,747
- Comps found
- 12
Show comp detail 12 sales within ~0.75 mi
| Address | Dist | Beds/Ba | Sqft | Sold | Price | $/sf | Match |
|---|---|---|---|---|---|---|---|
| 3624 Chaffee Dr | 0.21mi | 2/1.0 | 1,182 (-3%) | 4mo | $62,000 | $52 | 82 |
| 3810 Macarthur Dr | 0.12mi | 3/1.0 (+1) | 1,127 (-7%) | 2mo | $150,000 | $133 | 76 |
| 3613 Chaffee Dr | 0.25mi | 3/2.0 (+1) | 1,292 (+6%) | 3mo | $110,000 | $85 | 66 |
| 3709 Marshall Dr | 0.26mi | 3/2.0 (+1) | 1,158 (-5%) | 6mo | $156,500 | $135 | 66 |
| 1205 N 40th St | 0.51mi | 2/1.0 | 1,307 (+7%) | 7mo | $79,000 | $60 | 58 |
| 3300 N O St | 0.49mi | 3/1.0 (+1) | 1,312 (+8%) | 2mo | $35,000 | $27 | 57 |
| 1201 N 39th St | 0.53mi | 3/1.0 (+1) | 1,152 (-5%) | 6mo | $105,000 | $91 | 56 |
| 1301 N 46th St | 0.58mi | 3/2.0 (+1) | 1,280 (+5%) | 1mo | $171,500 | $134 | 55 |
| 1319 N 38th St | 0.46mi | 2/1.0 | 1,069 (-12%) | 7mo | $85,000 | $80 | 52 |
| 2312 N 35th St | 0.54mi | 3/1.5 (+1) | 1,107 (-9%) | 2mo | $72,600 | $66 | 51 |
| 1015 N 41st St | 0.62mi | 3/2.0 (+1) | 1,300 (+7%) | 2mo | $167,900 | $129 | 49 |
| 1918 N 29th St | 0.71mi | 3/1.5 (+1) | 1,134 (-7%) | 4mo | $119,000 | $105 | 45 |
Match score weights: distance 35% · size 25% · config 20% · recency 20%. Top-matched comps best support the ARV.
Projected returns pro-forma
-3.0% appreciation · 4.37% rent growth · sell at horizon
- IRR
- 8.2%
- Equity multiple
- 1.33×
- Total profit
- $5,959
- Equity at exit
- $9,692
- IRR
- 18.6%
- Equity multiple
- 2.65×
- Total profit
- $30,034
- Equity at exit
- $5,620
Cash invested: $18,200 (down + closing). Projections, not guarantees.
Landlord ↔ Tenant lean methodology
- Overall (STATE)
- 92 Strongly Landlord-Friendly
- State Arkansas
- 92 Strongly Landlord-Friendly · R+14
- County
- — inherits STATE
- City
- — inherits STATE
ZIP-level market 72901
- Rents YoY
- 4.4%
- Active inventory
- 174
- Price-to-rent
- 6.2×
Monthly cashflow live
- Estimated rent
- $872 high interval (Pro) →
- Mortgage (P&I)
- −$341
- Tax est. 1.5%
- −$81 /mo · $975/yr
- Insurance
- −$27
- HOA
- −$0
- Vacancy / Maint / Mgmt
- −$183
- Net cashflow
- $240
Break-even live
UW: 25.0% down · 7.5% · 30yr · 1.5% tax · 5.0% vac · 8.0% maint · 8.0% mgmt
Financing live
Cash to close
- Down payment
- $16,250
- Closing costs
- $1,950
- Reserves months
- —
- Total cash needed
- —
Loan-product check · same deal, 3 products live
Conventional
25% down · 7.5% · 30yr
- Down + closing
- —
- Monthly P&I
- —
- Monthly cashflow
- —
- DSCR
- —
- Eligible?
- —
Personal DTI + credit; lowest rate.
DSCR
20% down · 8.5% · 30yr
- Down + closing
- —
- Monthly P&I
- —
- Monthly cashflow
- —
- DSCR
- —
- Eligible?
- —
No personal income docs; deal must DSCR.
Hard money
10% down · 12.0% · 12mo
- Down + closing
- —
- Monthly P&I
- —
- Monthly cashflow
- —
- DSCR
- —
- Eligible?
- —
Short-term bridge; refi at stabilization.
Rent comps 16 comps
| Address | Beds | Baths | Sqft | Rent | $/sqft | DOM | Units | Dist |
|---|---|---|---|---|---|---|---|---|
| 4300 Wynnewood Dr Unit 2 Fort Smith, AR | 2.0 | 2.0 | 1200 | $1,100 | $0.92 | 21d | 1 | 0.43mi |
| 1453 N 35th St Fort Smith, AR | 2.0 | 1.0 | 913 | $900 | $0.99 | 21d | 1 | 0.46mi |
| 1224 N Albert Pike Ave Fort Smith, AR | 1.0–2.0 | 1.0 | 735 | $695 | $0.95 | 13d | 6 | 0.46mi |
| 811 N 41st St Fort Smith, AR | 2.0 | 1.0 | 1306 | $900 | $0.69 | 13d | 1 | 0.74mi |
| 1117 N 32nd St Fort Smith, AR | 2.0 | 1.0 | 744 | $850 | $1.14 | 13d | 1 | 0.81mi |
| 813 N 48th St Fort Smith, AR | 2.0 | 1.0 | 1170 | $800 | $0.68 | 21d | 1 | 0.88mi |
| 2409 N 30th St Unit 1 Fort Smith, AR | 2.0 | 2.5 | 1258 | $950 | $0.76 | 21d | 1 | 0.89mi |
| 4515 Kinkead Ave Apt 7 Fort Smith, AR | 1.0 | 1.0 | 750 | $650 | $0.87 | 21d | 1 | 0.95mi |
| 3600 Kinkead Ave Fort Smith, AR | 1.0–2.0 | 1.0 | 797 | $1,490 | $1.87 | 13d | 15 | 1.05mi |
| 2905 Alabama Ave Fort Smith, AR | 1.0 | 1.0 | 711 | $795 | $1.12 | 3d | 1 | 1.06mi |
| 3605 Barry Ave Fort Smith, AR | 2.0 | 1.0 | 562 | $845 | $1.50 | 21d | 3 | 1.23mi |
| 501 N May Ave Fort Smith, AR | 2.0 | 1.0 | 1022 | $825 | $0.81 | 21d | 1 | 1.35mi |
| 5801 Kinkead Ave Fort Smith, AR | 1.0–3.0 | 1.0–2.0 | 805 | $712 | $0.89 | 13d | 7 | 1.45mi |
| 3014 Presley St Unit FB44 Fort Smith, AR | 2.0 | 1.5 | 1040 | $925 | $0.89 | 21d | 1 | 1.47mi |
| 3014 Presley St Fort Smith, AR | 1.0–2.0 | 1.0–1.5 | 782 | $925 | $1.18 | 13d | 4 | 1.47mi |
| 4911 Free Ferry Rd Unit Vi Fort Smith, AR | 2.0 | 2.0 | 1232 | $1,150 | $0.93 | 21d | 1 | 1.50mi |
Listing history 4 events
-
2026-05-10status Pending
-
2026-04-09status Active
-
2026-03-28status Pending
-
2026-03-17$65,000 Active
ⓘ Source: listings_history table (triggers on properties + properties_extension) + one-shot
backfill from property_details.listing_events for pre-trigger history.
Climate risk First Street
- Flood 1/10 Low FEMA zone X (unshaded) · 0% chance over 30 yrs
- Wildfire 3/10 Moderate
- Heat 7/10 Severe 7 d/yr ≥112°F today · 20 d/yr by 30 yrs out
- Wind 2/10 Low 3% chance of damaging wind over 30 yrs
- Air quality 2/10 Low 0 unhealthy d/yr today · 1 by 30 yrs out
Nearby sold comps map
Loading sold comps map…
Walkable amenities ~0.75 mi
Loading nearby amenities…
Taxation est. · year 1
- Rental income
- $10,463
- − Mortgage interest
- −$3,641
- − Property taxes
- −$975
- − Insurance
- −$325
- − Repairs & maintenance
- −$837
- − Management
- −$837
- − Depreciation
- −$1,891
- Taxable income
- $1,957
- Est. tax owed @ 24.0%
- −$470
- After-tax cash flow
- $2,406/yr
For passive investors: Depreciation is non-cash, so a rental often shows a tax loss while cash-flowing — sheltering income. Rental losses are passive: they offset passive income freely, and up to $25,000/yr can offset ordinary (W-2) income if you actively participate and your MAGI is under $100k (phasing out to $0 by $150k); unused losses carry forward. On sale, claimed depreciation is recaptured at up to 25%, and gains may owe capital-gains tax (a 1031 exchange can defer both). Figures are a year-1 estimate at your 24.0% rate — not tax advice; consult a CPA.
Schools (NCES district)
- District
- Fort Smith School District
- NCES district ID
- 0506330
- Math proficiency
- 35% ▼ -11.00%
- Reading proficiency
- 39% ▼ -7.00%
- Median HH income
- $36,066
- Composite
- 30.66/100
- National rank
- #6183
- State rank
- #106 of 238 in AR
Livability — Fort Smith
- Score
- 65/100
- State rank
- #151
- US rank
- #13185
Category grades
Schools grade is shown separately in the Schools card above.
Census & demographics
- Census place
- Fort Smith, AR
- County
- Sebastian County · 99,312 people
- City population
- 94,356
- Metro
- Fort Smith, AR-OK
- Population (ZIP)
- 19,819
- Household income
- $42,851
- Rent vs Own
- Severe rent burden
- 1117.0
Population outlook (Sebastian County) Hauer SSP2
- Today (2025)
- 133,992 people
- By 2030
- 136,620 · +2.0%
- By 2040
- 140,832 · +5.1%
- By 2050
- 143,301 · +6.9%
- By 2075
- 147,964 · +10.4%
- By 2100
- 145,848 · +8.8%
Race, ethnicity, and origin ACS 2023
- Neighborhood character
- Diverse neighborhood (Simpson 0.60)
- Race & ethnicity
- White 60% Hispanic / Latino 17% Two or more races 12% Black 10% Asian 2%
- Hispanic origin (detail)
- Mexican 11% Puerto Rican 1%
- Common ancestry
- Slovak 2% Lithuanian 2% Italian 1%
- Foreign-born
- 9% · Canada, Vietnam, Guatemala
- Languages at home
- 83% English-only · Spanish 14% Other Asian/Pacific 1% Vietnamese 1%
Political lean MEDSL · Sebastian
- 2024 margin
- Solid R (+37.5) · D 30.0% · R 67.6% · Other 2.4%
- 2008→2024 swing
- -2.9pp toward R · 2008: -34.6pp · 2024: -37.5pp
- All cycles
- 2024: R+37.5 2020: R+35.5 2016: R+38.1 2012: R+37.1 2008: R+34.6
Not yet ingested
- Civics
- —
Market trends
- HPI YoY
- ▼ -173.82%
- Current HPI
- 172.3777
- Rent YoY
- ▲ 4.37%
- Metro
- Fort Smith, AR-OK
- State GDP YoY
- ▲ 3.80%
- F500 in state
- 10
Industry mix (Fortune 500 HQ in AR)
| Industry | F500 HQs | Revenue |
|---|---|---|
| Retail | 1 | $681B |
|
||
| Food / Agriculture | 1 | $53B |
|
||
| Retail / Energy | 1 | $22B |
|
||
| Transportation / Logistics | 1 | $12B |
|
||
| Energy | 1 | $4B |
|
||
Price history
4 events — show timeline
- 2026-05-10 Pending — WRVBOR
- 2026-04-09 Relisted — WRVBOR
- 2026-03-28 Pending — WRVBOR
- 2026-03-17 Listed $65,000 WRVBOR
Property tax history
-31.7%/yrLatest (2023): $10 · -75.4% YoY. Source: county tax records.
Cash-flow waterfall
monthlySold comps — $/sqft
last 12 mo · ≤1 miLoading sold comps…