 🏗️ New Construction
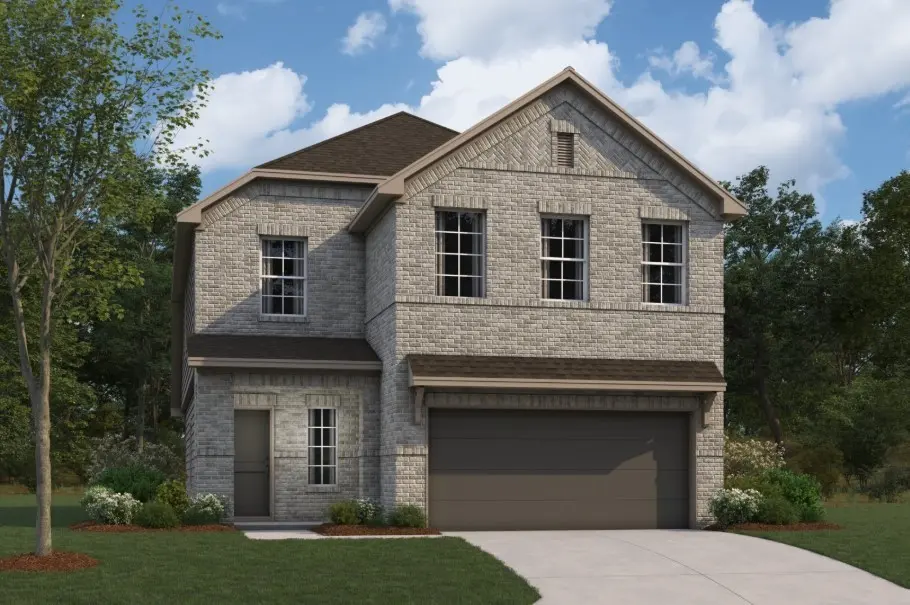
10329 Navarro Path · Conroe, TX
Flood risk No data
- FEMA flood zone
- —
- Chance of flooding over 30 yrs
- —
- Est. flood insurance / yr
- —
Fire risk No data
- Est. fire insurance / yr
- —
Heat risk No data
- Hot days now (above threshold)
- —
- Hot days in 30 yrs
- —
Wind risk No data
- Chance of severe wind over 30 yrs
- —
Air-quality risk No data
- Unhealthy air days now
- —
- Unhealthy air days in 30 yrs
- —
Risk factors via First Street. Map © Google.
Why this score? — see what drove the D- grade
The composite is a weighted blend of 9 inputs, each scored 0–100. Each bar is that input's sub-score; the figure is the points it added to the 100-point composite (weight × sub-score).
- Cash flow +11.6/30.0
- ARV discount +7.5/15.0
- Schools +5.4/10.0
- Livability +3.7/5.0
- DSCR +3.4/10.0
- Rent growth +2.6/5.0
- Condition / age +2.5/5.0
- 1% rule +2.4/10.0
- Appreciation +0.0/10.0
$317,990
🖨 Deal sheet 📄 Offer letter ✓ Due diligence
Listing remarks
UNDER CONSTRUCTION! READY IN JULY! This spacious home offers 4 bedrooms, 2.5 bathrooms, and 2,107 square feet designed for comfortable everyday living and effortless entertaining. A welcoming covered porch opens to a spacious foyer that flows into the open kitchen, dining, and family room. The family room features a sloped ceiling and direct access to the covered patio, creating seamless indoor-outdoor living. The private owner’s suite is tucked away at the rear of the home and includes a sloped ceiling, a large walk-in closet, and a well-appointed bathroom. Upstairs, a bright game room provides the perfect space for movie nights or playtime, while three generously sized secondary bed
Key facts
- 5,125 sq ft lot
- 2 garage spots
- Built 2026
Property features AI
Finance
- Other: Located on a cul-de-sac within a subdivision
- HOA & community: Homeowners association managed by King Property Management; Annual association fee
Exterior
- Parking: Attached garage with 2 spaces
- Security: Owned security system
- Utilities: Public sewer
- Home design: Residential property; New construction (under construction); Faces west; Slab foundation; 2,107 total living area (per listing)
- Construction: Built in 2026; Brick construction; Composition roof
- Exterior features: Covered patio; Patio and deck; Backyard fence
Interior
- Kitchen: Dishwasher; Garbage disposal; Gas oven; Gas range; Microwave
- Bedrooms: Primary bedroom on first floor (approx. 15 x 12); Second-floor bedroom (approx. 14 x 11); Second-floor bedroom (approx. 14 x 10); Second-floor bedroom (approx. 12 x 12)
- Flooring: Brick flooring; Vinyl flooring
- Bathrooms: 2 full bathrooms; 1 half bathroom
- Heating & cooling: Central heating (gas); Central electric air conditioning; Programmable thermostat
- Interior features: Double vanity in primary bath; Kitchen island; Kitchen/family room combo; Primary bedroom with attached bath; Pantry; Tub with shower; Ceiling fans; Kitchen/dining combo; Programmable thermostat
- Laundry & utility: Washer hookup; Electric dryer hookup
Neighborhood map
What this means for you Summary
Snapshot
- This is a 4-bed/2.5-bath land listed at $318k.
Deal economics
- At list price, monthly cash flow is $-100 ($-1k/yr) — negative.
- To cash-flow at today's rent, offer at most $300k (5.5% below list).
- To meet the 1% rule (rent ≥ 1% of price), the offer needs to be $235k (26.1% below list).
- Recommended offer: $235k (26.1% below list) — sets the bar for 1% rule.
- Cap rate 5.9% vs local median 3.1% in Conroe — top-decile yield for the area; either an underpriced asset or a hidden risk that comps aren't pricing in. Stress-test before assuming the spread holds.
Location & tenants
- Location reads 74/100 on livability (#169 in TX, #4,447 nationally) — a middle-class / working-renter tenant base. Strengths: cost of living A+, housing A+, amenities B; Watch: commute F, health & safety F.
- Montgomery ISD (rural): math 63% / reading 57% proficiency, ranked #49 of 826 in TX (top 6%) — acceptable for families but not a draw, mixed tenant base, ~2y average lease.
- Zoned schools: Lone Star El (math 57% / reading 61%, grade B-, #455 of 4,322 statewide, top 11%, 766 students, 16% FRL); Lake Creek H S (math 53% / reading 68%, grade C+, #268 of 1,632 statewide, top 17%, 1,649 students, 23% FRL) — zoned schools at 19% FRL track the district average.
- Market conditions: Rents flat; 2283 active listings in the ZIP; high-income renter base; 13,259 units permitted in Montgomery County in 2024 (1,402 in 5+ unit buildings).
Forward outlook
- Local home prices are declining (-3.0%/yr); year-one equity from $2k of loan paydown is wiped out by about $10k of value loss. Plan a longer hold.
- Montgomery County population projected at +65% by 2050 — long-run rental-demand tailwind backs the buy-and-hold thesis.
Negotiation context
- It's been on market 30 days — a 2% lower offer ($313k) is reasonable based on typical stale-listing flexibility.
Questions for the listing agent
- What do current leases actually rent for vs. the listed asking? Can we see a recent rent roll and the last 12 months of T-12 income?
- What does the HOA fee cover, when was the last increase, and are there any pending special assessments or reserve-fund shortfalls?
- Is there a deadline driving the sale (1031 exchange, divorce, estate, relocation)? That informs how much negotiation room exists.
- Schools are D-rated, which usually means shorter tenancies and higher turnover. Who's the typical renter profile here, and what's been the actual vacancy rate?
- The area grade is low — what's the realistic commute time and amenity access for the typical tenant pool here? Any planned neighborhood developments (good or bad) we should know about?
- What's the average days-on-market for RENTAL listings here right now (not sales)? A rising rental-DOM trend means longer vacancies and softer asking-rent achievability than the comps imply.
- What's the recent tenant-quality profile in this submarket — average credit score on applications, eviction rate, late-payment / NSF rate, and stable-employment percentage? A property-management company in the area should have these aggregated.
- How much new for-sale + rental construction is in the pipeline within 1–3 miles? Heavy new supply typically softens prices + rents 12–24 months out; constrained supply supports both.
Investment metrics
- 1% rule
- 0.74% ✗
- Cap rate
- 5.92%
- Cash-on-cash
- -1.35%
- DSCR
- 0.94
- GRM
- 11.3
CMA / ARV
No comps found within radius.
Projected returns pro-forma
-3.0% appreciation · 0.4% rent growth · sell at horizon
- IRR
- -21.2%
- Equity multiple
- 0.28×
- Total profit
- $-63,992
- Equity at exit
- $47,413
- IRR
- -21.2%
- Equity multiple
- 0.01×
- Total profit
- $-87,716
- Equity at exit
- $27,494
Cash invested: $89,037 (down + closing). Projections, not guarantees.
Landlord ↔ Tenant lean methodology
- Overall (STATE)
- 87 Strongly Landlord-Friendly
- State Texas
- 87 Strongly Landlord-Friendly · R+5
- County
- — inherits STATE
- City
- — inherits STATE
ZIP-level market 77316
- Home prices YoY
- -10.7%
- Rents YoY
- 0.4%
- Active inventory
- 2283
- Price-to-rent
- 11.3×
Monthly cashflow live
- Estimated rent
- $2,351 medium interval (Pro) →
- Mortgage (P&I)
- −$1,668
- Tax from tax record
- −$97 /mo · $1,163/yr
- Insurance
- −$132
- HOA
- −$60
- Vacancy / Maint / Mgmt
- −$494
- Net cashflow
- $-100
Break-even live
UW: 25.0% down · 7.5% · 30yr · 1.5% tax · 5.0% vac · 8.0% maint · 8.0% mgmt
Financing live
Cash to close
- Down payment
- $79,498
- Closing costs
- $9,540
- Reserves months
- —
- Total cash needed
- —
Loan-product check · same deal, 3 products live
Conventional
25% down · 7.5% · 30yr
- Down + closing
- —
- Monthly P&I
- —
- Monthly cashflow
- —
- DSCR
- —
- Eligible?
- —
Personal DTI + credit; lowest rate.
DSCR
20% down · 8.5% · 30yr
- Down + closing
- —
- Monthly P&I
- —
- Monthly cashflow
- —
- DSCR
- —
- Eligible?
- —
No personal income docs; deal must DSCR.
Hard money
10% down · 12.0% · 12mo
- Down + closing
- —
- Monthly P&I
- —
- Monthly cashflow
- —
- DSCR
- —
- Eligible?
- —
Short-term bridge; refi at stabilization.
HOA detail
- Monthly dues
- $60 · $720/yr
Listing history 15 events
-
2026-06-18days on market $317,990 Active 30 DOM
-
2026-06-17days on market $317,990 Active 29 DOM
-
2026-06-16days on market $317,990 Active 28 DOM
-
2026-06-15days on market $317,990 Active 27 DOM
-
2026-06-13days on market $317,990 Active 25 DOM
-
2026-06-13days on market $317,990 Active 24 DOM
-
2026-06-09days on market $317,990 Active 21 DOM
-
2026-06-08days on market $317,990 Active 20 DOM
-
2026-06-07days on market $317,990 Active 19 DOM
-
2026-06-04days on market $317,990 Active 16 DOM
-
2026-06-03days on market $317,990 Active 15 DOM
-
2026-06-02days on market $317,990 Active 14 DOM
-
2026-06-01days on market $317,990 Active 13 DOM
-
2026-05-31days on market $317,990 Active 12 DOM
-
2026-05-19$317,990 Active
ⓘ Source: listings_history table (triggers on properties + properties_extension) + one-shot
backfill from property_details.listing_events for pre-trigger history.
Tax reassessment forecast TX · Resets to sale price
- Current annual tax
- $1,163 · $97/mo
- Projected year-2 tax
- $5,819 · $485/mo
- Expected delta
- +$4,656/yr (+$388/mo · 400.2%)
ⓘ Screening estimate from a state-policy table — verify with the county assessor before closing.
Nearby sold comps map
Loading sold comps map…
Walkable amenities ~0.75 mi
Loading nearby amenities…
Taxation est. · year 1
- Rental income
- $28,211
- − Mortgage interest
- −$17,812
- − Property taxes
- −$1,163
- − Insurance
- −$1,590
- − Repairs & maintenance
- −$2,257
- − Management
- −$2,257
- − HOA
- −$720
- − Depreciation
- −$9,251
- Taxable loss
- −$6,839
- Est. tax savings @ 24.0%
- +$1,641
- After-tax cash flow
- $444/yr
For passive investors: Depreciation is non-cash, so a rental often shows a tax loss while cash-flowing — sheltering income. Rental losses are passive: they offset passive income freely, and up to $25,000/yr can offset ordinary (W-2) income if you actively participate and your MAGI is under $100k (phasing out to $0 by $150k); unused losses carry forward. On sale, claimed depreciation is recaptured at up to 25%, and gains may owe capital-gains tax (a 1031 exchange can defer both). Figures are a year-1 estimate at your 24.0% rate — not tax advice; consult a CPA.
Schools (NCES district)
- District
- Montgomery ISD
- NCES district ID
- 4831260
- Math proficiency
- 63% ▼ -3.00%
- Reading proficiency
- 57% ▼ -3.00%
- Median HH income
- $75,596
- Composite
- 53.55/100
- National rank
- #1445
- State rank
- #49 of 826 in TX
Livability — Conroe
- Score
- 74/100
- State rank
- #169
- US rank
- #4447
Category grades
Schools grade is shown separately in the Schools card above.
Census & demographics
- County
- Montgomery County · 663,713 people
- City population
- 205,417
- Metro
- Houston-The Woodlands-Sugar Land, TX
- Population (ZIP)
- 34,694
- Household income
- $124,055
- Rent vs Own
- Severe rent burden
- 273.0
Population outlook (Montgomery County) Hauer SSP2
- Today (2025)
- 713,896 people
- By 2030
- 805,263 · +12.8%
- By 2040
- 992,708 · +39.1%
- By 2050
- 1,179,590 · +65.2%
- By 2075
- 1,628,084 · +128.1%
- By 2100
- 1,937,880 · +171.5%
Race, ethnicity, and origin ACS 2023
- Neighborhood character
- Predominantly White (80%)
- Race & ethnicity
- White 80% Hispanic / Latino 14% Two or more races 11% Black 1% Asian 1%
- Hispanic origin (detail)
- Mexican 9%
- Common ancestry
- Lithuanian 6% Slovak 3% Romanian 3%
- Foreign-born
- 6% · Canada
- Languages at home
- 90% English-only · Spanish 8%
Political lean MEDSL · Montgomery
- 2024 margin
- Solid R (+45.5) · D 26.8% · R 72.3%
- 2008→2024 swing
- +7.2pp toward D · 2008: -52.7pp · 2024: -45.5pp
- All cycles
- 2024: R+45.5 2020: R+43.8 2016: R+51.4 2012: R+60.7 2008: R+52.7
Not yet ingested
- Civics
- —
Market trends
- HPI YoY
- ▼ -31.44%
- Current HPI
- 262.6973
- Rent YoY
- ▲ 0.40%
- Metro
- Houston-The Woodlands-Sugar Land, TX
- State GDP YoY
- ▲ 3.95%
- F500 in state
- 110
Industry mix (Fortune 500 HQ in TX)
| Industry | F500 HQs | Revenue |
|---|---|---|
| Energy | 16 | $1,198B |
|
||
| Technology | 5 | $198B |
|
||
| Engineering / Construction | 4 | $72B |
|
||
| Energy Services | 3 | $60B |
|
||
| Utilities | 3 | $41B |
|
||
| Healthcare | 2 | $330B |
|
||
Price history
1 event — show timeline
- 2026-05-19 Listed $317,990 HARMLS
Property tax history
-0.2%/yrLatest (2025): $1,163 · -0.2% YoY. Source: county tax records.
Cash-flow waterfall
monthlySold comps — $/sqft
last 12 mo · ≤1 miLoading sold comps…