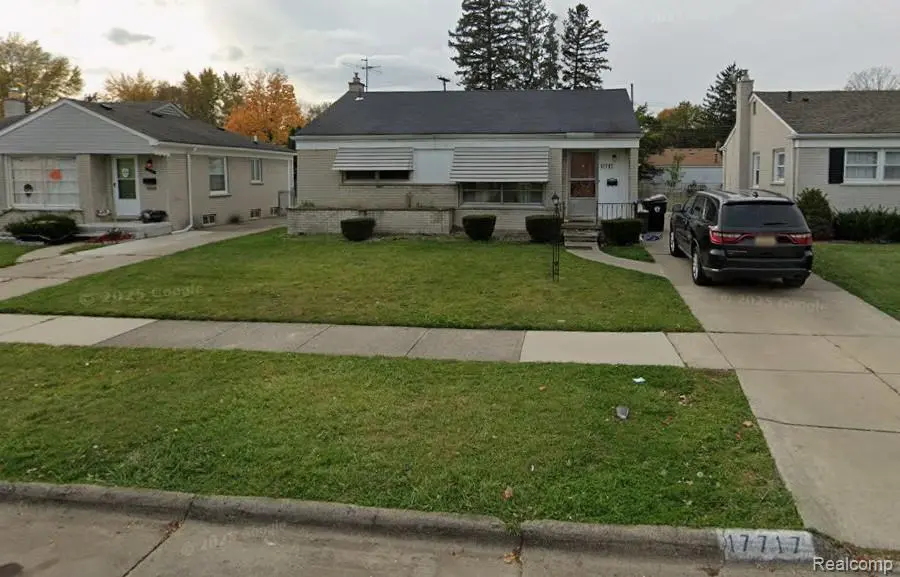
17717 Gaylord · Livonia, MI
Flood risk No data
- FEMA flood zone
- —
- Chance of flooding over 30 yrs
- —
- Est. flood insurance / yr
- —
Fire risk No data
- Est. fire insurance / yr
- —
Heat risk No data
- Hot days now (above threshold)
- —
- Hot days in 30 yrs
- —
Wind risk No data
- Chance of severe wind over 30 yrs
- —
Air-quality risk No data
- Unhealthy air days now
- —
- Unhealthy air days in 30 yrs
- —
Risk factors via First Street. Map © Google.
Why this score? — see what drove the D- grade
The composite is a weighted blend of 9 inputs, each scored 0–100. Each bar is that input's sub-score; the figure is the points it added to the 100-point composite (weight × sub-score).
- ARV discount +10.3/15.0
- Cash flow +9.7/30.0
- 1% rule +3.9/10.0
- Livability +3.9/5.0
- DSCR +2.7/10.0
- Rent growth +2.5/5.0
- Condition / age +2.5/5.0
- Schools +1.4/10.0
- Appreciation +0.0/10.0
$169,900
🖨 Deal sheet (PDF) 📄 Offer letter ✓ Due diligence
Listing remarks MLS
Cute house in a great location. Work needed to make this house your home. Bring all offers. Close to parks, freeways, and schools. BATVAI
Key facts
- Close to parks
- Close to schools
- Close to freeways
Tags
Property features AI
Exterior
- Parking: Detached 2-car garage
- Utilities: Public water; Public sewer
- Home design: Single-family residence; One level entry (ground level)
- Construction: Brick construction; Asphalt roof; Block foundation; Built above grade with finished living area and finished lower level
- Exterior features: Paved road access
Interior
- Bathrooms: 1 full bathroom
- Heating & cooling: Forced air heating (natural gas); No central air
- Interior features: Partially finished basement; Basement present
Neighborhood map
What this means for you Summary
Snapshot
- This is a 3-bed/1.0-bath single-family listed at $170k.
Deal economics
- At list price, monthly cash flow is $-112 ($-1k/yr) — negative.
- To cash-flow at today's rent, offer at most $150k (11.6% below list).
- To meet the 1% rule (rent ≥ 1% of price), the offer needs to be $151k (11.4% below list).
- Recommended offer: $150k (11.6% below list) — sets the bar for cash-flow.
Location & tenants
- Location reads 77/100 on livability (#116 in MI, #2,784 nationally) — a middle-class / working-renter tenant base. Strengths: employment A+, cost of living A+, housing A+; Watch: amenities D, health & safety D, commute F.
- Redford Union Schools District No. 1 (suburban): math 8% / reading 23% proficiency, ranked #489 of 540 in MI (top 91%) — low school quality limits family demand, transient renter base, plan for 1-2y turnover; 66% free/reduced lunch — lower-income household profile, screen leases tightly.
- Market conditions: 90 active listings in the ZIP; 12 comparable units currently listed for rent nearby; rentals at typical pace (median 25d on market — plan ~3-4 weeks tenant-placement turnaround); 2,639 units permitted in Wayne County in 2024 (1,216 in 5+ unit buildings).
Forward outlook
- Local home prices are declining (-3.0%/yr); year-one equity from $1k of loan paydown is wiped out by about $5k of value loss. Plan a longer hold.
- Wayne County population projected at -17% by 2050 — secular population decline; favor cash flow + early exit over multi-decade hold.
Negotiation context
- Only 12 days on market — expect competitive offers; lowballing is unlikely to land.
- 15 sale attempts since 14y ago with the ask held roughly flat each time — persistent listings suggest the price (not the market) is what's stuck; bring a comps-based counter.
- Current owner paid $100k; list at $170k implies a 70% gain — meaningful room to come down on a strong offer.
Risks & watch-outs
- Watch-outs: built in 1953 — expect roof / HVAC / electrical / plumbing capex.
Questions for the listing agent
- What do current leases actually rent for vs. the listed asking? Can we see a recent rent roll and the last 12 months of T-12 income?
- Built in 1953 — when were the roof, HVAC, electrical panel, plumbing, and water heater last replaced?
- Is there a deadline driving the sale (1031 exchange, divorce, estate, relocation)? That informs how much negotiation room exists.
- Schools are B-rated — typically a magnet for longer-tenancy family renters. What's the average tenant stay here, and is there a school-zone premium baked into asking?
- The area grade is low — what's the realistic commute time and amenity access for the typical tenant pool here? Any planned neighborhood developments (good or bad) we should know about?
- What's the average days-on-market for RENTAL listings here right now (not sales)? A rising rental-DOM trend means longer vacancies and softer asking-rent achievability than the comps imply.
- What's the recent tenant-quality profile in this submarket — average credit score on applications, eviction rate, late-payment / NSF rate, and stable-employment percentage? A property-management company in the area should have these aggregated.
- How much new for-sale + rental construction is in the pipeline within 1–3 miles? Heavy new supply typically softens prices + rents 12–24 months out; constrained supply supports both.
Investment metrics
- 1% rule
- 0.89% ✗
- Cap rate
- 5.50%
- Cash-on-cash
- -2.82%
- DSCR
- 0.87
- GRM
- 9.4
CMA / ARV
- ARV (on-the-fly)
- $181,181
- Comps found
- 12
Show comp detail 12 sales within ~0.75 mi
| Address | Dist | Beds/Ba | Sqft | Sold | Price | $/sf | Match |
|---|---|---|---|---|---|---|---|
| 18400 Delaware Ave | 0.19mi | 3/1.0 | 981 (-2%) | 6mo | $175,000 | $178 | 83 |
| 18632 Lexington | 0.30mi | 3/1.5 | 966 (-4%) | 7mo | $183,000 | $189 | 72 |
| 18653 Indian | 0.39mi | 3/1.0 | 1,071 (+7%) | 1mo | $151,000 | $141 | 70 |
| 18743 Macarthur | 0.41mi | 3/1.0 | 931 (-7%) | 3mo | $190,000 | $204 | 66 |
| 18696 Gaylord | 0.40mi | 3/1.0 | 1,071 (+7%) | 5mo | $130,000 | $121 | 65 |
| 18425 Norborne Dr | 0.48mi | 3/1.5 | 1,064 (+6%) | 7mo | $175,000 | $164 | 59 |
| 17377 Glenmore St | 0.65mi | 3/1.0 | 1,050 (+5%) | 4mo | $222,000 | $211 | 58 |
| 19203 Kinloch | 0.73mi | 3/1.0 | 962 (-4%) | 6mo | $153,500 | $160 | 55 |
| 18435 Glenmore | 0.66mi | 3/1.0 | 924 (-8%) | 5mo | $170,000 | $184 | 52 |
| 17150 Wakenden | 0.55mi | 3/1.5 | 1,120 (+12%) | 4mo | $210,000 | $188 | 49 |
| 17697 Norborne | 0.43mi | 4/1.0 (+1) | 1,134 (+13%) | 4mo | $134,500 | $119 | 49 |
| 18292 Deering St | 0.65mi | 2/1.0 (-1) | 900 (-10%) | 4mo | $163,000 | $181 | 45 |
Match score weights: distance 35% · size 25% · config 20% · recency 20%. Top-matched comps best support the ARV.
Projected returns pro-forma
-3.0% appreciation · 3.0% rent growth · sell at horizon
- IRR
- -20.9%
- Equity multiple
- 0.27×
- Total profit
- $-34,539
- Equity at exit
- $25,333
- IRR
- -14.1%
- Equity multiple
- 0.18×
- Total profit
- $-38,820
- Equity at exit
- $14,690
Cash invested: $47,572 (down + closing). Projections, not guarantees.
Landlord ↔ Tenant lean methodology
- Overall (STATE)
- 62 Landlord-Friendly
- State Michigan
- 62 Landlord-Friendly · EVEN
- County
- — inherits STATE
- City
- — inherits STATE
ZIP-level market 48240
- Active inventory
- 90
- Price-to-rent
- 9.4×
Monthly cashflow live
- Estimated rent
- $1,506 high interval (Pro) →
- Mortgage (P&I)
- −$891
- Tax from tax record
- −$340 /mo · $4,075/yr
- Insurance
- −$71
- HOA
- −$0
- Vacancy / Maint / Mgmt
- −$316
- Net cashflow
- $-112
Break-even live
Sensitivity live
| Price | -10% $-15 | -5% $-64 | +0% $-112 | +5% $-160 | +10% $-208 |
|---|---|---|---|---|---|
| Rent | -10% $-231 | -5% $-171 | +0% $-112 | +5% $-52 | +10% $7 |
| Rate | -1.0pp $-26 | -0.5pp $-68 | base $-112 | +0.5pp $-156 | +1.0pp $-200 |
UW: 25.0% down · 7.5% · 30yr · 1.5% tax · 5.0% vac · 8.0% maint · 8.0% mgmt
Financing live
Cash to close
- Down payment
- $42,475
- Closing costs
- $5,097
- Reserves months
- —
- Total cash needed
- —
Loan-product check · same deal, 3 products live
Conventional
25% down · 7.5% · 30yr
- Down + closing
- —
- Monthly P&I
- —
- Monthly cashflow
- —
- DSCR
- —
- Eligible?
- —
Personal DTI + credit; lowest rate.
DSCR
20% down · 8.5% · 30yr
- Down + closing
- —
- Monthly P&I
- —
- Monthly cashflow
- —
- DSCR
- —
- Eligible?
- —
No personal income docs; deal must DSCR.
Hard money
10% down · 12.0% · 12mo
- Down + closing
- —
- Monthly P&I
- —
- Monthly cashflow
- —
- DSCR
- —
- Eligible?
- —
Short-term bridge; refi at stabilization.
Rent comps 12 comps
| Address | Beds | Baths | Sqft | Rent | $/sqft | DOM | Units | Dist |
|---|---|---|---|---|---|---|---|---|
| 26539 Clarita Redford, MI | 3.0 | 1.5 | 931 | $1,875 | $2.01 | 25d | 1 | 0.44mi |
| 25822 W 6 Mile Rd Redford Township, MI | 2.0 | 2.0 | 1100 | $1,100 | $1.00 | 25d | 1 | 0.69mi |
| 19354 Seminole Redford, MI | 3.0 | 1.0 | 1050 | $1,450 | $1.38 | 25d | 1 | 0.80mi |
| 18405 Gillman St Livonia, MI | 3.0 | 2.0 | 1014 | $1,950 | $1.92 | 6d | 1 | 0.83mi |
| 17324 Salem St Detroit, MI | 2.0 | 1.0 | 989 | $1,200 | $1.21 | 25d | 1 | 1.19mi |
| 18732 Salem Unit 2 Detroit, MI | 2.0 | 1.0 | 925 | $1,050 | $1.14 | 13d | 1 | 1.25mi |
| 16896 Salem St Detroit, MI | 3.0 | 1.0 | 1150 | $1,300 | $1.13 | 44d | 1 | 1.27mi |
| 20091 Inkster Rd Livonia, MI | 2.0 | 1.0 | 756 | $1,400 | $1.85 | 6d | 1 | 1.33mi |
| 29200 Dardanella St Livonia, MI | 1.0–2.0 | 1.0 | 825 | $1,230 | $1.49 | 0d | 5 | 1.42mi |
| 20516 Denby Redford, MI | 4.0 | 1.5 | 950 | $1,800 | $1.89 | 19d | 1 | 1.44mi |
| 20524 Indian Redford, MI | 3.0 | 1.0 | 988 | $1,600 | $1.62 | 25d | 1 | 1.46mi |
| 18302 Wormer St Detroit, MI | 3.0 | 1.0 | 1046 | $1,475 | $1.41 | 44d | 1 | 1.46mi |
Listing history 9 events
-
2026-06-21days on market $169,900 Active 12 DOM
-
2026-06-18days on market $169,900 Active 9 DOM
-
2026-06-17days on market $169,900 Active 8 DOM
-
2026-06-16days on market $169,900 Active 7 DOM
-
2026-06-15days on market $169,900 Active 6 DOM
-
2026-06-13days on market $169,900 Active 4 DOM
-
2026-06-13days on market $169,900 Active 3 DOM
-
2026-06-10remarks 137-char remark
-
2026-06-10$169,900 Active 1 DOM
ⓘ Source: listings_history table (triggers on properties + properties_extension) + one-shot
backfill from property_details.listing_events for pre-trigger history.
Tax reassessment forecast MI · Partial reset (capped growth)
- Current annual tax
- $4,075 · $340/mo
- Projected year-2 tax
- $4,075 · $340/mo
- Expected delta
- $0/yr ($0/mo · 0.0%)
ⓘ Screening estimate from a state-policy table — verify with the county assessor before closing.
Nearby sold comps map
Loading sold comps map…
Walkable amenities ~0.75 mi
Loading nearby amenities…
Taxation est. · year 1
- Rental income
- $18,072
- − Mortgage interest
- −$9,517
- − Property taxes
- −$4,075
- − Insurance
- −$850
- − Repairs & maintenance
- −$1,446
- − Management
- −$1,446
- − Depreciation
- −$4,943
- Taxable loss
- −$4,204
- Est. tax savings @ 24.0%
- +$1,009
- After-tax cash flow
- $-331/yr
For passive investors: Depreciation is non-cash, so a rental often shows a tax loss while cash-flowing — sheltering income. Rental losses are passive: they offset passive income freely, and up to $25,000/yr can offset ordinary (W-2) income if you actively participate and your MAGI is under $100k (phasing out to $0 by $150k); unused losses carry forward. On sale, claimed depreciation is recaptured at up to 25%, and gains may owe capital-gains tax (a 1031 exchange can defer both). Figures are a year-1 estimate at your 24.0% rate — not tax advice; consult a CPA.
Schools (NCES district)
- District
- Redford Union Schools District No. 1
- NCES district ID
- 2629460
- Math proficiency
- 8% ▼ -6.00%
- Reading proficiency
- 23% ▬ 0.00%
- Median HH income
- $49,778
- Composite
- 14.1/100
- National rank
- #9460
- State rank
- #489 of 540 in MI
Livability — Livonia
- Score
- 77/100
- State rank
- #116
- US rank
- #2784
Category grades
Schools grade is shown separately in the Schools card above.
Census & demographics
- City population
- 56,806
- Population (ZIP)
- 17,097
Population outlook (Wayne County) Hauer SSP2
- Today (2025)
- 1,675,273 people
- By 2030
- 1,620,300 · -3.3%
- By 2040
- 1,502,341 · -10.3%
- By 2050
- 1,384,039 · -17.4%
- By 2075
- 1,124,592 · -32.9%
- By 2100
- 881,193 · -47.4%
Race, ethnicity, and origin ACS 2023
- Neighborhood character
- Diverse neighborhood (Simpson 0.64)
- Race & ethnicity
- White 45% Black 40% Two or more races 10% Hispanic / Latino 6%
- Hispanic origin (detail)
- Mexican 6%
- Common ancestry
- Romanian 5% Lithuanian 3% Slovak 2%
- Foreign-born
- 4% · Canada
- Languages at home
- 93% English-only · Spanish 5% Chinese 1%
Political lean MEDSL · Wayne
- 2024 margin
- Strong D (+29.0) · D 62.7% · R 33.7% · Other 3.6%
- 2008→2024 swing
- -20.5pp toward R · 2008: 49.5pp · 2024: 29.0pp
- All cycles
- 2024: D+29.0 2020: D+38.1 2016: D+37.3 2012: D+46.9 2008: D+49.5
Not yet ingested
- Civics
- —
Market trends
- HPI YoY
- ▼ -177.98%
- Current HPI
- 236.2958
- Rent YoY
- —
- Metro
- —
- State GDP YoY
- ▲ 1.37%
- F500 in state
- 28
Industry mix (Fortune 500 HQ in MI)
| Industry | F500 HQs | Revenue |
|---|---|---|
| Automotive Parts | 3 | $48B |
|
||
| Automotive | 2 | $372B |
|
||
| Chemicals | 1 | $45B |
|
||
| Automotive Retail | 1 | $29B |
|
||
| Healthcare / Medical Devices | 1 | $23B |
|
||
| Automotive Technology | 1 | $20B |
|
||
Price history
+277.6% since first listed38 events — show timeline
- 2026-06-09 Listed $169,900 REALCOMP
- 2026-06-09 Listed $169,900 MiRealSource-MiMLS
- 2019-07-16 Listing Removed — REALCOMP
- 2019-06-10 Sold (MLS) $99,900 MiRealSource-MiMLS
- 2019-06-10 Sold (MLS) $99,900 REALCOMP
- 2019-03-21 Pending — MiRealSource-MiMLS
- 2019-03-21 Pending — REALCOMP
- 2019-02-04 Listed $99,900 MiRealSource-MiMLS
- 2019-02-04 Listed $99,900 REALCOMP
- 2018-03-14 Listing Removed — REALCOMP
- 2018-03-14 Listing Removed — MiRealSource-MiMLS
- 2017-09-28 Listed $135,000 MiRealSource-MiMLS
- 2017-09-28 Listed $135,000 REALCOMP
- 2015-10-07 Sold (MLS) $58,250 MiRealSource-MiMLS
- 2015-10-07 Sold (MLS) $58,250 REALCOMP
- 2015-08-31 Listing Removed — REALCOMP
- 2015-08-28 Listing Removed — MiRealSource-MiMLS
- 2015-07-31 Price Changed $63,999 REALCOMP
- 2015-07-20 Price Changed $65,000 REALCOMP
- 2015-07-03 Listing Removed — REALCOMP
- 2015-07-03 Listed $68,500 REALCOMP
- 2015-07-03 Listing Removed — MiRealSource-MiMLS
- 2015-07-03 Listed $63,999 MiRealSource-MiMLS
- 2015-06-22 Relisted — REALCOMP
- 2015-06-12 Listing Removed — REALCOMP
- 2015-06-03 Listed $68,500 REALCOMP
- 2015-06-03 Listed $68,500 MiRealSource-MiMLS
- 2013-01-02 Sold (Public Records) $45,000 Public Records
- 2012-11-13 Sold (MLS) $45,000 REALCOMP
- 2012-11-13 Sold (MLS) $45,000 MiRealSource-MiMLS
- 2012-10-04 Listing Removed — REALCOMP
- 2012-10-04 Listing Removed — MiRealSource-MiMLS
- 2012-10-03 Listing Removed — MiRealSource-MiMLS
- 2012-10-03 Listing Removed — REALCOMP
- 2012-10-03 Listed $45,000 REALCOMP
- 2012-10-03 Listed $45,000 MiRealSource-MiMLS
- 2012-07-17 Listed $45,000 MiRealSource-MiMLS
- 2012-07-17 Listed $45,000 REALCOMP
Property tax history
+9.2%/yrLatest (2025): $4,075 · +13.2% YoY. Source: county tax records.
Cash-flow waterfall
monthlySold comps — $/sqft
last 12 mo · ≤1 miLoading sold comps…