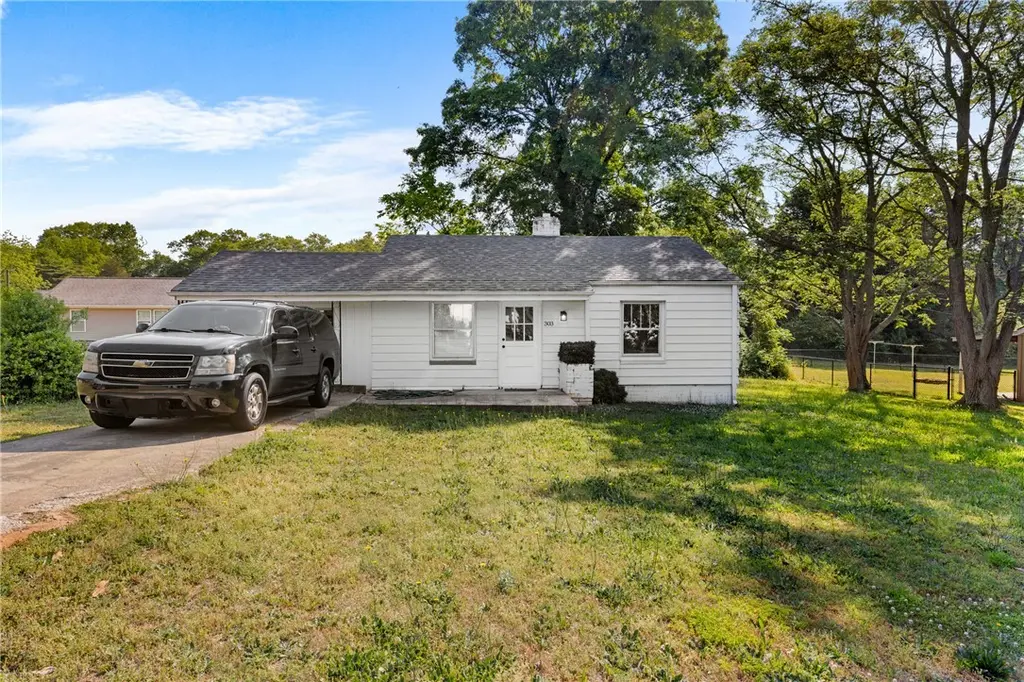
303 S Elm St · Pendleton, SC
Flood risk 1/10 · Minimal
- FEMA flood zone
- X (unshaded)
- Chance of flooding over 30 yrs
- 0.0%
- Est. flood insurance / yr
- $507 – $1,088
Fire risk 4/10 · Minor
- Est. fire insurance / yr
- $783 – $1,453
Heat risk 6/10 · Moderate
- Hot days now (above 105°F)
- 7 days/yr
- Hot days in 30 yrs
- 17 days/yr
Wind risk 2/10 · Minimal
- Chance of severe wind over 30 yrs
- 2.0%
Air-quality risk 4/10 · Minor
- Unhealthy air days now
- 3 days/yr
- Unhealthy air days in 30 yrs
- 4 days/yr
Risk factors via First Street. Map © Google.
Why this score? — see what drove the C grade
The composite is a weighted blend of 9 inputs, each scored 0–100. Each bar is that input's sub-score; the figure is the points it added to the 100-point composite (weight × sub-score).
- Cash flow +24.4/30.0
- DSCR +7.9/10.0
- ARV discount +7.5/15.0
- 1% rule +6.1/10.0
- Schools +4.9/10.0
- Livability +3.4/5.0
- Rent growth +2.5/5.0
- Condition / age +2.5/5.0
- Appreciation +0.0/10.0
$159,000
🖨 Deal sheet (PDF) 📄 Offer letter ✓ Due diligence
Listing remarks
A fantastic bungalow in the center of growing Downtown Pendleton. This home sits on almost a quarter-acre level lot and offers 3 well-sized bedrooms, a living space, a kitchen, and 1 full bathroom. A perfect home in a growing area that offers options, from being a starter home or an investment property with much potential. Recently installed new flooring throughout, and the current roof was replaced in 2017. It is very walkable to the Square on Pendleton and adjacent to Veterans Park for easy access. Located approximately 1 mile from Tri-County Tech and 4 miles from Clemson University. 24 advance notice for showings is required.
Key facts
- New flooring
- Replaced roof
- Listed 17 days
Tags
Property features AI
Exterior
- Utilities: Public water; Public sewer
- Home design: Single-story home; Over 50 years old
- Construction: Vinyl siding; Crawlspace and slab foundation
- Exterior features: City lot; Not in a subdivision
Interior
- Bedrooms: 3 main-level bedrooms
- Bathrooms: 1 full bathroom on the main level
- Heating & cooling: Central electric heating; Central electric cooling
- Interior features: Crawl space basement
Neighborhood map
What this means for you Summary
Snapshot
- This is a 3-bed/1.0-bath other listed at $159k.
Deal economics
- At list price, monthly cash flow is $324 ($4k/yr) — positive.
- The deal already cash-flows at list — no discount required.
- Meets the 1% rule at list price ($2k rent vs $159k).
- Recommended offer: $157k (1.5% below list) — sets the bar for market timing.
- Cap rate 8.7% vs local median 3.1% in Pendleton — top-decile yield for the area; either an underpriced asset or a hidden risk that comps aren't pricing in. Stress-test before assuming the spread holds.
Location & tenants
- Location reads 68/100 on livability (#82 in SC) — a middle-class / working-renter tenant base. Strengths: cost of living A+, housing A, health & safety B+; Watch: schools D+, amenities F, commute F.
- Anderson 04 (rural): math 56% / reading 60% proficiency, ranked #4 of 80 in SC (top 5%) — acceptable for families but not a draw, mixed tenant base, ~2y average lease.
- Market conditions: 161 active listings in the ZIP; 4 comparable units currently listed for rent nearby; rentals at typical pace (median 25d on market — plan ~3-4 weeks tenant-placement turnaround); 1,255 units permitted in Anderson County in 2024 (0 in 5+ unit buildings).
Forward outlook
- Local home prices are declining (-3.0%/yr); year-one equity from $1k of loan paydown is wiped out by about $5k of value loss. Plan a longer hold.
- Anderson County population projected at +14% by 2050 — modest demand growth; plan on rents tracking national, not racing it.
Negotiation context
- It's been on market 17 days — a 2% lower offer ($157k) is reasonable based on typical stale-listing flexibility.
- 5 sale attempts since 2y ago with the ask held roughly flat each time — persistent listings suggest the price (not the market) is what's stuck; bring a comps-based counter.
- Current owner paid $135k; 18% above their basis — modest negotiation headroom, anchor on the comps not their cost.
Risks & watch-outs
- Climate carrying-cost: extreme-heat days projected 7→17/yr by 2055 (HVAC capex compounding) — expect insurance premiums to compound above CPI over the hold.
Questions for the listing agent
- Is there a deadline driving the sale (1031 exchange, divorce, estate, relocation)? That informs how much negotiation room exists.
- Schools are D-rated, which usually means shorter tenancies and higher turnover. Who's the typical renter profile here, and what's been the actual vacancy rate?
- What's the average days-on-market for RENTAL listings here right now (not sales)? A rising rental-DOM trend means longer vacancies and softer asking-rent achievability than the comps imply.
- What's the recent tenant-quality profile in this submarket — average credit score on applications, eviction rate, late-payment / NSF rate, and stable-employment percentage? A property-management company in the area should have these aggregated.
- How much new for-sale + rental construction is in the pipeline within 1–3 miles? Heavy new supply typically softens prices + rents 12–24 months out; constrained supply supports both.
Investment metrics
- 1% rule
- 1.11% ✓
- Cap rate
- 8.74%
- Cash-on-cash
- 8.74%
- DSCR
- 1.39
- GRM
- 7.5
CMA / ARV
No comps found within radius.
Projected returns pro-forma
-3.0% appreciation · 3.0% rent growth · sell at horizon
- IRR
- -3.0%
- Equity multiple
- 0.89×
- Total profit
- $-5,102
- Equity at exit
- $23,707
- IRR
- 6.7%
- Equity multiple
- 1.50×
- Total profit
- $22,186
- Equity at exit
- $13,747
Cash invested: $44,520 (down + closing). Projections, not guarantees.
Landlord ↔ Tenant lean methodology
- Overall (STATE)
- 90 Strongly Landlord-Friendly
- State South Carolina
- 90 Strongly Landlord-Friendly · R+6
- County
- — inherits STATE
- City
- — inherits STATE
ZIP-level market 29670
- Home prices YoY
- -2.8%
- Active inventory
- 161
- Price-to-rent
- 7.5×
Monthly cashflow live
- Estimated rent
- $1,763 medium interval (Pro) →
- Mortgage (P&I)
- −$834
- Tax from tax record
- −$169 /mo · $2,022/yr
- Insurance
- −$66
- HOA
- −$0
- Vacancy / Maint / Mgmt
- −$370
- Net cashflow
- $324
Break-even live
Sensitivity live
| Price | -10% $414 | -5% $369 | +0% $324 | +5% $279 | +10% $234 |
|---|---|---|---|---|---|
| Rent | -10% $185 | -5% $255 | +0% $324 | +5% $394 | +10% $464 |
| Rate | -1.0pp $404 | -0.5pp $365 | base $324 | +0.5pp $283 | +1.0pp $241 |
UW: 25.0% down · 7.5% · 30yr · 1.5% tax · 5.0% vac · 8.0% maint · 8.0% mgmt
Financing live
Cash to close
- Down payment
- $39,750
- Closing costs
- $4,770
- Reserves months
- —
- Total cash needed
- —
Loan-product check · same deal, 3 products live
Conventional
25% down · 7.5% · 30yr
- Down + closing
- —
- Monthly P&I
- —
- Monthly cashflow
- —
- DSCR
- —
- Eligible?
- —
Personal DTI + credit; lowest rate.
DSCR
20% down · 8.5% · 30yr
- Down + closing
- —
- Monthly P&I
- —
- Monthly cashflow
- —
- DSCR
- —
- Eligible?
- —
No personal income docs; deal must DSCR.
Hard money
10% down · 12.0% · 12mo
- Down + closing
- —
- Monthly P&I
- —
- Monthly cashflow
- —
- DSCR
- —
- Eligible?
- —
Short-term bridge; refi at stabilization.
Rent comps 4 comps
| Address | Beds | Baths | Sqft | Rent | $/sqft | DOM | Units | Dist |
|---|---|---|---|---|---|---|---|---|
| 410 Mountain Mint LN Pendleton, SC | 1.0–3.0 | 1.0–2.0 | 954 | $1,765 | $1.85 | 4d | 20 | 0.35mi |
| 804 S Mechanic St Unit 3A Pendleton, SC | 3.0 | 2.5 | 1320 | $1,675 | $1.27 | 25d | 1 | 0.56mi |
| 319 Noble Ln Unit 319 Pendleton, SC | 3.0 | 2.5 | 1234 | $1,600 | $1.30 | 25d | 1 | 1.01mi |
| 435 W Queen St Pendleton, SC | 2.0 | 1.0 | 1100 | $1,200 | $1.09 | 25d | 1 | 1.02mi |
Listing history 14 events
-
2026-05-15status Pending
-
2026-04-27$159,000 Active
-
2025-10-22historical $1,300
-
2025-09-24$1,300
-
2025-09-05historical $1,300
-
2025-08-21$1,300
-
2025-07-16historical
-
2025-06-25price $179,000
-
2025-04-25price $199,000
-
2025-02-03$215,000 Active
-
2024-10-25historical $1,300
-
2024-09-24$1,300
-
2017-02-21soldstatus $135,000
-
1987-03-17soldstatus $17,000
ⓘ Source: listings_history table (triggers on properties + properties_extension) + one-shot
backfill from property_details.listing_events for pre-trigger history.
Tax reassessment forecast SC · Resets to sale price
- Current annual tax
- $2,022 · $169/mo
- Projected year-2 tax
- $2,022 · $169/mo
- Expected delta
- $0/yr ($0/mo · 0.0%)
ⓘ Screening estimate from a state-policy table — verify with the county assessor before closing.
Climate risk First Street
- Flood 1/10 Low FEMA zone X (unshaded) · 0% chance over 30 yrs
- Wildfire 4/10 Moderate
- Heat 6/10 Major 7 d/yr ≥105°F today · 17 d/yr by 30 yrs out
- Wind 2/10 Low 2% chance of damaging wind over 30 yrs
- Air quality 4/10 Moderate 3 unhealthy d/yr today · 4 by 30 yrs out
Nearby sold comps map
Loading sold comps map…
Walkable amenities ~0.75 mi
Loading nearby amenities…
Taxation est. · year 1
- Rental income
- $21,158
- − Mortgage interest
- −$8,906
- − Property taxes
- −$2,022
- − Insurance
- −$795
- − Repairs & maintenance
- −$1,693
- − Management
- −$1,693
- − Depreciation
- −$4,625
- Taxable income
- $1,423
- Est. tax owed @ 24.0%
- −$342
- After-tax cash flow
- $3,550/yr
For passive investors: Depreciation is non-cash, so a rental often shows a tax loss while cash-flowing — sheltering income. Rental losses are passive: they offset passive income freely, and up to $25,000/yr can offset ordinary (W-2) income if you actively participate and your MAGI is under $100k (phasing out to $0 by $150k); unused losses carry forward. On sale, claimed depreciation is recaptured at up to 25%, and gains may owe capital-gains tax (a 1031 exchange can defer both). Figures are a year-1 estimate at your 24.0% rate — not tax advice; consult a CPA.
Schools (NCES district)
- District
- Anderson 04
- NCES district ID
- 4500870
- Math proficiency
- 56% ▼ -5.00%
- Reading proficiency
- 60% ▼ -1.00%
- Median HH income
- $48,338
- Composite
- 49.25/100
- National rank
- #2030
- State rank
- #4 of 80 in SC
Livability — Pendleton
- Score
- 68/100
- State rank
- #82
- US rank
- #9399
Category grades
Schools grade is shown separately in the Schools card above.
Census & demographics
- Census place
- Pendleton, SC
- County
- Anderson County · 99,076 people
- City population
- 11,084
- Metro
- Greenville-Anderson, SC
- Population (ZIP)
- 11,084
- Household income
- $72,445
- Rent vs Own
- Severe rent burden
- 280.0
Population outlook (Anderson County) Hauer SSP2
- Today (2025)
- 210,546 people
- By 2030
- 217,791 · +3.4%
- By 2040
- 230,643 · +9.5%
- By 2050
- 240,220 · +14.1%
- By 2075
- 259,518 · +23.3%
- By 2100
- 258,696 · +22.9%
Race, ethnicity, and origin ACS 2023
- Neighborhood character
- Predominantly White (75%)
- Race & ethnicity
- White 75% Black 15% Two or more races 5% Hispanic / Latino 2% Asian 1%
- Common ancestry
- Slovak 5% Lithuanian 5% Serbian 4%
- Foreign-born
- 3% · Canada
- Languages at home
- 96% English-only · Spanish 2% Other Indo-European 1%
Political lean MEDSL · Anderson
- 2024 margin
- Solid R (+47.4) · D 25.7% · R 73.1% · Other 1.2%
- 2008→2024 swing
- -14.1pp toward R · 2008: -33.3pp · 2024: -47.4pp
- All cycles
- 2024: R+47.4 2020: R+42.0 2016: R+43.7 2012: R+36.4 2008: R+33.3
Not yet ingested
- Civics
- —
Market trends
- HPI YoY
- ▼ -10.11%
- Current HPI
- 348.1373
- Rent YoY
- —
- Metro
- Greenville-Anderson, SC
- State GDP YoY
- ▲ 4.51%
- F500 in state
- 2
Industry mix (Fortune 500 HQ in SC)
| Industry | F500 HQs | Revenue |
|---|---|---|
| Packaging | 1 | $7B |
|
||
Price history
+835.3% since first listed14 events — show timeline
- 2026-05-15 Pending — WUMLS
- 2026-04-27 Listed $159,000 WUMLS
- 2025-10-22 Rental Removed $1,300 APPFOLIO
- 2025-09-24 Listed for Rent $1,300 APPFOLIO
- 2025-09-05 Rental Removed $1,300 APPFOLIO
- 2025-08-21 Listed for Rent $1,300 APPFOLIO
- 2025-07-16 Listing Removed — WUMLS
- 2025-06-25 Price Changed $179,000 WUMLS
- 2025-04-25 Price Changed $199,000 WUMLS
- 2025-02-03 Listed $215,000 WUMLS
- 2024-10-25 Rental Removed $1,300 APPFOLIO
- 2024-09-24 Listed for Rent $1,300 APPFOLIO
- 2017-02-21 Sold (Public Records) $135,000 Public Records
- 1987-03-17 Sold (Public Records) $17,000 Public Records
Property tax history
+7.2%/yrLatest (2022): $2,022 · +11.4% YoY. Source: county tax records.
Cash-flow waterfall
monthlySold comps — $/sqft
last 12 mo · ≤1 miLoading sold comps…