4185 County Road 497 · Anson, TX
Flood risk No data
- FEMA flood zone
- —
- Chance of flooding over 30 yrs
- —
- Est. flood insurance / yr
- —
Fire risk No data
- Est. fire insurance / yr
- —
Heat risk No data
- Hot days now (above threshold)
- —
- Hot days in 30 yrs
- —
Wind risk No data
- Chance of severe wind over 30 yrs
- —
Air-quality risk No data
- Unhealthy air days now
- —
- Unhealthy air days in 30 yrs
- —
Risk factors via First Street. Map © Google.
Why this score? — see what drove the A- grade
The composite is a weighted blend of 9 inputs, each scored 0–100. Each bar is that input's sub-score; the figure is the points it added to the 100-point composite (weight × sub-score).
- Cash flow +30.0/30.0
- ARV discount +10.7/15.0
- 1% rule +10.0/10.0
- DSCR +10.0/10.0
- Appreciation +7.1/10.0
- Condition / age +4.8/5.0
- Livability +3.5/5.0
- Schools +2.8/10.0
- Rent growth +2.5/5.0
$199,900
🖨 Deal sheet 📄 Offer letter ✓ Due diligence
Listing remarks
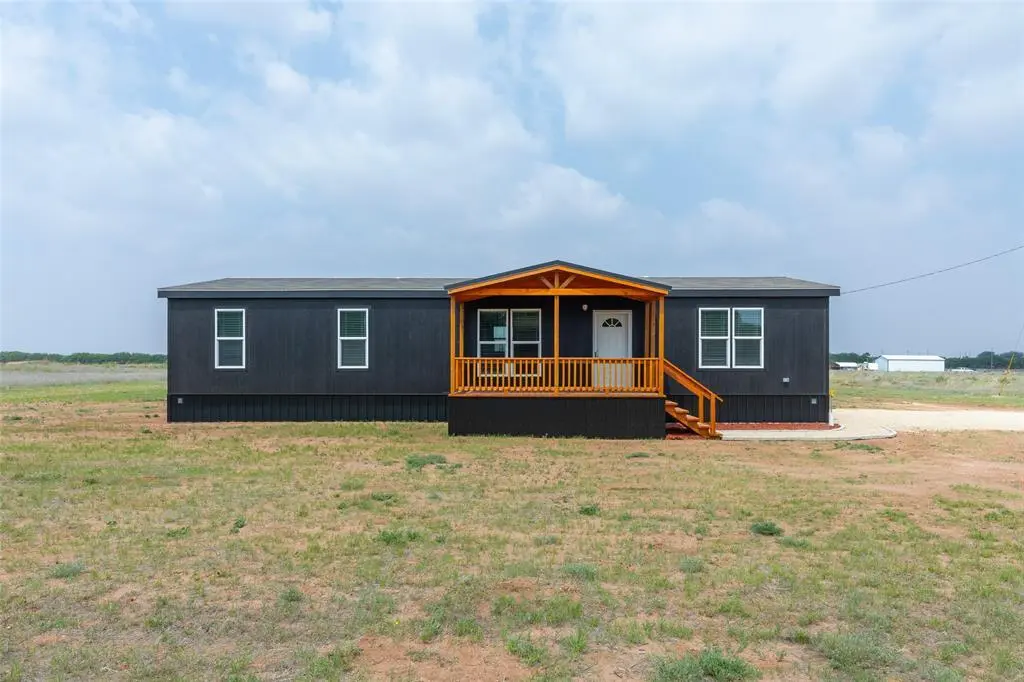
Owner related to agent. This brand new, move-in ready, 4-2 manufactured home on 1.96 acres has it all. The front boasts a beautiful, fully covered and skirted front deck for enjoying West Texas sunrises. Inside you will find brand new factory-warrantied appliances, a dedicated space for your washer and dryer, a massive pantry, and a thoughtfully laid out floor plan. It has been set on a custom, engineer-certified, permanent foundation allowing it to qualify for any type of financing and giving you the confidence that things have been done right. If you want to escape the rising costs and chaos of the city, with a short commute back to it’s conveniences, you’ve found it. Book a s
Key facts
- Massive pantry
- 1.96 acre lot
- Built 2026
Tags
Property features AI
Finance
- Other: Property type: Residential mobile home; Lot: Approximately 1.96 acres (will not subdivide); Restrictions: Building and other restrictions; Possession at closing/funding
- Financial info: Listing accepts Cash, Conventional, FHA, and VA financing; No second mortgage
- HOA & community: No association
Exterior
- Parking: Driveway (no garage, no covered/carport spaces)
- Utilities: Aerobic septic; Electricity connected; Individual water meter; All-weather road access; Gravel/rock driveway
- Home design: Mobile home (attached); One story; New construction completed in 2026; Deed restrictions apply
- Construction: Composition/shingle roof; Other foundation
- Exterior features: Covered deck; Covered porch/deck
Interior
- Kitchen: Dishwasher; Electric oven; Electric range; Refrigerator; Vented exhaust fan
- Bedrooms: 4 bedrooms (primary bedroom on main level)
- Flooring: Vinyl flooring
- Bathrooms: 2 full bathrooms
- Heating & cooling: Central heating (electric); Central air (electric)
- Interior features: Kitchen island; Pantry; Walk-in closet(s); Window coverings; One living area; One dining area; 2 total bathrooms
- Laundry & utility: Washer hookup; Electric dryer hookup; Utility room; Electric water heater
Neighborhood map
What this means for you Summary
Snapshot
- This is a 4-bed/2.0-bath manufactured listed at $200k. Condition is rated excellent.
Deal economics
- At list price, monthly cash flow is $1k ($17k/yr) — positive.
- The deal already cash-flows at list — no discount required.
- Meets the 1% rule at list price ($4k rent vs $200k).
- Recommended offer: $197k (1.5% below list) — sets the bar for market timing.
Location & tenants
- Location reads 70/100 on livability (#377 in TX) — a middle-class / working-renter tenant base. Strengths: crime A+, cost of living A+, housing A-; Watch: health & safety C-, employment D, amenities F.
- Anson ISD (rural): math 29% / reading 37% proficiency, ranked #565 of 826 in TX (top 68%) — families likely to look elsewhere, expect single-tenant / working-renter base with shorter leases.
- Zoned schools: Anson El (math 17% / reading 32%, grade F, #3,052 of 4,322 statewide, top 74%, 368 students, 68% FRL).
- Market conditions: 71 active listings in the ZIP; 1 units permitted in Jones County in 2024 (0 in 5+ unit buildings).
Forward outlook
- In year one you build about $10k of equity ($1k loan paydown + $8k appreciation (4.1% local appreciation)).
- Jones County population projected at +13% by 2050 — modest demand growth; plan on rents tracking national, not racing it.
- At projected returns (4.1% appreciation + 3.0% rent growth), your $56k cash investment doubles in ~3 years — after that, you're playing with house money.
- By year 4, paydown + projected appreciation supports a ~$33k cash-out refi (75% LTV) — recoverable capital for the next deal without selling this one.
Negotiation context
- It's been on market 24 days — a 2% lower offer ($197k) is reasonable based on typical stale-listing flexibility.
Questions for the listing agent
- Is there a deadline driving the sale (1031 exchange, divorce, estate, relocation)? That informs how much negotiation room exists.
- Schools are D-rated, which usually means shorter tenancies and higher turnover. Who's the typical renter profile here, and what's been the actual vacancy rate?
- What's the average days-on-market for RENTAL listings here right now (not sales)? A rising rental-DOM trend means longer vacancies and softer asking-rent achievability than the comps imply.
- What's the recent tenant-quality profile in this submarket — average credit score on applications, eviction rate, late-payment / NSF rate, and stable-employment percentage? A property-management company in the area should have these aggregated.
- How much new for-sale + rental construction is in the pipeline within 1–3 miles? Heavy new supply typically softens prices + rents 12–24 months out; constrained supply supports both.
Investment metrics
- 1% rule
- 1.75% ✓
- Cap rate
- 14.62%
- Cash-on-cash
- 29.75%
- DSCR
- 2.32
- GRM
- 4.8
CMA / ARV
- ARV (on-the-fly)
- $215,350
- Comps found
- 1
Show comp detail 1 sale within ~0.75 mi
| Address | Dist | Beds/Ba | Sqft | Sold | Price | $/sf | Match |
|---|---|---|---|---|---|---|---|
| 4377 County Road 497 | 0.37mi | 3/2.0 (-1) | 1,512 (+2%) | 4mo | $220,000 | $146 | 70 |
Match score weights: distance 35% · size 25% · config 20% · recency 20%. Top-matched comps best support the ARV.
Projected returns pro-forma
4.13% appreciation · 3.0% rent growth · sell at horizon
- IRR
- 37.5%
- Equity multiple
- 3.23×
- Total profit
- $124,730
- Equity at exit
- $102,891
- IRR
- 36.5%
- Equity multiple
- 6.47×
- Total profit
- $305,902
- Equity at exit
- $169,525
Cash invested: $55,972 (down + closing). Projections, not guarantees.
Landlord ↔ Tenant lean methodology
- Overall (STATE)
- 87 Strongly Landlord-Friendly
- State Texas
- 87 Strongly Landlord-Friendly · R+5
- County
- — inherits STATE
- City
- — inherits STATE
ZIP-level market 79501
- Home prices YoY
- 2.9%
- Active inventory
- 71
- Price-to-rent
- 4.8×
Monthly cashflow live
- Estimated rent
- $3,505 medium interval (Pro) →
- Mortgage (P&I)
- −$1,048
- Tax est. 1.5%
- −$250 /mo · $2,998/yr
- Insurance
- −$83
- HOA
- −$0
- Vacancy / Maint / Mgmt
- −$736
- Net cashflow
- $1,387
Break-even live
UW: 25.0% down · 7.5% · 30yr · 1.5% tax · 5.0% vac · 8.0% maint · 8.0% mgmt
Financing live
Cash to close
- Down payment
- $49,975
- Closing costs
- $5,997
- Reserves months
- —
- Total cash needed
- —
Loan-product check · same deal, 3 products live
Conventional
25% down · 7.5% · 30yr
- Down + closing
- —
- Monthly P&I
- —
- Monthly cashflow
- —
- DSCR
- —
- Eligible?
- —
Personal DTI + credit; lowest rate.
DSCR
20% down · 8.5% · 30yr
- Down + closing
- —
- Monthly P&I
- —
- Monthly cashflow
- —
- DSCR
- —
- Eligible?
- —
No personal income docs; deal must DSCR.
Hard money
10% down · 12.0% · 12mo
- Down + closing
- —
- Monthly P&I
- —
- Monthly cashflow
- —
- DSCR
- —
- Eligible?
- —
Short-term bridge; refi at stabilization.
Listing history 13 events
-
2026-06-15statusdays on market $199,900 Pending 24 DOM
-
2026-06-14days on market $199,900 Active Option Contract 23 DOM
-
2026-06-13days on market $199,900 Active Option Contract 22 DOM
-
2026-06-10days on market $199,900 Active Option Contract 20 DOM
-
2026-06-09days on market $199,900 Active Option Contract 19 DOM
-
2026-06-08days on market $199,900 Active Option Contract 18 DOM
-
2026-06-07statusdays on market $199,900 Active Option Contract 17 DOM
-
2026-06-03days on market $199,900 Active 13 DOM
-
2026-06-02days on market $199,900 Active 12 DOM
-
2026-06-01days on market $199,900 Active 11 DOM
-
2026-05-31days on market $199,900 Active 10 DOM
-
2026-05-30days on market $199,900 Active 9 DOM
-
2026-05-21$199,900 Active
ⓘ Source: listings_history table (triggers on properties + properties_extension) + one-shot
backfill from property_details.listing_events for pre-trigger history.
Nearby sold comps map
Loading sold comps map…
Walkable amenities ~0.75 mi
Loading nearby amenities…
Taxation est. · year 1
- Rental income
- $42,060
- − Mortgage interest
- −$11,198
- − Property taxes
- −$2,998
- − Insurance
- −$1,000
- − Repairs & maintenance
- −$3,365
- − Management
- −$3,365
- − Depreciation
- −$5,815
- Taxable income
- $14,320
- Est. tax owed @ 24.0%
- −$3,437
- After-tax cash flow
- $13,213/yr
For passive investors: Depreciation is non-cash, so a rental often shows a tax loss while cash-flowing — sheltering income. Rental losses are passive: they offset passive income freely, and up to $25,000/yr can offset ordinary (W-2) income if you actively participate and your MAGI is under $100k (phasing out to $0 by $150k); unused losses carry forward. On sale, claimed depreciation is recaptured at up to 25%, and gains may owe capital-gains tax (a 1031 exchange can defer both). Figures are a year-1 estimate at your 24.0% rate — not tax advice; consult a CPA.
Condition & rehab AI · 13 photos
This move-in ready manufactured home is in excellent condition with no visible repairs needed. It offers a great opportunity for both resale and rental due to its location and features.
Value-add opportunities
- Both Paint the exterior siding — Enhances curb appeal and resale value
- Both Install a security system — Improves safety and rental appeal
- Both Add landscaping around the front porch — Enhances curb appeal and rental appeal
Renovation cost estimate screening
Value-add ROI direction
- Both Paint the exterior siding — Enhances curb appeal and resale value ↑
- Both Install a security system — Improves safety and rental appeal ↑
- Both Add landscaping around the front porch — Enhances curb appeal and rental appeal ↑
ⓘ Cost ranges are severity-bucket heuristics (US national rule-of-thumb). Get contractor quotes + a written scope before underwriting a rehab budget.
Schools (NCES district)
- District
- Anson ISD
- NCES district ID
- 4808400
- Math proficiency
- 29% ▼ -9.00%
- Reading proficiency
- 37% ▼ -3.00%
- Median HH income
- $45,223
- Composite
- 28.21/100
- National rank
- #6805
- State rank
- #565 of 826 in TX
Livability — Anson
- Score
- 70/100
- State rank
- #377
- US rank
- #7976
Category grades
Schools grade is shown separately in the Schools card above.
Census & demographics
- City population
- 2,635
- Population (ZIP)
- 2,635
Population outlook (Jones County) Hauer SSP2
- Today (2025)
- 19,845 people
- By 2030
- 20,213 · +1.9%
- By 2040
- 21,446 · +8.1%
- By 2050
- 22,499 · +13.4%
- By 2075
- 23,272 · +17.3%
- By 2100
- 20,420 · +2.9%
Race, ethnicity, and origin ACS 2023
- Neighborhood character
- Predominantly White (65%)
- Race & ethnicity
- White 65% Hispanic / Latino 31% Two or more races 12% Black 2%
- Hispanic origin (detail)
- Mexican 24%
- Common ancestry
- Slovak 4% Serbian 2% Scotch-Irish 1%
- Foreign-born
- 5% · Canada, Vietnam
- Languages at home
- 81% English-only · Spanish 19%
Political lean MEDSL · Jones
- 2024 margin
- Solid R (+73.2) · D 13.1% · R 86.2%
- 2008→2024 swing
- -27.1pp toward R · 2008: -46.1pp · 2024: -73.2pp
- All cycles
- 2024: R+73.2 2020: R+69.1 2016: R+65.4 2012: R+54.5 2008: R+46.1
Not yet ingested
- Civics
- —
Market trends
- HPI YoY
- ▲ 4.13%
- Current HPI
- 148.5884
- Rent YoY
- —
- Metro
- —
- State GDP YoY
- ▲ 3.95%
- F500 in state
- 110
Industry mix (Fortune 500 HQ in TX)
| Industry | F500 HQs | Revenue |
|---|---|---|
| Energy | 16 | $1,198B |
|
||
| Technology | 5 | $198B |
|
||
| Engineering / Construction | 4 | $72B |
|
||
| Energy Services | 3 | $60B |
|
||
| Utilities | 3 | $41B |
|
||
| Healthcare | 2 | $330B |
|
||
Price history
1 event — show timeline
- 2026-05-21 Listed $199,900 NTREIS
Cash-flow waterfall
monthlySold comps — $/sqft
last 12 mo · ≤1 miLoading sold comps…