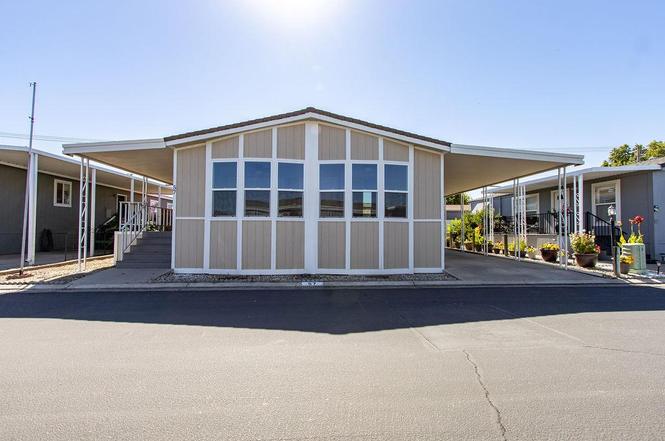
19960 American Ave #57 · Hilmar-Irwin, CA
Flood risk No data
- FEMA flood zone
- —
- Chance of flooding over 30 yrs
- —
- Est. flood insurance / yr
- —
Fire risk No data
- Est. fire insurance / yr
- —
Heat risk No data
- Hot days now (above threshold)
- —
- Hot days in 30 yrs
- —
Wind risk No data
- Chance of severe wind over 30 yrs
- —
Air-quality risk No data
- Unhealthy air days now
- —
- Unhealthy air days in 30 yrs
- —
Risk factors via First Street. Map © Google.
Why this score? — see what drove the B- grade
The composite is a weighted blend of 9 inputs, each scored 0–100. Each bar is that input's sub-score; the figure is the points it added to the 100-point composite (weight × sub-score).
- Cash flow +30.0/30.0
- 1% rule +10.0/10.0
- DSCR +10.0/10.0
- ARV discount +7.7/15.0
- Schools +3.3/10.0
- Rent growth +2.5/5.0
- Livability +2.5/5.0
- Condition / age +2.5/5.0
- Appreciation +0.0/10.0
$134,900
🖨 Deal sheet (PDF) 📄 Offer letter ✓ Due diligence
Listing remarks
Immaculate & move-in ready! New roof, fresh paint inside & out, new kitchen appliances, new wood flooring throughout. Spacious floorplan with 3 bedrooms and master bath that features soaking tub. Relaxing deck off master bedroom. .. Welcome home!
Key facts
- Relaxing deck
- New wood flooring
- New roof
Tags
Property features AI
Finance
- Other: Senior community; Address: 19960 American Ave #57, Hilmar, CA 95324 (space #57 in park)
- HOA & community: No homeowners association; Land lease: No (listed land lease amount present)
Exterior
- Parking: Covered parking
- Utilities: Individual electric meter; Individual gas meter; 220V in kitchen; Public water; Public sewer
- Home design: Manufactured home in park; Double wide; Updated / remodeled; Built in 1986; Wood skirting; Located in a senior community
- Construction: Shingle and shake roof; Manufactured home (Golden West HM manufacturer, Canterbury model)
- Exterior features: Backyard; Regular lot shape; Carport awning; Porch awning; Shed(s)
Interior
- Kitchen: Laminate countertops; Dishwasher; Disposal; Microwave; Free-standing electric range
- Bedrooms: 3 bedrooms
- Flooring: Tile; Wood
- Bathrooms: 2 full bathrooms; Double sinks; Tub and tub with shower over; Shower stall(s)
- Heating & cooling: Central heating; Central cooling; Gas water heater
- Interior features: Cathedral ceiling; Dual-pane partial windows; Covered deck / deck attached to the living area; Dining bar and formal dining area; Great room
- Laundry & utility: Inside laundry room; 220V in laundry; Electric hookup for laundry
Neighborhood map
What this means for you Summary
Snapshot
- This is a 3-bed/2.0-bath manufactured listed at $135k.
Deal economics
- At list price, monthly cash flow is $1k ($13k/yr) — positive.
- The deal already cash-flows at list — no discount required.
- Meets the 1% rule at list price ($3k rent vs $135k).
Location & tenants
- Location reads: area grade B — affects rentability + tenant quality, not the cash-flow math above.
- Hilmar Unified (rural): math 26% / reading 43% proficiency, ranked #890 of 1,400 in CA (top 64%) — families likely to look elsewhere, expect single-tenant / working-renter base with shorter leases.
- Zoned schools: Elim Elementary (943 students, 42% FRL); Hilmar Middle (504 students, 50% FRL); Hilmar High (math 27% / reading 62%, grade F, #434 of 1,170 statewide, top 39%, 693 students, 48% FRL) — zoned schools at 47% FRL track the district average.
- Market conditions: 15 active listings in the ZIP; 459 units permitted in Merced County in 2024 (0 in 5+ unit buildings).
Forward outlook
- Local home prices are declining (-3.0%/yr); year-one equity from $933 of loan paydown is wiped out by about $4k of value loss. Plan a longer hold.
- Merced County population projected at +12% by 2050 — modest demand growth; plan on rents tracking national, not racing it.
- At projected returns (-3.0% appreciation + 3.0% rent growth), your $38k cash investment doubles in ~4 years — after that, you're playing with house money.
Negotiation context
- Only 10 days on market — expect competitive offers; lowballing is unlikely to land.
Questions for the listing agent
- Is there a deadline driving the sale (1031 exchange, divorce, estate, relocation)? That informs how much negotiation room exists.
- What's the average days-on-market for RENTAL listings here right now (not sales)? A rising rental-DOM trend means longer vacancies and softer asking-rent achievability than the comps imply.
- What's the recent tenant-quality profile in this submarket — average credit score on applications, eviction rate, late-payment / NSF rate, and stable-employment percentage? A property-management company in the area should have these aggregated.
- How much new for-sale + rental construction is in the pipeline within 1–3 miles? Heavy new supply typically softens prices + rents 12–24 months out; constrained supply supports both.
Investment metrics
- 1% rule
- 1.90% ✓
- Cap rate
- 15.99%
- Cash-on-cash
- 34.62%
- DSCR
- 2.54
- GRM
- 4.4
CMA / ARV
- ARV (on-the-fly)
- $135,360
- Comps found
- 8
Show comp detail 8 sales within ~0.75 mi
| Address | Dist | Beds/Ba | Sqft | Sold | Price | $/sf | Match |
|---|---|---|---|---|---|---|---|
| 19667 American Ave #100 | 0.30mi | 2/2.0 (-1) | 1,440 (0%) | 7mo | $120,000 | $83 | 76 |
| 19960 American Ave #4 | 0.00mi | 2/2.0 (-1) | 1,248 (-13%) | 2mo | $200,000 | $160 | 71 |
| 19960 American Ave #31 | 0.00mi | 2/2.0 (-1) | 1,344 (-7%) | 16mo | $127,000 | $94 | 70 |
| 19960 American Ave #6 | 0.00mi | 2/2.0 (-1) | 1,344 (-7%) | 17mo | $103,000 | $77 | 70 |
| 19667 American Ave #88 | 0.30mi | 2/2.0 (-1) | 1,344 (-7%) | 1mo | $100,000 | $74 | 69 |
| 19667 American Ave #68 | 0.30mi | 3/2.0 | 1,344 (-7%) | 9mo | $126,000 | $94 | 67 |
| 19667 American Ave #72 | 0.30mi | 3/2.0 | 1,608 (+12%) | 12mo | $90,000 | $56 | 57 |
| 19667 American | 0.30mi | 2/2.0 (-1) | 1,344 (-7%) | 22mo | $140,000 | $104 | 52 |
Match score weights: distance 35% · size 25% · config 20% · recency 20%. Top-matched comps best support the ARV.
Projected returns pro-forma
-3.0% appreciation · 3.0% rent growth · sell at horizon
- IRR
- 30.1%
- Equity multiple
- 2.26×
- Total profit
- $47,586
- Equity at exit
- $20,114
- IRR
- 37.4%
- Equity multiple
- 4.47×
- Total profit
- $130,966
- Equity at exit
- $11,664
Cash invested: $37,772 (down + closing). Projections, not guarantees.
Landlord ↔ Tenant lean methodology
- Overall (STATE)
- 18 Strongly Tenant-Friendly
- State California
- 18 Strongly Tenant-Friendly · D+13
- County
- — inherits STATE
- City
- — inherits STATE
ZIP-level market 95324
- Active inventory
- 15
- Price-to-rent
- 4.4×
Monthly cashflow live
- Estimated rent
- $2,560 medium interval (Pro) →
- Mortgage (P&I)
- −$707
- Tax est. 1.5%
- −$169 /mo · $2,024/yr
- Insurance
- −$56
- HOA
- −$0
- Vacancy / Maint / Mgmt
- −$537
- Net cashflow
- $1,090
Break-even live
Sensitivity live
| Price | -10% $1,183 | -5% $1,136 | +0% $1,090 | +5% $1,043 | +10% $997 |
|---|---|---|---|---|---|
| Rent | -10% $888 | -5% $989 | +0% $1,090 | +5% $1,191 | +10% $1,292 |
| Rate | -1.0pp $1,158 | -0.5pp $1,124 | base $1,090 | +0.5pp $1,055 | +1.0pp $1,019 |
UW: 25.0% down · 7.5% · 30yr · 1.5% tax · 5.0% vac · 8.0% maint · 8.0% mgmt
Financing live
Cash to close
- Down payment
- $33,725
- Closing costs
- $4,047
- Reserves months
- —
- Total cash needed
- —
Loan-product check · same deal, 3 products live
Conventional
25% down · 7.5% · 30yr
- Down + closing
- —
- Monthly P&I
- —
- Monthly cashflow
- —
- DSCR
- —
- Eligible?
- —
Personal DTI + credit; lowest rate.
DSCR
20% down · 8.5% · 30yr
- Down + closing
- —
- Monthly P&I
- —
- Monthly cashflow
- —
- DSCR
- —
- Eligible?
- —
No personal income docs; deal must DSCR.
Hard money
10% down · 12.0% · 12mo
- Down + closing
- —
- Monthly P&I
- —
- Monthly cashflow
- —
- DSCR
- —
- Eligible?
- —
Short-term bridge; refi at stabilization.
Listing history 8 events
-
2026-06-22days on market $134,900 Active 10 DOM
-
2026-06-18days on market $134,900 Active 7 DOM
-
2026-06-17days on market $134,900 Active 6 DOM
-
2026-06-16days on market $134,900 Active 5 DOM
-
2026-06-15days on market $134,900 Active 4 DOM
-
2026-06-14days on market $134,900 Active 2 DOM
-
2026-06-13remarks 250-char remark
-
2026-06-13$134,900 Active 1 DOM
ⓘ Source: listings_history table (triggers on properties + properties_extension) + one-shot
backfill from property_details.listing_events for pre-trigger history.
Nearby sold comps map
Loading sold comps map…
Walkable amenities ~0.75 mi
Loading nearby amenities…
Taxation est. · year 1
- Rental income
- $30,714
- − Mortgage interest
- −$7,556
- − Property taxes
- −$2,024
- − Insurance
- −$674
- − Repairs & maintenance
- −$2,457
- − Management
- −$2,457
- − Depreciation
- −$3,924
- Taxable income
- $11,621
- Est. tax owed @ 24.0%
- −$2,789
- After-tax cash flow
- $10,288/yr
For passive investors: Depreciation is non-cash, so a rental often shows a tax loss while cash-flowing — sheltering income. Rental losses are passive: they offset passive income freely, and up to $25,000/yr can offset ordinary (W-2) income if you actively participate and your MAGI is under $100k (phasing out to $0 by $150k); unused losses carry forward. On sale, claimed depreciation is recaptured at up to 25%, and gains may owe capital-gains tax (a 1031 exchange can defer both). Figures are a year-1 estimate at your 24.0% rate — not tax advice; consult a CPA.
Schools (NCES district)
- District
- Hilmar Unified
- NCES district ID
- 0617220
- Math proficiency
- 26% ▲ 7.00%
- Reading proficiency
- 43% ▲ 8.00%
- Median HH income
- $52,781
- Composite
- 32.82/100
- National rank
- #10742
- State rank
- #890 of 1400 in CA
Livability — Hilmar-Irwin
No livability data for this city. (Only ~50 U.S. cities are tracked.)
Census & demographics
- Census place
- Hilmar-Irwin, CA
- Population (ZIP)
- 7,862
Population outlook (Merced County) Hauer SSP2
- Today (2025)
- 285,501 people
- By 2030
- 293,437 · +2.8%
- By 2040
- 308,808 · +8.2%
- By 2050
- 321,011 · +12.4%
- By 2075
- 338,497 · +18.6%
- By 2100
- 330,493 · +15.8%
Race, ethnicity, and origin ACS 2023
- Neighborhood character
- Majority White (64%)
- Race & ethnicity
- White 64% Hispanic / Latino 34% Two or more races 8%
- Hispanic origin (detail)
- Mexican 34%
- Common ancestry
- Russian 38% Portuguese 2% Arab 2%
- Foreign-born
- 23% · Canada
- Languages at home
- 60% English-only · Spanish 20% Other Indo-European 20%
Political lean MEDSL · Merced
- 2024 margin
- Toss-up / Even · D 46.5% · R 50.9% · Other 2.6%
- 2008→2024 swing
- -12.7pp toward R · 2008: 8.3pp · 2024: -4.4pp
- All cycles
- 2024: R+4.4 2020: D+10.6 2016: D+7.9 2012: D+5.4 2008: D+8.3
Not yet ingested
- Civics
- —
Market trends
- HPI YoY
- ▼ -172.29%
- Current HPI
- 227.2735
- Rent YoY
- —
- Metro
- —
- State GDP YoY
- ▲ 3.21%
- F500 in state
- 116
Industry mix (Fortune 500 HQ in CA)
| Industry | F500 HQs | Revenue |
|---|---|---|
| Technology | 27 | $1,492B |
|
||
| Financial Services | 3 | $174B |
|
||
| Retail | 3 | $44B |
|
||
| Insurance | 3 | $26B |
|
||
| Media / Entertainment | 2 | $115B |
|
||
| Pharmaceuticals / Biotech | 2 | $62B |
|
||
Property tax history
-0.9%/yrLatest (2020): $252 · +0.9% YoY. Source: county tax records.
Cash-flow waterfall
monthlySold comps — $/sqft
last 12 mo · ≤1 miLoading sold comps…