 🏗️ New Construction
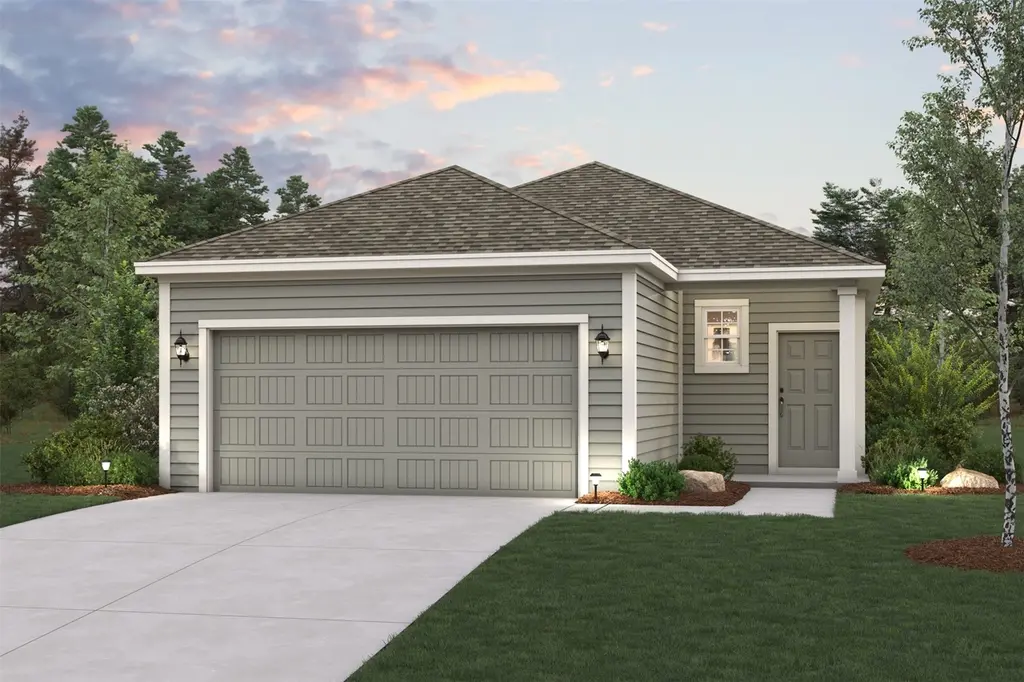
17817 Lionheart Rd · Deerwood, TX
Flood risk No data
- FEMA flood zone
- —
- Chance of flooding over 30 yrs
- —
- Est. flood insurance / yr
- —
Fire risk No data
- Est. fire insurance / yr
- —
Heat risk No data
- Hot days now (above threshold)
- —
- Hot days in 30 yrs
- —
Wind risk No data
- Chance of severe wind over 30 yrs
- —
Air-quality risk No data
- Unhealthy air days now
- —
- Unhealthy air days in 30 yrs
- —
Risk factors via First Street. Map © Google.
Why this score? — see what drove the C- grade
The composite is a weighted blend of 9 inputs, each scored 0–100. Each bar is that input's sub-score; the figure is the points it added to the 100-point composite (weight × sub-score).
- Cash flow +20.5/30.0
- ARV discount +7.5/15.0
- DSCR +6.5/10.0
- Schools +5.1/10.0
- 1% rule +4.4/10.0
- Rent growth +2.5/5.0
- Livability +2.5/5.0
- Condition / age +2.5/5.0
- Appreciation +0.0/10.0
$199,900
🖨 Deal sheet (PDF) 📄 Offer letter ✓ Due diligence
Listing remarks
The attractive Aspen plan centers around a large open kitchen, complete with an island and a built-in pantry. An airy great room—ideal for relaxing and entertaining—is steps away, as is a dining area. There are three spacious bedrooms, including a primary suite with a walk-in closet and a private bath with dual vanities and a walk-in shower. Home complete 6/30/26. Discover new homes for sale in Conroe, TX at Sherwood Glen! Located 40 miles north of Houston, this community combines small-town charm with easy access to the city’s employment and entertainment hotspots. Offering seven one- and two-story floor plans with modern layouts and versatile design, Sherwood Glen has
Key facts
- Built-in pantry
- Walk-in closet
- Private bath
Tags
Property features AI
Finance
- HOA & community: Sherwood Glen POA with an annual fee of $600; Community features include curbs
Exterior
- Parking: Attached 2-car garage
- Security: Prewired for security; Smoke detectors
- Utilities: Public water; Public sewer
- Home design: Residential property; Under construction (new construction); Slab foundation
- Construction: Built in 2026; Cement siding; Composition roof
- Exterior features: Private yard; Concrete road surface; Located in a subdivision
Interior
- Kitchen: Dishwasher; Electric range; Disposal; Microwave
- Bedrooms: Primary bedroom on first floor (approx. 13'11" x 12'3"); Bedroom on first floor (approx. 10'3" x 10'2.5"); Bedroom on first floor (approx. 10' x 11'7"); Three total bedrooms
- Flooring: Carpet
- Bathrooms: Two full bathrooms
- Heating & cooling: Central electric heating; Central air conditioning
- Interior features: Breakfast bar; Granite counters; High ceilings; Kitchen/family room combo; Pantry; Separate shower; Tub with shower; Window treatments; Ceiling fans; Programmable thermostat; Low emissivity windows; Window coverings
- Laundry & utility: Washer hookup; Electric dryer hookup
Neighborhood map
What this means for you Summary
Snapshot
- This is a 3-bed/2.0-bath land listed at $200k.
Deal economics
- At list price, monthly cash flow is $264 ($3k/yr) — positive.
- The deal already cash-flows at list — no discount required.
- To meet the 1% rule (rent ≥ 1% of price), the offer needs to be $188k (6.0% below list).
- Recommended offer: $188k (6.0% below list) — sets the bar for 1% rule.
- Cap rate 7.9% vs local median 5.4% in Deerwood — top-decile yield for the area; either an underpriced asset or a hidden risk that comps aren't pricing in. Stress-test before assuming the spread holds.
Location & tenants
- Location reads: area grade C — affects rentability + tenant quality, not the cash-flow math above.
- Conroe ISD (other): math 57% / reading 57% proficiency, ranked #69 of 826 in TX (top 8%) — acceptable for families but not a draw, mixed tenant base, ~2y average lease.
- Zoned schools: Creighton El (math 31% / reading 27%, grade F, #2,668 of 4,322 statewide, top 63%, 940 students, 92% FRL); Moorhead J H (math 35% / reading 42%, grade F, #704 of 1,662 statewide, top 43%, 1,391 students, 82% FRL); Conroe H S (math 32% / reading 51%, grade F, #767 of 1,632 statewide, top 47%, 4,915 students, 61% FRL) — zoned schools average 78% FRL vs 34% district-wide (44 pts higher); higher-poverty schools than district average — tighter screening recommended.
- Zoned-school proficiency averages 36% at this address vs 57% district-wide (-21 pts) — the specific schools serving this property underperform the Conroe ISD average; the district grade overstates school quality for this exact location.
- Market conditions: 416 active listings in the ZIP; 4 comparable units currently listed for rent nearby; rentals lingering (median 46d on market — plan ~5-8 weeks vacancy on turnover, expect pricing pressure); 50% of comp listings sitting > 30 days — soft ceiling on asking rent; solid renter incomes; 13,259 units permitted in Montgomery County in 2024 (1,402 in 5+ unit buildings).
Forward outlook
- Local home prices are declining (-3.0%/yr); year-one equity from $1k of loan paydown is wiped out by about $6k of value loss. Plan a longer hold.
- Montgomery County population projected at +65% by 2050 — long-run rental-demand tailwind backs the buy-and-hold thesis.
Negotiation context
- It's been on market 26 days — a 2% lower offer ($197k) is reasonable based on typical stale-listing flexibility.
Questions for the listing agent
- What does the HOA fee cover, when was the last increase, and are there any pending special assessments or reserve-fund shortfalls?
- Is there a deadline driving the sale (1031 exchange, divorce, estate, relocation)? That informs how much negotiation room exists.
- What's the average days-on-market for RENTAL listings here right now (not sales)? A rising rental-DOM trend means longer vacancies and softer asking-rent achievability than the comps imply.
- What's the recent tenant-quality profile in this submarket — average credit score on applications, eviction rate, late-payment / NSF rate, and stable-employment percentage? A property-management company in the area should have these aggregated.
- How much new for-sale + rental construction is in the pipeline within 1–3 miles? Heavy new supply typically softens prices + rents 12–24 months out; constrained supply supports both.
Investment metrics
- 1% rule
- 0.94% ✗
- Cap rate
- 7.88%
- Cash-on-cash
- 5.66%
- DSCR
- 1.25
- GRM
- 8.9
CMA / ARV
No comps found within radius.
Projected returns pro-forma
-3.0% appreciation · 3.0% rent growth · sell at horizon
- IRR
- -7.6%
- Equity multiple
- 0.72×
- Total profit
- $-15,659
- Equity at exit
- $29,806
- IRR
- 1.9%
- Equity multiple
- 1.14×
- Total profit
- $7,716
- Equity at exit
- $17,284
Cash invested: $55,972 (down + closing). Projections, not guarantees.
Landlord ↔ Tenant lean methodology
- Overall (STATE)
- 87 Strongly Landlord-Friendly
- State Texas
- 87 Strongly Landlord-Friendly · R+5
- County
- — inherits STATE
- City
- — inherits STATE
ZIP-level market 77306
- Home prices YoY
- -4.1%
- Active inventory
- 416
- Price-to-rent
- 8.9×
Monthly cashflow live
- Estimated rent
- $1,879 medium interval (Pro) →
- Mortgage (P&I)
- −$1,048
- Tax from tax record
- −$39 /mo · $470/yr
- Insurance
- −$83
- HOA
- −$50
- Vacancy / Maint / Mgmt
- −$395
- Net cashflow
- $264
Break-even live
Sensitivity live
| Price | -10% $377 | -5% $320 | +0% $264 | +5% $207 | +10% $151 |
|---|---|---|---|---|---|
| Rent | -10% $115 | -5% $190 | +0% $264 | +5% $338 | +10% $412 |
| Rate | -1.0pp $365 | -0.5pp $315 | base $264 | +0.5pp $212 | +1.0pp $159 |
UW: 25.0% down · 7.5% · 30yr · 1.5% tax · 5.0% vac · 8.0% maint · 8.0% mgmt
Financing live
Cash to close
- Down payment
- $49,975
- Closing costs
- $5,997
- Reserves months
- —
- Total cash needed
- —
Loan-product check · same deal, 3 products live
Conventional
25% down · 7.5% · 30yr
- Down + closing
- —
- Monthly P&I
- —
- Monthly cashflow
- —
- DSCR
- —
- Eligible?
- —
Personal DTI + credit; lowest rate.
DSCR
20% down · 8.5% · 30yr
- Down + closing
- —
- Monthly P&I
- —
- Monthly cashflow
- —
- DSCR
- —
- Eligible?
- —
No personal income docs; deal must DSCR.
Hard money
10% down · 12.0% · 12mo
- Down + closing
- —
- Monthly P&I
- —
- Monthly cashflow
- —
- DSCR
- —
- Eligible?
- —
Short-term bridge; refi at stabilization.
Rent comps 4 comps
| Address | Beds | Baths | Sqft | Rent | $/sqft | DOM | Units | Dist |
|---|---|---|---|---|---|---|---|---|
| 2140 Cedar Bend Dr Conroe, TX | 4.0 | 3.0 | 1871 | $1,995 | $1.07 | 12d | 1 | 0.39mi |
| 308 Kinsman Rd Cleveland, TX | 3.0 | 1.5 | 1400 | $1,650 | $1.18 | 9d | 1 | 1.20mi |
| 308 Kinsman Rd Cleveland, TX | 3.0 | 1.5 | 1400 | $1,650 | $1.18 | 45d | 1 | 1.20mi |
| 6621 W Forest Rd Conroe, TX | 3.0 | 2.0 | 952 | $1,450 | $1.52 | 45d | 1 | 1.24mi |
HOA detail
- Monthly dues
- $50 · $600/yr
Listing history 15 events
-
2026-06-21days on market $199,900 Active 26 DOM
-
2026-06-18days on market $199,900 Active 23 DOM
-
2026-06-17days on market $199,900 Active 22 DOM
-
2026-06-16days on market $199,900 Active 21 DOM
-
2026-06-15days on market $199,900 Active 20 DOM
-
2026-06-13days on market $199,900 Active 18 DOM
-
2026-06-09days on market $199,900 Active 14 DOM
-
2026-06-08days on market $199,900 Active 13 DOM
-
2026-06-07days on market $199,900 Active 12 DOM
-
2026-06-04days on market $199,900 Active 9 DOM
-
2026-06-03days on market $199,900 Active 8 DOM
-
2026-06-02days on market $199,900 Active 7 DOM
-
2026-06-01days on market $199,900 Active 6 DOM
-
2026-05-31days on market $199,900 Active 5 DOM
-
2026-05-26$199,900 Active
ⓘ Source: listings_history table (triggers on properties + properties_extension) + one-shot
backfill from property_details.listing_events for pre-trigger history.
Tax reassessment forecast TX · Resets to sale price
- Current annual tax
- $470 · $39/mo
- Projected year-2 tax
- $3,658 · $305/mo
- Expected delta
- +$3,188/yr (+$266/mo · 678.3%)
ⓘ Screening estimate from a state-policy table — verify with the county assessor before closing.
Nearby sold comps map
Loading sold comps map…
Walkable amenities ~0.75 mi
Loading nearby amenities…
Taxation est. · year 1
- Rental income
- $22,551
- − Mortgage interest
- −$11,198
- − Property taxes
- −$470
- − Insurance
- −$1,000
- − Repairs & maintenance
- −$1,804
- − Management
- −$1,804
- − HOA
- −$600
- − Depreciation
- −$5,815
- Taxable loss
- −$140
- Est. tax savings @ 24.0%
- +$34
- After-tax cash flow
- $3,200/yr
For passive investors: Depreciation is non-cash, so a rental often shows a tax loss while cash-flowing — sheltering income. Rental losses are passive: they offset passive income freely, and up to $25,000/yr can offset ordinary (W-2) income if you actively participate and your MAGI is under $100k (phasing out to $0 by $150k); unused losses carry forward. On sale, claimed depreciation is recaptured at up to 25%, and gains may owe capital-gains tax (a 1031 exchange can defer both). Figures are a year-1 estimate at your 24.0% rate — not tax advice; consult a CPA.
Schools (NCES district)
- District
- Conroe ISD
- NCES district ID
- 4815000
- Math proficiency
- 57% ▼ -6.00%
- Reading proficiency
- 57% ▼ -1.00%
- Median HH income
- $71,541
- Composite
- 50.65/100
- National rank
- #1833
- State rank
- #69 of 826 in TX
Livability — Deerwood
No livability data for this city. (Only ~50 U.S. cities are tracked.)
Census & demographics
- County
- Montgomery County · 663,713 people
- Metro
- Houston-The Woodlands-Sugar Land, TX
- Population (ZIP)
- 18,086
- Household income
- $76,257
- Rent vs Own
- Severe rent burden
- 231.0
Population outlook (Montgomery County) Hauer SSP2
- Today (2025)
- 713,896 people
- By 2030
- 805,263 · +12.8%
- By 2040
- 992,708 · +39.1%
- By 2050
- 1,179,590 · +65.2%
- By 2075
- 1,628,084 · +128.1%
- By 2100
- 1,937,880 · +171.5%
Race, ethnicity, and origin ACS 2023
- Neighborhood character
- Majority Hispanic (55%)
- Race & ethnicity
- Hispanic / Latino 55% White 41% Two or more races 11% Black 2%
- Hispanic origin (detail)
- Mexican 51%
- Common ancestry
- Iranian 1% Slovak 1% Lithuanian 1%
- Foreign-born
- 21% · Canada
- Languages at home
- 53% English-only · Spanish 45% German/W. Germanic 1%
Political lean MEDSL · Montgomery
- 2024 margin
- Solid R (+45.5) · D 26.8% · R 72.3%
- 2008→2024 swing
- +7.2pp toward D · 2008: -52.7pp · 2024: -45.5pp
- All cycles
- 2024: R+45.5 2020: R+43.8 2016: R+51.4 2012: R+60.7 2008: R+52.7
Not yet ingested
- Civics
- —
Market trends
- HPI YoY
- ▼ -13.02%
- Current HPI
- 306.3801
- Rent YoY
- —
- Metro
- Houston-The Woodlands-Sugar Land, TX
- State GDP YoY
- ▲ 3.95%
- F500 in state
- 110
Industry mix (Fortune 500 HQ in TX)
| Industry | F500 HQs | Revenue |
|---|---|---|
| Energy | 16 | $1,198B |
|
||
| Technology | 5 | $198B |
|
||
| Engineering / Construction | 4 | $72B |
|
||
| Energy Services | 3 | $60B |
|
||
| Utilities | 3 | $41B |
|
||
| Healthcare | 2 | $330B |
|
||
Price history
1 event — show timeline
- 2026-05-26 Listed $199,900 HARMLS
Property tax history
-30.3%/yrLatest (2025): $470 · -30.3% YoY. Source: county tax records.
Cash-flow waterfall
monthlySold comps — $/sqft
last 12 mo · ≤1 miLoading sold comps…