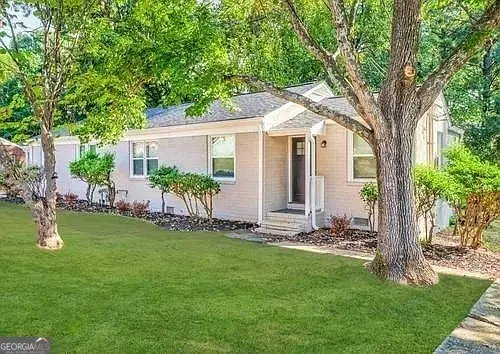
1770 Cahoon St · Atlanta, GA
Flood risk 1/10 · Minimal
- FEMA flood zone
- X (unshaded)
- Chance of flooding over 30 yrs
- 0.0%
- Est. flood insurance / yr
- $473 – $860
Fire risk 1/10 · Minimal
- Est. fire insurance / yr
- $963 – $1,789
Heat risk 5/10 · Moderate
- Hot days now (above 104°F)
- 7 days/yr
- Hot days in 30 yrs
- 17 days/yr
Wind risk 6/10 · Moderate
- Chance of severe wind over 30 yrs
- 27.0%
Air-quality risk 4/10 · Minor
- Unhealthy air days now
- 4 days/yr
- Unhealthy air days in 30 yrs
- 6 days/yr
Risk factors via First Street. Map © Google.
Why this score? — see what drove the B- grade
The composite is a weighted blend of 9 inputs, each scored 0–100. Each bar is that input's sub-score; the figure is the points it added to the 100-point composite (weight × sub-score).
- Cash flow +23.8/30.0
- ARV discount +15.0/15.0
- DSCR +7.6/10.0
- 1% rule +6.6/10.0
- Livability +4.2/5.0
- Rent growth +3.2/5.0
- Schools +2.7/10.0
- Condition / age +2.5/5.0
- Appreciation +0.0/10.0
$149,000
🖨 Deal sheet 📄 Offer letter ✓ Due diligence
Listing remarks MLS
GREAT INVESTMENT OPPORTUNITY OR PERFECT FOR THE 1ST TIME HOMEBUYER. HOME HAS OPEN FLOOR PLAN. HOME IS A FANNIE MAE HOMEPATH PROPERTY.
Key facts
- Level lot
- Updated flooring
- Granite countertops
Tags
Property features AI
Finance
- Other: Address: 1770 Cahoon St, Atlanta, GA 30331; Subdivision: Perkerson Woods
- Financial info: No financial details or investor-specific information provided
- HOA & community: No HOA
Exterior
- Parking: Open parking; Parking pad
- Security: No security features listed
- Utilities: Private water; Public sewer; Cable available; Sewer connected
- Home design: Single-family residential house; One story; Resale property
- Construction: Built in 1950; Brick construction; Composition roof; Slab foundation
- Exterior features: No lot features listed; Near public transport, walking distance to schools, near shopping
Interior
- Kitchen: No kitchen appliance details provided
- Bedrooms: 3 bedrooms on the main level
- Flooring: Other flooring
- Bathrooms: 1 full bathroom on the main level
- Heating & cooling: Central heating and other heating; Other cooling
- Interior features: One-level layout; Family room; No basement; Public records list 900 living area
- Laundry & utility: Laundry features: Other
Neighborhood map
What this means for you Summary
Snapshot
- This is a 3-bed/1.0-bath single-family listed at $149k.
Deal economics
- At list price, monthly cash flow is $285 ($3k/yr) — positive.
- The deal already cash-flows at list — no discount required.
- Meets the 1% rule at list price ($2k rent vs $149k).
- Recommended offer: $145k (3.0% below list) — sets the bar for market timing.
- Cap rate 8.6% vs local median 3.1% in Atlanta — top-decile yield for the area; either an underpriced asset or a hidden risk that comps aren't pricing in. Stress-test before assuming the spread holds.
Location & tenants
- Location reads 83/100 on livability (#6 in GA, #919 nationally) — a professional / high-income tenant draw. Strengths: amenities A+, commute A+, housing A+; Watch: cost of living C-.
- Atlanta Public Schools (urban): math 28% / reading 35% proficiency, ranked #80 of 174 in GA (top 46%) — families likely to look elsewhere, expect single-tenant / working-renter base with shorter leases; 71% free/reduced lunch — lower-income household profile, screen leases tightly.
- Zoned schools: T. J. Perkerson Elementary School (math 8% / reading 12%, grade F, #1,092 of 1,228 statewide, top 91%, 354 students, 100% FRL); Sylvan Hills Middle School (math 5% / reading 12%, grade F, #439 of 470 statewide, top 94%, 445 students, 100% FRL); Carver High School (math 24%, 445 students, 100% FRL) — zoned schools average 100% FRL vs 71% district-wide (29 pts higher); higher-poverty schools than district average — tighter screening recommended.
- Zoned-school proficiency averages 9% at this address vs 32% district-wide (-22 pts) — the specific schools serving this property underperform the Atlanta Public Schools average; the district grade overstates school quality for this exact location.
- Market conditions: Rents rising (+2.6%/yr); 483 active listings in the ZIP; 30 comparable units currently listed for rent nearby; rentals at typical pace (median 24d on market — plan ~3-4 weeks tenant-placement turnaround); 11,565 units permitted in Fulton County in 2024 (8,159 in 5+ unit buildings).
Forward outlook
- Local home prices are declining (-3.0%/yr); year-one equity from $1k of loan paydown is wiped out by about $4k of value loss. Plan a longer hold.
- Fulton County population projected at +38% by 2050 — long-run rental-demand tailwind backs the buy-and-hold thesis.
Negotiation context
- It's been on market 56 days — a 3% lower offer ($145k) is reasonable based on typical stale-listing flexibility.
- 2 sale attempts since 15y ago; this cycle's ask has dropped $16k (10%) from the opening price — seller is motivated, your offer sets the floor, not the list.
- Current owner paid $61k; list at $149k implies a 144% gain — meaningful room to come down on a strong offer.
Risks & watch-outs
- Watch-outs: built in 1950 — expect roof / HVAC / electrical / plumbing capex.
- Climate carrying-cost: major wind risk, 27% chance of damaging wind over 30y; extreme-heat days projected 7→17/yr by 2055 (HVAC capex compounding) — expect insurance premiums to compound above CPI over the hold.
Questions for the listing agent
- It's been on market 56 days. Have you received any prior offers? Is the seller open to a 3% concession, seller financing, or rate buy-down credit?
- Built in 1950 — when were the roof, HVAC, electrical panel, plumbing, and water heater last replaced?
- Is there a deadline driving the sale (1031 exchange, divorce, estate, relocation)? That informs how much negotiation room exists.
- What's the average days-on-market for RENTAL listings here right now (not sales)? A rising rental-DOM trend means longer vacancies and softer asking-rent achievability than the comps imply.
- What's the recent tenant-quality profile in this submarket — average credit score on applications, eviction rate, late-payment / NSF rate, and stable-employment percentage? A property-management company in the area should have these aggregated.
- How much new for-sale + rental construction is in the pipeline within 1–3 miles? Heavy new supply typically softens prices + rents 12–24 months out; constrained supply supports both.
Investment metrics
- 1% rule
- 1.16% ✓
- Cap rate
- 8.59%
- Cash-on-cash
- 8.20%
- DSCR
- 1.36
- GRM
- 7.2
CMA / ARV
- ARV (median comp)
- $227,638
- List price
- $149,000
- Delta
- -34.55%
- Verdict
- UNDERPRICED
- Comps
- 20 within 1.0 mi
Show comp detail 10 sales within ~0.75 mi
| Address | Dist | Beds/Ba | Sqft | Sold | Price | $/sf | Match |
|---|---|---|---|---|---|---|---|
| 1750 Lisbon Dr SW | 0.07mi | 3/2.0 | 1,012 (+12%) | 4mo | $132,500 | $131 | 69 |
| 742 Casplan St SW | 0.14mi | 3/1.0 | 962 (+7%) | 21mo | $225,000 | $234 | 65 |
| 1610 Brewer Blvd | 0.41mi | 2/1.0 (-1) | 1,001 (+11%) | 1mo | $274,000 | $274 | 57 |
| 1787 Langston Ave SW | 0.61mi | 2/1.0 (-1) | 928 (+3%) | 9mo | $320,000 | $345 | 54 |
| 1696 Langston Ave SW | 0.66mi | 2/1.0 (-1) | 825 (-8%) | 6mo | $150,000 | $182 | 45 |
| 1682 Langston Ave | 0.67mi | 2/1.0 (-1) | 904 (+0%) | 22mo | $225,000 | $249 | 45 |
| 461 Deckner Ave SW | 0.69mi | 2/1.0 (-1) | 975 (+8%) | 13mo | $270,000 | $277 | 38 |
| 1531 Belmont Ave SW | 0.40mi | 3/2.5 | 1,014 (+13%) | 20mo | $299,900 | $296 | 37 |
| 2077 Perkerson Rd | 0.73mi | 2/1.5 (-1) | 825 (-8%) | 13mo | $150,000 | $182 | 34 |
| 2082 Perkerson Rd SW | 0.71mi | 2/1.5 (-1) | 800 (-11%) | 13mo | $250,000 | $313 | 31 |
Match score weights: distance 35% · size 25% · config 20% · recency 20%. Top-matched comps best support the ARV.
Projected returns pro-forma
-3.0% appreciation · 2.63% rent growth · sell at horizon
- IRR
- -4.2%
- Equity multiple
- 0.84×
- Total profit
- $-6,578
- Equity at exit
- $22,216
- IRR
- 5.0%
- Equity multiple
- 1.37×
- Total profit
- $15,263
- Equity at exit
- $12,883
Cash invested: $41,720 (down + closing). Projections, not guarantees.
Landlord ↔ Tenant lean methodology
- Overall (STATE)
- 90 Strongly Landlord-Friendly
- State Georgia
- 90 Strongly Landlord-Friendly · R+3
- County
- — inherits STATE
- City
- — inherits STATE
ZIP-level market 30331
- Home prices YoY
- -34.2%
- Rents YoY
- 2.6%
- Active inventory
- 483
- Price-to-rent
- 7.2×
Monthly cashflow live
- Estimated rent
- $1,726 high interval (Pro) →
- Mortgage (P&I)
- −$781
- Tax from tax record
- −$235 /mo · $2,824/yr
- Insurance
- −$62
- HOA
- −$0
- Vacancy / Maint / Mgmt
- −$363
- Net cashflow
- $285
Break-even live
UW: 25.0% down · 7.5% · 30yr · 1.5% tax · 5.0% vac · 8.0% maint · 8.0% mgmt
Financing live
Cash to close
- Down payment
- $37,250
- Closing costs
- $4,470
- Reserves months
- —
- Total cash needed
- —
Loan-product check · same deal, 3 products live
Conventional
25% down · 7.5% · 30yr
- Down + closing
- —
- Monthly P&I
- —
- Monthly cashflow
- —
- DSCR
- —
- Eligible?
- —
Personal DTI + credit; lowest rate.
DSCR
20% down · 8.5% · 30yr
- Down + closing
- —
- Monthly P&I
- —
- Monthly cashflow
- —
- DSCR
- —
- Eligible?
- —
No personal income docs; deal must DSCR.
Hard money
10% down · 12.0% · 12mo
- Down + closing
- —
- Monthly P&I
- —
- Monthly cashflow
- —
- DSCR
- —
- Eligible?
- —
Short-term bridge; refi at stabilization.
Rent comps 30 comps
| Address | Beds | Baths | Sqft | Rent | $/sqft | DOM | Units | Dist |
|---|---|---|---|---|---|---|---|---|
| 1780 Cahoon St SW Atlanta, GA | 2.0 | 1.0 | 700 | $1,100 | $1.57 | 24d | 1 | 0.08mi |
| 1782 Cahoon St SW Atlanta, GA | 2.0 | 1.0 | 700 | $1,100 | $1.57 | 24d | 1 | 0.08mi |
| 1734 Cahoon St SW Atlanta, GA | 3.0 | 1.0 | 950 | $1,800 | $1.89 | 24d | 1 | 0.13mi |
| 1788 Broadwell St SW Atlanta, GA | 2.0 | 2.0 | 1017 | $1,850 | $1.82 | 24d | 1 | 0.24mi |
| 1534 Beatie Ave SW Atlanta, GA | 3.0 | 2.0 | 1050 | $2,050 | $1.95 | 24d | 1 | 0.37mi |
| 1777 Bond Dr SW Atlanta, GA | 4.0 | 1.5 | 1043 | $1,999 | $1.92 | 24d | 1 | 0.50mi |
| 2000 Rambling Ln Atlanta, GA | 1.0–3.0 | 1.0–2.0 | 1082 | $1,514 | $1.40 | 1d | 8 | 0.63mi |
| 1729 Evans Dr SW Unit B Atlanta, GA | 2.0 | 1.5 | 1000 | $1,500 | $1.50 | 24d | 1 | 0.74mi |
| 1026 Astor Ave SW Atlanta, GA | 3.0 | 2.0 | 1116 | $2,500 | $2.24 | 24d | 1 | 0.79mi |
| 200 Guerin Rd Holly Springs, NC | 2.0–3.0 | 1.0–1.5 | 947 | $1,349 | $1.42 | 21d | 1 | 0.81mi |
| 825 Erin Ave SW Atlanta, GA | 2.0 | 1.0 | 776 | $3,000 | $3.87 | 24d | 1 | 0.82mi |
| 1483 Arthur Langford Jr Pl SW Atlanta, GA | 1.0–2.0 | 1.0 | 825 | $900 | $1.09 | 24d | 7 | 0.84mi |
| 518 Erin Ave SW Atlanta, GA | 2.0 | 1.0 | 1075 | $2,500 | $2.33 | 17d | 1 | 0.87mi |
| 1246 Allene Ave SW Atlanta, GA | 2.0 | 1.0–2.0 | 896 | $2,110 | $2.35 | 1d | 23 | 0.88mi |
| 1180 Sims St SW Atlanta, GA | 2.0 | 1.0 | 772 | $1,100 | $1.42 | 24d | 1 | 1.11mi |
| 1187 McDaniel St SW Unit B Atlanta, GA | 2.0 | 1.0 | 1038 | $1,025 | $0.99 | 11d | 1 | 1.12mi |
| 745 Yale Pl SW Atlanta, GA | 3.0 | 1.0 | 1048 | $2,200 | $2.10 | 24d | 1 | 1.13mi |
| 1133 Mayland Cir SW Atlanta, GA | 3.0 | 2.0 | 1120 | $3,600 | $3.21 | 24d | 1 | 1.14mi |
| 600 Mayland Ave SW Atlanta, GA | 3.0 | 2.0 | 1100 | $2,300 | $2.09 | 24d | 1 | 1.16mi |
| 1226 Byewood Ln SW Unit B Atlanta, GA | 2.0 | 2.0 | 831 | $1,950 | $2.35 | 24d | 1 | 1.24mi |
| 1250 Byewood Ln SW Atlanta, GA | 2.0 | 2.0 | 1100 | $2,150 | $1.95 | 24d | 1 | 1.27mi |
| 174 Moury Ave SW Atlanta, GA | 1.0–3.0 | 1.0–2.0 | 926 | $1,728 | $1.87 | 2d | 6 | 1.28mi |
| 2197 Polar Rock Pl SW Atlanta, GA | 3.0 | 2.5 | 1000 | $2,700 | $2.70 | 20d | 1 | 1.36mi |
| 1361 Byrere Ter SW Unit 2 Atlanta, GA | 2.0 | 1.0 | 836 | $1,299 | $1.55 | 24d | 1 | 1.38mi |
| 73 Polar Rock Rd SW Atlanta, GA | 3.0 | 1.0 | 1098 | $1,850 | $1.68 | 10d | 1 | 1.40mi |
| 52 Claire Dr SE Atlanta, GA | 2.0 | 2.0 | 800 | $1,750 | $2.19 | 18d | 1 | 1.42mi |
| 2268 Polar Rock Pl SW Atlanta, GA | 3.0 | 1.0 | 925 | $1,575 | $1.70 | 24d | 1 | 1.46mi |
| 1305 Clermont Ave Atlanta, GA | 2.0 | 2.0 | 1000 | $1,750 | $1.75 | 24d | 1 | 1.48mi |
| 2145 Macon Dr SW Atlanta, GA | 3.0 | 1.0 | 1059 | $1,450 | $1.37 | 24d | 1 | 1.48mi |
| 1291 Lorenzo Dr SW Unit 1 Atlanta, GA | 3.0 | 1.0 | 1100 | $1,825 | $1.66 | 14d | 1 | 1.50mi |
Listing history 26 events
-
2026-06-18days on market $149,000 Active 56 DOM
-
2026-06-17days on market $149,000 Active 55 DOM
-
2026-06-16days on market $149,000 Active 54 DOM
-
2026-06-15days on market $149,000 Active 53 DOM
-
2026-06-13days on market $149,000 Active 51 DOM
-
2026-06-13days on market $149,000 Active 50 DOM
-
2026-06-09days on market $149,000 Active 47 DOM
-
2026-06-08days on market $149,000 Active 46 DOM
-
2026-06-07days on market $149,000 Active 45 DOM
-
2026-06-04days on market $149,000 Active 42 DOM
-
2026-06-03days on market $149,000 Active 41 DOM
-
2026-06-02days on market $149,000 Active 40 DOM
-
2026-06-01days on market $149,000 Active 39 DOM
-
2026-05-31days on market $149,000 Active 38 DOM
-
2026-05-07price $156,800 259-char remark
-
2026-04-23$165,000 New 259-char remark
-
2019-03-20soldstatus $61,000
-
2019-03-14soldstatus $58,000
-
2014-10-28price $4,500 133-char remark
Show marketing remark (133 chars)
GREAT INVESTMENT OPPORTUNITY OR PERFECT FOR THE 1ST TIME HOMEBUYER. HOME HAS OPEN FLOOR PLAN. HOME IS A FANNIE MAE HOMEPATH PROPERTY.
-
2012-01-24historical 133-char remark
Show marketing remark (133 chars)
GREAT INVESTMENT OPPORTUNITY OR PERFECT FOR THE 1ST TIME HOMEBUYER. HOME HAS OPEN FLOOR PLAN. HOME IS A FANNIE MAE HOMEPATH PROPERTY.
-
2012-01-20soldstatus $4,500 Sold 133-char remark
Show marketing remark (133 chars)
GREAT INVESTMENT OPPORTUNITY OR PERFECT FOR THE 1ST TIME HOMEBUYER. HOME HAS OPEN FLOOR PLAN. HOME IS A FANNIE MAE HOMEPATH PROPERTY.
-
2012-01-11price $5,400 133-char remark
Show marketing remark (133 chars)
GREAT INVESTMENT OPPORTUNITY OR PERFECT FOR THE 1ST TIME HOMEBUYER. HOME HAS OPEN FLOOR PLAN. HOME IS A FANNIE MAE HOMEPATH PROPERTY.
-
2011-12-21price $5,400 Reduced 133-char remark
Show marketing remark (133 chars)
GREAT INVESTMENT OPPORTUNITY OR PERFECT FOR THE 1ST TIME HOMEBUYER. HOME HAS OPEN FLOOR PLAN. HOME IS A FANNIE MAE HOMEPATH PROPERTY.
-
2011-12-18$7,550 New 133-char remark
Show marketing remark (133 chars)
GREAT INVESTMENT OPPORTUNITY OR PERFECT FOR THE 1ST TIME HOMEBUYER. HOME HAS OPEN FLOOR PLAN. HOME IS A FANNIE MAE HOMEPATH PROPERTY.
-
1994-05-19soldstatus $28,700
-
1984-03-06soldstatus $33,500
ⓘ Source: listings_history table (triggers on properties + properties_extension) + one-shot
backfill from property_details.listing_events for pre-trigger history.
Tax reassessment forecast GA · Resets to sale price
- Current annual tax
- $2,824 · $235/mo
- Projected year-2 tax
- $2,824 · $235/mo
- Expected delta
- $0/yr ($0/mo · 0.0%)
ⓘ Screening estimate from a state-policy table — verify with the county assessor before closing.
Climate risk First Street
- Flood 1/10 Low FEMA zone X (unshaded) · 0% chance over 30 yrs
- Wildfire 1/10 Low
- Heat 5/10 Major 7 d/yr ≥104°F today · 17 d/yr by 30 yrs out
- Wind 6/10 Major 27% chance of damaging wind over 30 yrs
- Air quality 4/10 Moderate 4 unhealthy d/yr today · 6 by 30 yrs out
Nearby sold comps map
Loading sold comps map…
Walkable amenities ~0.75 mi
Loading nearby amenities…
Taxation est. · year 1
- Rental income
- $20,716
- − Mortgage interest
- −$8,346
- − Property taxes
- −$2,824
- − Insurance
- −$745
- − Repairs & maintenance
- −$1,657
- − Management
- −$1,657
- − Depreciation
- −$4,335
- Taxable income
- $1,151
- Est. tax owed @ 24.0%
- −$276
- After-tax cash flow
- $3,143/yr
For passive investors: Depreciation is non-cash, so a rental often shows a tax loss while cash-flowing — sheltering income. Rental losses are passive: they offset passive income freely, and up to $25,000/yr can offset ordinary (W-2) income if you actively participate and your MAGI is under $100k (phasing out to $0 by $150k); unused losses carry forward. On sale, claimed depreciation is recaptured at up to 25%, and gains may owe capital-gains tax (a 1031 exchange can defer both). Figures are a year-1 estimate at your 24.0% rate — not tax advice; consult a CPA.
Schools (NCES district)
- District
- Atlanta Public Schools
- NCES district ID
- 1300120
- Math proficiency
- 28% ▼ -6.00%
- Reading proficiency
- 35% ▼ -2.00%
- Median HH income
- $48,306
- Composite
- 27.27/100
- National rank
- #7006
- State rank
- #80 of 174 in GA
Livability — Atlanta
- Score
- 83/100
- State rank
- #6
- US rank
- #919
Category grades
Schools grade is shown separately in the Schools card above.
Census & demographics
- Census place
- Atlanta, GA
- County
- Fulton County · 1,094,430 people
- City population
- 629,525
- Metro
- Atlanta-Sandy Springs-Alpharetta, GA
- Population (ZIP)
- 62,567
- Household income
- $62,623
- Rent vs Own
- Severe rent burden
- 3748.0
Population outlook (Fulton County) Hauer SSP2
- Today (2025)
- 1,203,707 people
- By 2030
- 1,299,706 · +8.0%
- By 2040
- 1,488,256 · +23.6%
- By 2050
- 1,664,580 · +38.3%
- By 2075
- 2,036,072 · +69.2%
- By 2100
- 2,222,402 · +84.6%
Race, ethnicity, and origin ACS 2023
- Neighborhood character
- Predominantly Black (94%)
- Race & ethnicity
- Black 94% Two or more races 3% Hispanic / Latino 2%
- Common ancestry
- Hispanic 1%
- Foreign-born
- 4% · Canada
- Languages at home
- 95% English-only · Spanish 1% French/Haitian/Cajun 1%
Political lean MEDSL · Fulton
- 2024 margin
- Solid D (+44.9) · D 71.9% · R 27.0% · Other 1.1%
- 2008→2024 swing
- +9.8pp toward D · 2008: 35.0pp · 2024: 44.9pp
- All cycles
- 2024: D+44.9 2020: D+46.4 2016: D+42.1 2012: D+29.6 2008: D+35.0
Not yet ingested
- Civics
- —
Market trends
- HPI YoY
- ▼ -106.38%
- Current HPI
- 204.5402
- Rent YoY
- ▲ 2.63%
- Metro
- Atlanta-Sandy Springs-Alpharetta, GA
- State GDP YoY
- ▲ 2.66%
- F500 in state
- 28
Industry mix (Fortune 500 HQ in GA)
| Industry | F500 HQs | Revenue |
|---|---|---|
| Paper / Packaging | 2 | $29B |
|
||
| Retail | 1 | $160B |
|
||
| Transportation / Logistics | 1 | $91B |
|
||
| Airlines | 1 | $62B |
|
||
| Consumer Goods | 1 | $47B |
|
||
| Utilities | 1 | $25B |
|
||
Price history
+344.8% since first listed13 events — show timeline
- 2026-05-27 Price Changed $149,000 GAMLS
- 2026-05-07 Price Changed $156,800 GAMLS
- 2026-04-23 Listed $165,000 GAMLS
- 2019-03-20 Sold (Public Records) $61,000 Public Records
- 2019-03-14 Sold (Public Records) $58,000 Public Records
- 2014-10-28 Price Changed $4,500 GAMLS
- 2012-01-24 Listing Removed — GAMLS
- 2012-01-20 Sold (MLS) $4,500 GAMLS
- 2012-01-11 Price Changed $5,400 GAMLS
- 2011-12-21 Price Changed $5,400 GAMLS
- 2011-12-18 Listed $7,550 GAMLS
- 1994-05-19 Sold (Public Records) $28,700 Public Records
- 1984-03-06 Sold (Public Records) $33,500 Public Records
Property tax history
+5.0%/yrLatest (2025): $2,824 · -0.1% YoY. Source: county tax records.
Cash-flow waterfall
monthlySold comps — $/sqft
last 12 mo · ≤1 miLoading sold comps…