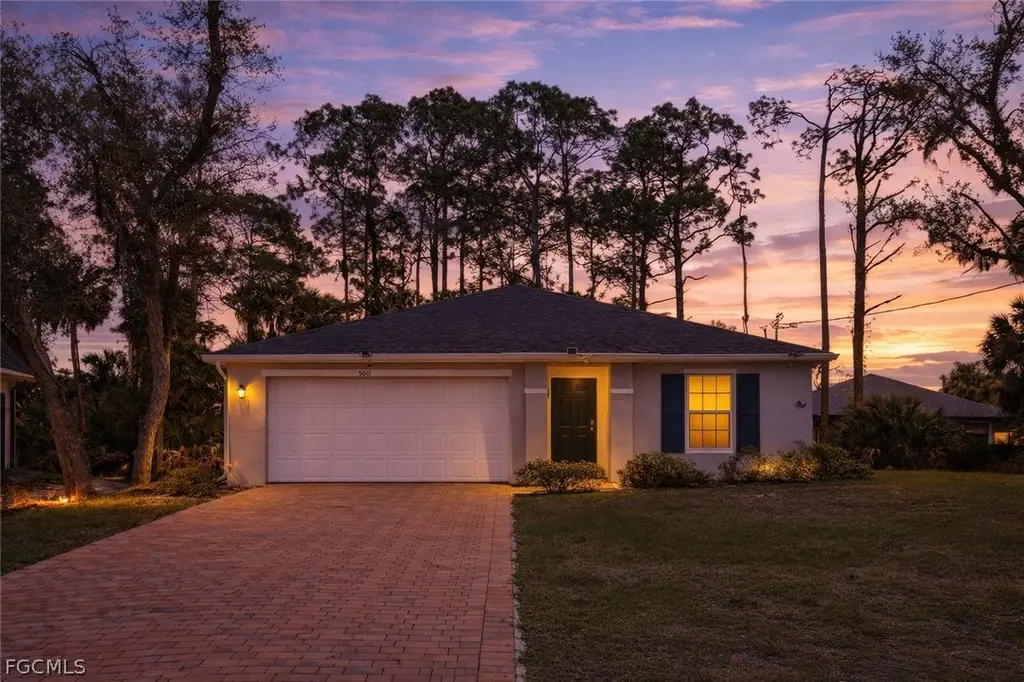
5013 Placid Ln · Port LaBelle, FL
Flood risk 3/10 · Minor
- FEMA flood zone
- X (unshaded)
- Chance of flooding over 30 yrs
- 0.2%
- Est. flood insurance / yr
- $507 – $1,088
Fire risk 4/10 · Minor
- Est. fire insurance / yr
- $947 – $1,759
Heat risk 9/10 · Severe
- Hot days now (above 108°F)
- 7 days/yr
- Hot days in 30 yrs
- 23 days/yr
Wind risk 10/10 · Severe
- Chance of severe wind over 30 yrs
- 99.0%
Air-quality risk 2/10 · Minimal
- Unhealthy air days now
- 0 days/yr
- Unhealthy air days in 30 yrs
- 1 days/yr
Risk factors via First Street. Map © Google.
Why this score? — see what drove the B- grade
The composite is a weighted blend of 9 inputs, each scored 0–100. Each bar is that input's sub-score; the figure is the points it added to the 100-point composite (weight × sub-score).
- Cash flow +19.0/30.0
- ARV discount +15.0/15.0
- Appreciation +10.0/10.0
- DSCR +6.0/10.0
- 1% rule +5.6/10.0
- Schools +3.1/10.0
- Livability +3.1/5.0
- Rent growth +2.5/5.0
- Condition / age +2.5/5.0
$212,000
🖨 Deal sheet 📄 Offer letter ✓ Due diligence
Listing remarks
A PLACE WHERE LIFE SLOWS DOWN, AND FEELS JUST RIGHT. Picture evenings in your backyard as the sun sets, with plenty of space to design your own private oasis, whether that’s a pool, outdoor kitchen, or simply room to unwind. With no HOA restrictions, you have the freedom to truly make this property your own. Located near LaBelle High School and surrounded by peaceful landscapes, this area is steadily growing while still maintaining its charm. With a paved road, power in place, and no flood zone concerns, this home offers both convenience and peace of mind. Whether you're settling into your first home, upgrading your lifestyle, or investing in a rising area, this property is ready to b
Key facts
- Paved road
- Power in place
- Private oasis
Tags
Neighborhood map
What this means for you Summary
Snapshot
- This is a 3-bed/2.0-bath single-family listed at $212k.
Deal economics
- At list price, monthly cash flow is $223 ($3k/yr) — positive.
- The deal already cash-flows at list — no discount required.
- Meets the 1% rule at list price ($2k rent vs $212k).
- Cap rate 7.6% vs local median 5.1% in Port LaBelle — top-decile yield for the area; either an underpriced asset or a hidden risk that comps aren't pricing in. Stress-test before assuming the spread holds.
Location & tenants
- Location reads 62/100 on livability (#750 in FL) — a middle-class / working-renter tenant base. Strengths: cost of living A+, housing A+; Watch: schools F, amenities F, commute F.
- Hendry (town): math 35% / reading 40% proficiency, ranked #65 of 73 in FL (top 89%) — families likely to look elsewhere, expect single-tenant / working-renter base with shorter leases; 75% free/reduced lunch — lower-income household profile, screen leases tightly.
- Market conditions: 942 active listings in the ZIP; 8 comparable units currently listed for rent nearby; rentals at typical pace (median 24d on market — plan ~3-4 weeks tenant-placement turnaround); 557 units permitted in Hendry County in 2024 (45 in 5+ unit buildings).
- At $2,257/mo this rent would consume 47% of the median local household income ($57k/yr) (locally 498% of renters already pay >50% of income on rent) — very limited rent-growth headroom before tenants either downsize or default.
Forward outlook
- In year one you build about $23k of equity ($1k loan paydown + $21k appreciation (10.0% local appreciation)).
- Hendry County population projected to shrink 7% by 2050 — rents likely to lag national; underwrite the cash flow, not the appreciation.
- At projected returns (10.0% appreciation + 3.0% rent growth), your $59k cash investment doubles in ~3 years — after that, you're playing with house money.
- By year 2, paydown + projected appreciation supports a ~$36k cash-out refi (75% LTV) — recoverable capital for the next deal without selling this one.
Negotiation context
- Only 1 days on market — expect competitive offers; lowballing is unlikely to land.
- 5 sale attempts since 4y ago with the ask held roughly flat each time — persistent listings suggest the price (not the market) is what's stuck; bring a comps-based counter.
Risks & watch-outs
- Climate carrying-cost: severe wind risk, 99% chance of damaging wind over 30y; extreme-heat days projected 7→23/yr by 2055 (HVAC capex compounding) — expect insurance premiums to compound above CPI over the hold.
Questions for the listing agent
- Is there a deadline driving the sale (1031 exchange, divorce, estate, relocation)? That informs how much negotiation room exists.
- Schools are F-rated, which usually means shorter tenancies and higher turnover. Who's the typical renter profile here, and what's been the actual vacancy rate?
- What's the average days-on-market for RENTAL listings here right now (not sales)? A rising rental-DOM trend means longer vacancies and softer asking-rent achievability than the comps imply.
- What's the recent tenant-quality profile in this submarket — average credit score on applications, eviction rate, late-payment / NSF rate, and stable-employment percentage? A property-management company in the area should have these aggregated.
- How much new for-sale + rental construction is in the pipeline within 1–3 miles? Heavy new supply typically softens prices + rents 12–24 months out; constrained supply supports both.
Investment metrics
- 1% rule
- 1.06% ✓
- Cap rate
- 7.55%
- Cash-on-cash
- 4.50%
- DSCR
- 1.20
- GRM
- 7.8
CMA / ARV
- ARV (on-the-fly)
- $273,400
- Comps found
- 12
Show comp detail 12 sales within ~0.75 mi
| Address | Dist | Beds/Ba | Sqft | Sold | Price | $/sf | Match |
|---|---|---|---|---|---|---|---|
| 5017 N Peachtree Cir | 0.29mi | 3/2.0 | 1,285 (-6%) | 5mo | $275,000 | $214 | 73 |
| 4018 Caloosa Loop | 0.51mi | 3/2.0 | 1,404 (+3%) | 2mo | $214,000 | $152 | 70 |
| 2040 S Montana Cir | 0.61mi | 3/2.0 | 1,392 (+2%) | 0mo | $230,000 | $165 | 68 |
| 5005 Squaw Ln | 0.34mi | 3/2.0 | 1,268 (-7%) | 5mo | $200,000 | $158 | 68 |
| 5003 Early Ln | 0.62mi | 3/2.0 | 1,300 (-5%) | 5mo | $266,000 | $205 | 58 |
| 3043 S Beechwood Cir | 0.75mi | 3/2.0 | 1,389 (+2%) | 6mo | $279,999 | $202 | 58 |
| 5005 Gunn Cir | 0.51mi | 3/2.0 | 1,243 (-9%) | 5mo | $259,990 | $209 | 57 |
| 5017 Wild Goose Cir | 0.45mi | 3/2.0 | 1,547 (+13%) | 2mo | $279,900 | $181 | 56 |
| 5003 Gunn Cir | 0.50mi | 2/2.0 (-1) | 1,239 (-9%) | 3mo | $255,000 | $206 | 54 |
| 5012 Gramercy Rd | 0.58mi | 4/2.0 (+1) | 1,499 (+10%) | 0mo | $260,000 | $173 | 52 |
| 5007 Early Ln | 0.59mi | 3/2.0 | 1,212 (-11%) | 4mo | $242,900 | $200 | 50 |
| 5028 S Obispo Cir | 0.59mi | 4/2.0 (+1) | 1,500 (+10%) | 5mo | $280,000 | $187 | 47 |
Match score weights: distance 35% · size 25% · config 20% · recency 20%. Top-matched comps best support the ARV.
Projected returns pro-forma
10.0% appreciation · 3.0% rent growth · sell at horizon
- IRR
- 27.5%
- Equity multiple
- 3.19×
- Total profit
- $129,730
- Equity at exit
- $190,986
- IRR
- 24.1%
- Equity multiple
- 7.25×
- Total profit
- $371,069
- Equity at exit
- $411,869
Cash invested: $59,360 (down + closing). Projections, not guarantees.
Landlord ↔ Tenant lean methodology
- Overall (STATE)
- 87 Strongly Landlord-Friendly
- State Florida
- 87 Strongly Landlord-Friendly · R+3
- County
- — inherits STATE
- City
- — inherits STATE
ZIP-level market 33935
- Home prices YoY
- 16.3%
- Active inventory
- 942
- Price-to-rent
- 7.8×
Monthly cashflow live
- Estimated rent
- $2,257 high interval (Pro) →
- Mortgage (P&I)
- −$1,112
- Tax from tax record
- −$360 /mo · $4,320/yr
- Insurance
- −$88
- HOA
- −$0
- Vacancy / Maint / Mgmt
- −$474
- Net cashflow
- $223
Break-even live
UW: 25.0% down · 7.5% · 30yr · 1.5% tax · 5.0% vac · 8.0% maint · 8.0% mgmt
Financing live
Cash to close
- Down payment
- $53,000
- Closing costs
- $6,360
- Reserves months
- —
- Total cash needed
- —
Loan-product check · same deal, 3 products live
Conventional
25% down · 7.5% · 30yr
- Down + closing
- —
- Monthly P&I
- —
- Monthly cashflow
- —
- DSCR
- —
- Eligible?
- —
Personal DTI + credit; lowest rate.
DSCR
20% down · 8.5% · 30yr
- Down + closing
- —
- Monthly P&I
- —
- Monthly cashflow
- —
- DSCR
- —
- Eligible?
- —
No personal income docs; deal must DSCR.
Hard money
10% down · 12.0% · 12mo
- Down + closing
- —
- Monthly P&I
- —
- Monthly cashflow
- —
- DSCR
- —
- Eligible?
- —
Short-term bridge; refi at stabilization.
Rent comps 8 comps
| Address | Beds | Baths | Sqft | Rent | $/sqft | DOM | Units | Dist |
|---|---|---|---|---|---|---|---|---|
| 5029 S Rosebud Cir Labelle, FL | 3.0 | 2.0 | 1389 | $1,780 | $1.28 | 23d | 1 | 0.34mi |
| 5012 Gunn Pl Labelle, FL | 3.0 | 2.5 | 1783 | $2,500 | $1.40 | 2d | 1 | 0.53mi |
| 5029 W Hummingbird Dr Labelle, FL | 3.0 | 2.0 | 1212 | $2,450 | $2.02 | 3d | 1 | 0.54mi |
| 3051 NW Beechwood Cir Labelle, FL | 4.0 | 2.0 | 1499 | $2,200 | $1.47 | 23d | 1 | 0.66mi |
| 3020 N Lakewood Rd Labelle, FL | 4.0 | 2.0 | 1499 | $1,950 | $1.30 | 23d | 1 | 1.11mi |
| 801 SW Raintree Blvd Labelle, FL | 3.0 | 2.0 | 1285 | $1,700 | $1.32 | 23d | 1 | 1.24mi |
| 7038 Lotus Cir Labelle, FL | 4.0 | 3.0 | 1680 | $2,200 | $1.31 | 16d | 1 | 1.41mi |
| 7016 Palpano Cir Labelle, FL | 3.0 | 2.5 | 1507 | $2,100 | $1.39 | 16d | 1 | 1.50mi |
Listing history 20 events
-
2026-03-20status Pending
-
2026-03-19$212,000 Active
-
2026-03-01historical
-
2026-01-31historical
-
2025-12-05price $255,000
-
2025-12-05price $255,000
-
2025-09-16price $270,000
-
2025-09-16price $270,000
-
2025-08-14$279,999 Active
-
2025-08-14$279,999 Active
-
2022-10-10soldstatus $289,505 Sold
-
2022-05-16status Pending
-
2022-05-11price $290,505
-
2022-04-27price $288,505
-
2022-04-26status Active
-
2022-03-28historical
-
2022-03-16price $298,505
-
2022-02-23price $297,505
-
2022-02-17$292,505 Active
-
2005-09-19soldstatus $40,000
ⓘ Source: listings_history table (triggers on properties + properties_extension) + one-shot
backfill from property_details.listing_events for pre-trigger history.
Tax reassessment forecast FL · Resets to sale price
- Current annual tax
- $4,320 · $360/mo
- Projected year-2 tax
- $4,320 · $360/mo
- Expected delta
- $0/yr ($0/mo · 0.0%)
ⓘ Screening estimate from a state-policy table — verify with the county assessor before closing.
Climate risk First Street
- Flood 3/10 Moderate FEMA zone X (unshaded) · 20% chance over 30 yrs
- Wildfire 4/10 Moderate
- Heat 9/10 Extreme 7 d/yr ≥108°F today · 23 d/yr by 30 yrs out
- Wind 10/10 Extreme 99% chance of damaging wind over 30 yrs
- Air quality 2/10 Low 0 unhealthy d/yr today · 1 by 30 yrs out
Nearby sold comps map
Loading sold comps map…
Walkable amenities ~0.75 mi
Loading nearby amenities…
Taxation est. · year 1
- Rental income
- $27,079
- − Mortgage interest
- −$11,875
- − Property taxes
- −$4,320
- − Insurance
- −$1,060
- − Repairs & maintenance
- −$2,166
- − Management
- −$2,166
- − Depreciation
- −$6,167
- Taxable loss
- −$677
- Est. tax savings @ 24.0%
- +$162
- After-tax cash flow
- $2,833/yr
For passive investors: Depreciation is non-cash, so a rental often shows a tax loss while cash-flowing — sheltering income. Rental losses are passive: they offset passive income freely, and up to $25,000/yr can offset ordinary (W-2) income if you actively participate and your MAGI is under $100k (phasing out to $0 by $150k); unused losses carry forward. On sale, claimed depreciation is recaptured at up to 25%, and gains may owe capital-gains tax (a 1031 exchange can defer both). Figures are a year-1 estimate at your 24.0% rate — not tax advice; consult a CPA.
Schools (NCES district)
- District
- Hendry
- NCES district ID
- 1200780
- Math proficiency
- 35% ▼ -11.00%
- Reading proficiency
- 40% ▼ -4.00%
- Median HH income
- $37,043
- Composite
- 31.16/100
- National rank
- #6054
- State rank
- #65 of 73 in FL
Livability — Port LaBelle
- Score
- 62/100
- State rank
- #750
- US rank
- #16264
Category grades
Schools grade is shown separately in the Schools card above.
Census & demographics
- Census place
- Port LaBelle, FL
- County
- Hendry County · 23,186 people
- Metro
- Clewiston, FL
- Population (ZIP)
- 23,186
- Household income
- $57,009
- Rent vs Own
- Severe rent burden
- 498.0
Population outlook (Hendry County) Hauer SSP2
- Today (2025)
- 38,866 people
- By 2030
- 38,558 · -0.8%
- By 2040
- 37,743 · -2.9%
- By 2050
- 36,117 · -7.1%
- By 2075
- 30,070 · -22.6%
- By 2100
- 21,966 · -43.5%
Race, ethnicity, and origin ACS 2023
- Neighborhood character
- Majority Hispanic (56%)
- Race & ethnicity
- Hispanic / Latino 56% White 39% Two or more races 21% Black 2% Native American 2%
- Hispanic origin (detail)
- Mexican 40% Puerto Rican 3% Cuban 5%
- Common ancestry
- Lithuanian 2% Serbian 2% Slovak 1%
- Foreign-born
- 27% · Canada, Jamaica
- Languages at home
- 50% English-only · Spanish 50%
Political lean MEDSL · Hendry
- 2024 margin
- Solid R (+38.3) · D 30.4% · R 68.7%
- 2008→2024 swing
- -31.1pp toward R · 2008: -7.2pp · 2024: -38.3pp
- All cycles
- 2024: R+38.3 2020: R+23.0 2016: R+14.2 2012: R+5.9 2008: R+7.2
Not yet ingested
- Civics
- —
Market trends
- HPI YoY
- ▲ 75.20%
- Current HPI
- 537.4928
- Rent YoY
- —
- Metro
- Clewiston, FL
- State GDP YoY
- ▲ 3.28%
- F500 in state
- 36
Industry mix (Fortune 500 HQ in FL)
| Industry | F500 HQs | Revenue |
|---|---|---|
| Industrial Technology | 2 | $29B |
|
||
| Insurance | 2 | $17B |
|
||
| Retail | 1 | $60B |
|
||
| Technology Distribution | 1 | $58B |
|
||
| Homebuilding | 1 | $35B |
|
||
| Technology Manufacturing | 1 | $35B |
|
||
Price history
+430.0% since first listed20 events — show timeline
- 2026-03-20 Pending — FORTMLS
- 2026-03-19 Listed $212,000 FORTMLS
- 2026-03-01 Listing Removed — Beaches MLS
- 2026-01-31 Listing Removed — FORTMLS
- 2025-12-05 Price Changed $255,000 Beaches MLS
- 2025-12-05 Price Changed $255,000 FORTMLS
- 2025-09-16 Price Changed $270,000 Beaches MLS
- 2025-09-16 Price Changed $270,000 FORTMLS
- 2025-08-14 Listed $279,999 FORTMLS
- 2025-08-14 Listed $279,999 Beaches MLS
- 2022-10-10 Sold (MLS) $289,505 NAPLESMLS
- 2022-05-16 Pending — NAPLESMLS
- 2022-05-11 Price Changed $290,505 NAPLESMLS
- 2022-04-27 Price Changed $288,505 NAPLESMLS
- 2022-04-26 Relisted — NAPLESMLS
- 2022-03-28 Listing Removed — NAPLESMLS
- 2022-03-16 Price Changed $298,505 NAPLESMLS
- 2022-02-23 Price Changed $297,505 NAPLESMLS
- 2022-02-17 Listed $292,505 NAPLESMLS
- 2005-09-19 Sold (Public Records) $40,000 Public Records
Property tax history
+36.5%/yrLatest (2025): $4,320 · +0.2% YoY. Source: county tax records.
Cash-flow waterfall
monthlySold comps — $/sqft
last 12 mo · ≤1 miLoading sold comps…