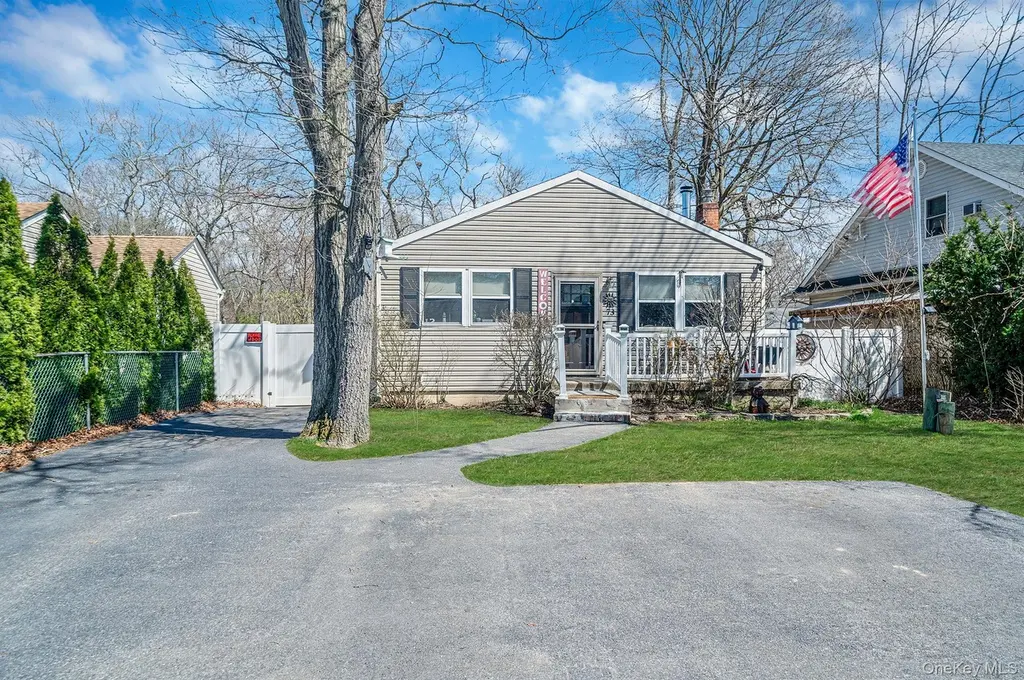
73 Wendy Dr · Farmingville, NY
Flood risk 1/10 · Minimal
- FEMA flood zone
- X (unshaded)
- Chance of flooding over 30 yrs
- 0.0%
- Est. flood insurance / yr
- $473 – $860
Fire risk 1/10 · Minimal
- Est. fire insurance / yr
- $691 – $1,283
Heat risk 4/10 · Minor
- Hot days now (above 94°F)
- 7 days/yr
- Hot days in 30 yrs
- 17 days/yr
Wind risk 6/10 · Moderate
- Chance of severe wind over 30 yrs
- 77.0%
Air-quality risk 3/10 · Minor
- Unhealthy air days now
- 3 days/yr
- Unhealthy air days in 30 yrs
- 4 days/yr
Risk factors via First Street. Map © Google.
Why this score? — see what drove the C grade
The composite is a weighted blend of 9 inputs, each scored 0–100. Each bar is that input's sub-score; the figure is the points it added to the 100-point composite (weight × sub-score).
- Cash flow +16.9/30.0
- ARV discount +14.8/15.0
- Schools +6.6/10.0
- DSCR +5.3/10.0
- 1% rule +4.1/10.0
- Livability +3.4/5.0
- Rent growth +2.5/5.0
- Condition / age +2.5/5.0
- Appreciation +0.0/10.0
$499,900
🖨 Deal sheet 📄 Offer letter ✓ Due diligence
Listing remarks MLS
A True 4 Bedroom Ranch with a Half Basement on 50 x 125 Property. Home features an Open Floor plan with Large Kitchen, Dining Room and Living Room. New Top of the Line Heating System in 2025 plus New Hot Water Storage in 2023. Amazing Back yard with many fruit trees and berries! Fruit trees including Apple, Peach, Cherry, Plum, Pear, Walnut, Almond & Fig. Plus a row of Blackberry bushes, Blueberry bushes & some grape vines. Low Taxes of $6,207 are Correct and based on a 1,000 Sqft 4-bedroom 1 Full Bath Home with a partial basement. STAR Taxes are $5,483. Hot Tub & Wood Stove are a gift.
Key facts
- 6,098 sq ft lot
- Built 1953
- Listed 31 days
Neighborhood map
What this means for you Summary
Snapshot
- This is a 4-bed/1.0-bath single-family listed at $500k.
Deal economics
- At list price, monthly cash flow is $330 ($4k/yr) — positive.
- The deal already cash-flows at list — no discount required.
- To meet the 1% rule (rent ≥ 1% of price), the offer needs to be $455k (9.0% below list).
- Recommended offer: $455k (9.0% below list) — sets the bar for 1% rule.
- Cap rate 7.1% vs local median 4.3% in Farmingville — top-decile yield for the area; either an underpriced asset or a hidden risk that comps aren't pricing in. Stress-test before assuming the spread holds.
Location & tenants
- Location reads 67/100 on livability (#592 in NY) — a middle-class / working-renter tenant base. Strengths: employment A+, housing A+, health & safety B; Watch: amenities F, commute F, cost of living F.
- Sachem Central School District (suburban): math 69% / reading 76% proficiency, ranked #86 of 590 in NY (top 15%) — strong family-tenant draw, lease renewals of 3-5y typical; only 15% free/reduced lunch — higher-income household profile.
- Market conditions: 66 active listings in the ZIP; 2 comparable units currently listed for rent nearby; 1,366 units permitted in Suffolk County in 2024 (216 in 5+ unit buildings).
Forward outlook
- Local home prices are declining (-3.0%/yr); year-one equity from $3k of loan paydown is wiped out by about $15k of value loss. Plan a longer hold.
- Suffolk County population projected to shrink 5% by 2050 — rents likely to lag national; underwrite the cash flow, not the appreciation.
Negotiation context
- It's been on market 31 days — a 3% lower offer ($485k) is reasonable based on typical stale-listing flexibility.
- 2 sale attempts since 14y ago with the ask held roughly flat each time — persistent listings suggest the price (not the market) is what's stuck; bring a comps-based counter.
- Current owner paid $100k; list at $500k implies a 400% gain — meaningful room to come down on a strong offer.
Risks & watch-outs
- Watch-outs: built in 1953 — expect roof / HVAC / electrical / plumbing capex.
- Climate carrying-cost: major wind risk, 77% chance of damaging wind over 30y — expect insurance premiums to compound above CPI over the hold.
Questions for the listing agent
- It's been on market 31 days. Have you received any prior offers? Is the seller open to a 9% concession, seller financing, or rate buy-down credit?
- Built in 1953 — when were the roof, HVAC, electrical panel, plumbing, and water heater last replaced?
- Is there a deadline driving the sale (1031 exchange, divorce, estate, relocation)? That informs how much negotiation room exists.
- Schools are B-rated — typically a magnet for longer-tenancy family renters. What's the average tenant stay here, and is there a school-zone premium baked into asking?
- What's the average days-on-market for RENTAL listings here right now (not sales)? A rising rental-DOM trend means longer vacancies and softer asking-rent achievability than the comps imply.
- What's the recent tenant-quality profile in this submarket — average credit score on applications, eviction rate, late-payment / NSF rate, and stable-employment percentage? A property-management company in the area should have these aggregated.
- How much new for-sale + rental construction is in the pipeline within 1–3 miles? Heavy new supply typically softens prices + rents 12–24 months out; constrained supply supports both.
Investment metrics
- 1% rule
- 0.91% ✗
- Cap rate
- 7.08%
- Cash-on-cash
- 2.83%
- DSCR
- 1.13
- GRM
- 9.2
CMA / ARV
- ARV (median comp)
- $596,978
- List price
- $499,900
- Delta
- -16.26%
- Verdict
- UNDERPRICED
- Comps
- 20 within 1.0 mi
Show comp detail 8 sales within ~0.75 mi
| Address | Dist | Beds/Ba | Sqft | Sold | Price | $/sf | Match |
|---|---|---|---|---|---|---|---|
| 25 Powell Ave | 0.51mi | 3/1.0 (-1) | 1,000 (0%) | 8mo | $575,000 | $575 | 65 |
| 541 Blue Point Rd | 0.20mi | 3/1.0 (-1) | 1,113 (+11%) | 6mo | $485,000 | $436 | 62 |
| 168 Woodycrest Dr | 0.30mi | 3/3.0 (-1) | 938 (-6%) | 2mo | $575,000 | $613 | 61 |
| 174 Woodycrest Dr | 0.31mi | 5/2.0 (+1) | 1,125 (+12%) | 4mo | $600,000 | $533 | 53 |
| 1139 Waverly Ave | 0.71mi | 3/1.0 (-1) | 1,064 (+6%) | 5mo | $537,500 | $505 | 47 |
| 613 Blue Point Rd | 0.53mi | 3/2.0 (-1) | 1,092 (+9%) | 9mo | $625,000 | $572 | 44 |
| 104 Cedar Oaks Ave | 0.28mi | 3/2.0 (-1) | 1,104 (+10%) | 24mo | $587,500 | $532 | 41 |
| 55 Woodycrest Ave | 0.63mi | 3/3.0 (-1) | 1,100 (+10%) | 7mo | $675,000 | $614 | 35 |
Match score weights: distance 35% · size 25% · config 20% · recency 20%. Top-matched comps best support the ARV.
Projected returns pro-forma
-3.0% appreciation · 3.0% rent growth · sell at horizon
- IRR
- -11.8%
- Equity multiple
- 0.57×
- Total profit
- $-60,045
- Equity at exit
- $74,537
- IRR
- -2.7%
- Equity multiple
- 0.82×
- Total profit
- $-25,428
- Equity at exit
- $43,222
Cash invested: $139,972 (down + closing). Projections, not guarantees.
Landlord ↔ Tenant lean methodology
- Overall (STATE)
- 15 Strongly Tenant-Friendly
- State New York
- 15 Strongly Tenant-Friendly · D+10
- County
- — inherits STATE
- City
- — inherits STATE
ZIP-level market 11738
- Active inventory
- 66
- Price-to-rent
- 9.2×
Monthly cashflow live
- Estimated rent
- $4,550 medium interval (Pro) →
- Mortgage (P&I)
- −$2,622
- Tax from tax record
- −$435 /mo · $5,222/yr
- Insurance
- −$208
- HOA
- −$0
- Vacancy / Maint / Mgmt
- −$956
- Net cashflow
- $330
Break-even live
UW: 25.0% down · 7.5% · 30yr · 1.5% tax · 5.0% vac · 8.0% maint · 8.0% mgmt
Financing live
Cash to close
- Down payment
- $124,975
- Closing costs
- $14,997
- Reserves months
- —
- Total cash needed
- —
Loan-product check · same deal, 3 products live
Conventional
25% down · 7.5% · 30yr
- Down + closing
- —
- Monthly P&I
- —
- Monthly cashflow
- —
- DSCR
- —
- Eligible?
- —
Personal DTI + credit; lowest rate.
DSCR
20% down · 8.5% · 30yr
- Down + closing
- —
- Monthly P&I
- —
- Monthly cashflow
- —
- DSCR
- —
- Eligible?
- —
No personal income docs; deal must DSCR.
Hard money
10% down · 12.0% · 12mo
- Down + closing
- —
- Monthly P&I
- —
- Monthly cashflow
- —
- DSCR
- —
- Eligible?
- —
Short-term bridge; refi at stabilization.
Rent comps 2 comps
| Address | Beds | Baths | Sqft | Rent | $/sqft | DOM | Units | Dist |
|---|---|---|---|---|---|---|---|---|
| 20 Maple Ln Farmingville, NY | 2.0–3.0 | 2.0–2.5 | 1869 | $5,984 | $3.20 | 1d | 13 | 0.55mi |
| 73 Cherry Ave Holtsville, NY | 3.0 | 2.0 | 1452 | $3,400 | $2.34 | 1d | 1 | 0.57mi |
Listing history 6 events
-
2026-05-16status Pending 605-char remark
Show marketing remark (605 chars)
A True 4 Bedroom Ranch with a Half Basement on 50 x 125 Property. Home features an Open Floor plan with Large Kitchen, Dining Room and Living Room. New Top of the Line Heating System in 2025 plus New Hot Water Storage in 2023. Amazing Back yard with many fruit trees and berries! Fruit trees including Apple, Peach, Cherry, Plum, Pear, Walnut, Almond & Fig. Plus a row of Blackberry bushes, Blueberry bushes & some grape vines. Low Taxes of $6,207 are Correct and based on a 1,000 Sqft 4-bedroom 1 Full Bath Home with a partial basement. STAR Taxes are $5,483. Hot Tub & Wood Stove are a gift.
-
2026-04-07$499,900 Active 605-char remark
Show marketing remark (605 chars)
A True 4 Bedroom Ranch with a Half Basement on 50 x 125 Property. Home features an Open Floor plan with Large Kitchen, Dining Room and Living Room. New Top of the Line Heating System in 2025 plus New Hot Water Storage in 2023. Amazing Back yard with many fruit trees and berries! Fruit trees including Apple, Peach, Cherry, Plum, Pear, Walnut, Almond & Fig. Plus a row of Blackberry bushes, Blueberry bushes & some grape vines. Low Taxes of $6,207 are Correct and based on a 1,000 Sqft 4-bedroom 1 Full Bath Home with a partial basement. STAR Taxes are $5,483. Hot Tub & Wood Stove are a gift.
-
2013-01-09historical
-
2012-06-16$229,990
-
2000-09-25soldstatus $100,000
-
1996-07-08soldstatus $103,000
ⓘ Source: listings_history table (triggers on properties + properties_extension) + one-shot
backfill from property_details.listing_events for pre-trigger history.
Tax reassessment forecast NY · Partial reset (capped growth)
- Current annual tax
- $5,222 · $435/mo
- Projected year-2 tax
- $6,835 · $570/mo
- Expected delta
- +$1,613/yr (+$134/mo · 30.9%)
ⓘ Screening estimate from a state-policy table — verify with the county assessor before closing.
Climate risk First Street
- Flood 1/10 Low FEMA zone X (unshaded) · 0% chance over 30 yrs
- Wildfire 1/10 Low
- Heat 4/10 Moderate 7 d/yr ≥94°F today · 17 d/yr by 30 yrs out
- Wind 6/10 Major 77% chance of damaging wind over 30 yrs
- Air quality 3/10 Moderate 3 unhealthy d/yr today · 4 by 30 yrs out
Nearby sold comps map
Loading sold comps map…
Walkable amenities ~0.75 mi
Loading nearby amenities…
Taxation est. · year 1
- Rental income
- $54,606
- − Mortgage interest
- −$28,002
- − Property taxes
- −$5,222
- − Insurance
- −$2,500
- − Repairs & maintenance
- −$4,368
- − Management
- −$4,368
- − Depreciation
- −$14,543
- Taxable loss
- −$4,398
- Est. tax savings @ 24.0%
- +$1,055
- After-tax cash flow
- $5,014/yr
For passive investors: Depreciation is non-cash, so a rental often shows a tax loss while cash-flowing — sheltering income. Rental losses are passive: they offset passive income freely, and up to $25,000/yr can offset ordinary (W-2) income if you actively participate and your MAGI is under $100k (phasing out to $0 by $150k); unused losses carry forward. On sale, claimed depreciation is recaptured at up to 25%, and gains may owe capital-gains tax (a 1031 exchange can defer both). Figures are a year-1 estimate at your 24.0% rate — not tax advice; consult a CPA.
Schools (NCES district)
- District
- Sachem Central School District
- NCES district ID
- 3625350
- Math proficiency
- 69% ▬ 0.00%
- Reading proficiency
- 76% ▲ 12.00%
- Median HH income
- $92,968
- Composite
- 65.53/100
- National rank
- #472
- State rank
- #86 of 590 in NY
Livability — Farmingville
- Score
- 67/100
- State rank
- #592
- US rank
- #10732
Category grades
Schools grade is shown separately in the Schools card above.
Census & demographics
- Census place
- Farmingville, NY
- City population
- 20,246
- Population (ZIP)
- 20,246
Population outlook (Suffolk County) Hauer SSP2
- Today (2025)
- 1,505,262 people
- By 2030
- 1,498,318 · -0.5%
- By 2040
- 1,471,101 · -2.3%
- By 2050
- 1,424,848 · -5.3%
- By 2075
- 1,337,157 · -11.2%
- By 2100
- 1,217,720 · -19.1%
Race, ethnicity, and origin ACS 2023
- Neighborhood character
- Diverse neighborhood (Simpson 0.57)
- Race & ethnicity
- White 61% Hispanic / Latino 23% Two or more races 8% Black 6% Asian 5% Native American 1%
- Hispanic origin (detail)
- Mexican 1% Puerto Rican 7% Dominican 2%
- Common ancestry
- Romanian 3% Estonian 2% Russian 2%
- Foreign-born
- 17% · Canada, Jamaica, China
- Languages at home
- 74% English-only · Spanish 13% Other Indo-European 8% Other Asian/Pacific 1%
Political lean MEDSL · Suffolk
- 2024 margin
- Lean R (+10.0) · D 45.0% · R 55.0%
- 2008→2024 swing
- -16.0pp toward R · 2008: 6.0pp · 2024: -10.0pp
- All cycles
- 2024: R+10.0 2020: R+0.0 2016: R+8.2 2012: D+2.9 2008: D+6.0
Not yet ingested
- Civics
- —
Market trends
- HPI YoY
- ▼ -605.51%
- Current HPI
- 364.6287
- Rent YoY
- —
- Metro
- —
- State GDP YoY
- ▲ 2.60%
- F500 in state
- 92
Industry mix (Fortune 500 HQ in NY)
| Industry | F500 HQs | Revenue |
|---|---|---|
| Financial Services | 10 | $950B |
|
||
| Consumer Goods | 9 | $162B |
|
||
| Insurance | 4 | $225B |
|
||
| Telecommunications | 2 | $144B |
|
||
| Pharmaceuticals | 2 | $112B |
|
||
| Media / Entertainment | 2 | $69B |
|
||
Price history
+385.3% since first listed6 events — show timeline
- 2026-05-16 Pending — OneKey® MLS as Distributed by MLS Grid
- 2026-04-07 Listed $499,900 OneKey® MLS as Distributed by MLS Grid
- 2013-01-09 Listing Removed — OneKey® MLS as Distributed by MLS Grid
- 2012-06-16 Listed $229,990 OneKey® MLS as Distributed by MLS Grid
- 2000-09-25 Sold (Public Records) $100,000 Public Records
- 1996-07-08 Sold (Public Records) $103,000 Public Records
Property tax history
+2.3%/yrLatest (2025): $5,222 · +0.0% YoY. Source: county tax records.
Cash-flow waterfall
monthlySold comps — $/sqft
last 12 mo · ≤1 miLoading sold comps…