 Duplex
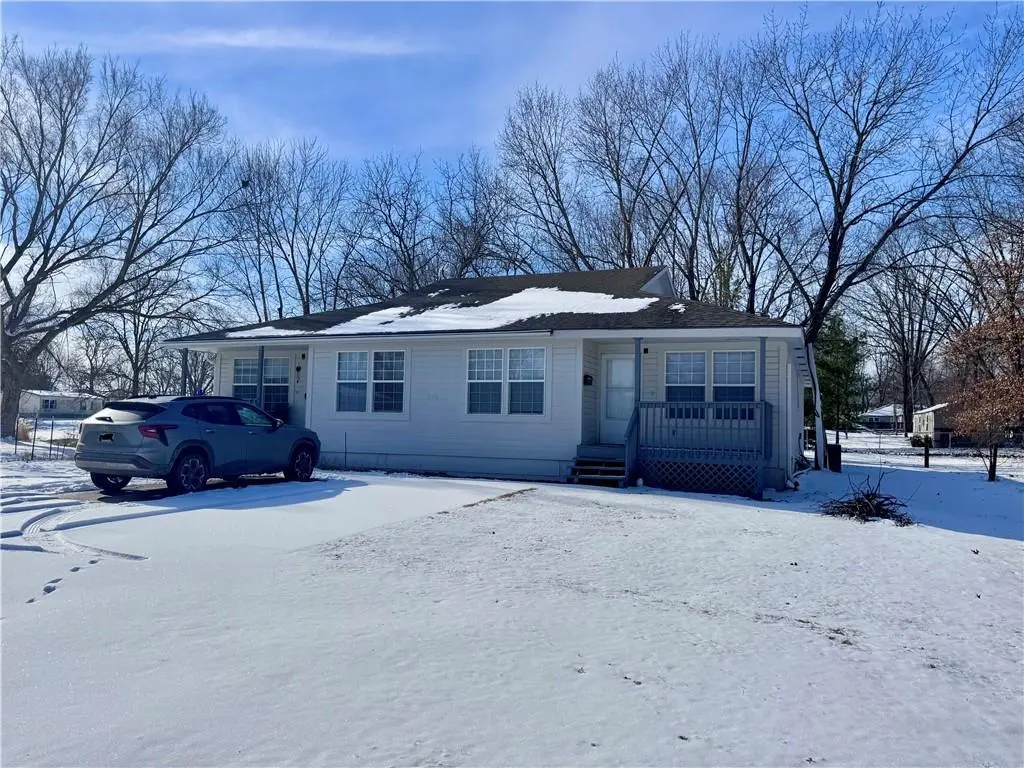
206 N Elm St · Holden, MO
Flood risk 6/10 · Moderate
- FEMA flood zone
- X (unshaded)
- Chance of flooding over 30 yrs
- 0.7%
- Est. flood insurance / yr
- $507 – $1,088
Fire risk 4/10 · Minor
- Est. fire insurance / yr
- $1,054 – $1,958
Heat risk 4/10 · Minor
- Hot days now (above 107°F)
- 7 days/yr
- Hot days in 30 yrs
- 17 days/yr
Wind risk 2/10 · Minimal
- Chance of severe wind over 30 yrs
- 1.0%
Air-quality risk 1/10 · Minimal
- Unhealthy air days now
- 0 days/yr
- Unhealthy air days in 30 yrs
- 0 days/yr
Risk factors via First Street. Map © Google.
Why this score? — see what drove the C- grade
The composite is a weighted blend of 9 inputs, each scored 0–100. Each bar is that input's sub-score; the figure is the points it added to the 100-point composite (weight × sub-score).
- Cash flow +16.0/30.0
- Appreciation +10.0/10.0
- ARV discount +7.5/15.0
- DSCR +4.9/10.0
- 1% rule +3.5/10.0
- Livability +3.5/5.0
- Schools +3.2/10.0
- Rent growth +2.5/5.0
- Condition / age +2.5/5.0
$260,000
🖨 Deal sheet 📄 Offer letter ✓ Due diligence
Multi-family units
County records classify this as Multi-Family (2-4 Unit). Listing-text estimate: 2 units. confirmed
Listing remarks MLS
This well-maintained duplex features two 3-bedroom, 2-bathroom units, making it perfect for owner-occupants or investors. Unit A is currently leased at $890/month through 08/31/2026, providing immediate income, while Unit B is vacant, giving buyers the flexibility to live in one unit and rent the other or rent both for additional income. Both units are in very good condition, with the primary item to note being a water line issue in Unit B; a contractor bid has been obtained for reference. Property taxes were $1,801 in 2025. For questions, please contact listing agent Madison Alexander at 660-454-0031 or madison@brooksrealty. us .
Key facts
- 0.28 acre lot
- Built 2006
- Listed 138 days
Neighborhood map
What this means for you Summary
Snapshot
- This is a 2 × 3-bed/1.5-bath units multifamily listed at $260k.
Deal economics
- At list price, monthly cash flow is $128 ($2k/yr) — positive. Per door: $64/mo.
- The deal already cash-flows at list — no discount required.
- To meet the 1% rule (rent ≥ 1% of price), the offer needs to be $222k (14.8% below list).
- Recommended offer: $222k (14.8% below list) — sets the bar for 1% rule.
- Cap rate 6.9% vs local median 2.6% in Holden — top-decile yield for the area; either an underpriced asset or a hidden risk that comps aren't pricing in. Stress-test before assuming the spread holds.
Location & tenants
- Location reads 69/100 on livability (#167 in MO) — a middle-class / working-renter tenant base. Strengths: cost of living A+, housing A+, crime A-; Watch: employment D+, schools F, amenities F.
- Holden R-III (rural): math 33% / reading 41% proficiency, ranked #176 of 324 in MO (top 54%) — families likely to look elsewhere, expect single-tenant / working-renter base with shorter leases.
- Market conditions: 75 active listings in the ZIP; 80 units permitted in Johnson County in 2024 (27 in 5+ unit buildings).
Forward outlook
- In year one you build about $28k of equity ($2k loan paydown + $26k appreciation (10.0% local appreciation)).
- Johnson County population projected at +6% by 2050 — modest demand growth; plan on rents tracking national, not racing it.
- At projected returns (10.0% appreciation + 3.0% rent growth), your $73k cash investment doubles in ~3 years — after that, you're playing with house money.
- By year 2, paydown + projected appreciation supports a ~$45k cash-out refi (75% LTV) — recoverable capital for the next deal without selling this one.
Negotiation context
- It's been on market 139 days — a 12% lower offer ($229k) is reasonable based on typical stale-listing flexibility.
- 6 sale attempts since 16y ago with the ask held roughly flat each time — persistent listings suggest the price (not the market) is what's stuck; bring a comps-based counter.
Risks & watch-outs
- Climate carrying-cost: major flood risk — expect insurance premiums to compound above CPI over the hold.
Questions for the listing agent
- It's been on market 139 days. Have you received any prior offers? Is the seller open to a 15% concession, seller financing, or rate buy-down credit?
- Can we see the unit-by-unit rent roll, current vacancy, and any below-market leases? What's the average tenancy length?
- What capital expenditures (roof, boiler, parking lot, exteriors) have been made in the last 5 years, and what's planned in the next 2?
- Why hasn't it sold? Are there any deal-killer items the seller is aware of (foundation, flood, title, zoning, code violations)?
- Is there a deadline driving the sale (1031 exchange, divorce, estate, relocation)? That informs how much negotiation room exists.
- Schools are F-rated, which usually means shorter tenancies and higher turnover. Who's the typical renter profile here, and what's been the actual vacancy rate?
- What's the average days-on-market for RENTAL listings here right now (not sales)? A rising rental-DOM trend means longer vacancies and softer asking-rent achievability than the comps imply.
- What's the recent tenant-quality profile in this submarket — average credit score on applications, eviction rate, late-payment / NSF rate, and stable-employment percentage? A property-management company in the area should have these aggregated.
- How much new apartment / multifamily construction is in the pipeline within 1–3 miles? Heavy new supply (>2% of stock underway) typically softens rents 12–24 months out; light construction supports rent growth.
Investment metrics
- 1% rule
- 0.85% ✗
- Cap rate
- 6.88%
- Cash-on-cash
- 2.11%
- DSCR
- 1.09
- GRM
- 9.8
CMA / ARV
No comps found within radius.
Projected returns pro-forma
10.0% appreciation · 3.0% rent growth · sell at horizon
- IRR
- 25.8%
- Equity multiple
- 3.06×
- Total profit
- $149,674
- Equity at exit
- $234,229
- IRR
- 22.7%
- Equity multiple
- 6.96×
- Total profit
- $434,213
- Equity at exit
- $505,123
Cash invested: $72,800 (down + closing). Projections, not guarantees.
Landlord ↔ Tenant lean methodology
- Overall (STATE)
- 81 Strongly Landlord-Friendly
- State Missouri
- 81 Strongly Landlord-Friendly · R+10
- County
- — inherits STATE
- City
- — inherits STATE
ZIP-level market 64040
- Home prices YoY
- 6.2%
- Active inventory
- 75
- Price-to-rent
- 19.6×
Monthly cashflow live
- Estimated rent
- $2,215 medium interval (Pro) →
- Mortgage (P&I)
- −$1,363
- Tax from tax record
- −$150 /mo · $1,802/yr
- Insurance
- −$108
- HOA
- −$0
- Vacancy / Maint / Mgmt
- −$465
- Net cashflow
- $128
Break-even live
2-unit breakdown (identical units grouped — click to expand)
| Units | Beds | Baths | Est. rent |
|---|---|---|---|
| 2× units | 3 | 1.5 | $2,214 |
| #1 | 3 | 1.5 | $1,107 |
| #2 | 3 | 1.5 | $1,107 |
| Total (2 units) | $2,215 | ||
UW: 25.0% down · 7.5% · 30yr · 1.5% tax · 5.0% vac · 8.0% maint · 8.0% mgmt
Financing live
Cash to close
- Down payment
- $65,000
- Closing costs
- $7,800
- Reserves months
- —
- Total cash needed
- —
Loan-product check · same deal, 3 products live
Conventional
25% down · 7.5% · 30yr
- Down + closing
- —
- Monthly P&I
- —
- Monthly cashflow
- —
- DSCR
- —
- Eligible?
- —
Personal DTI + credit; lowest rate.
DSCR
20% down · 8.5% · 30yr
- Down + closing
- —
- Monthly P&I
- —
- Monthly cashflow
- —
- DSCR
- —
- Eligible?
- —
No personal income docs; deal must DSCR.
Hard money
10% down · 12.0% · 12mo
- Down + closing
- —
- Monthly P&I
- —
- Monthly cashflow
- —
- DSCR
- —
- Eligible?
- —
Short-term bridge; refi at stabilization.
Listing history 29 events
-
2026-06-18days on market $260,000 Active 139 DOM
-
2026-06-17days on market $260,000 Active 138 DOM
-
2026-06-16days on market $260,000 Active 137 DOM
-
2026-06-15days on market $260,000 Active 136 DOM
-
2026-06-13days on market $260,000 Active 134 DOM
-
2026-06-12days on market $260,000 Active 133 DOM
-
2026-06-09days on market $260,000 Active 130 DOM
-
2026-06-08days on market $260,000 Active 129 DOM
-
2026-06-07days on market $260,000 Active 128 DOM
-
2026-06-05days on market $260,000 Active 126 DOM
-
2026-06-04days on market $260,000 Active 124 DOM
-
2026-06-02days on market $260,000 Active 123 DOM
-
2026-06-01days on market $260,000 Active 122 DOM
-
2026-05-31days on market $260,000 Active 121 DOM
-
2026-01-30$260,000 Active 639-char remark
Show marketing remark (639 chars)
This well-maintained duplex features two 3-bedroom, 2-bathroom units, making it perfect for owner-occupants or investors. Unit A is currently leased at $890/month through 08/31/2026, providing immediate income, while Unit B is vacant, giving buyers the flexibility to live in one unit and rent the other or rent both for additional income. Both units are in very good condition, with the primary item to note being a water line issue in Unit B; a contractor bid has been obtained for reference. Property taxes were $1,801 in 2025. For questions, please contact listing agent Madison Alexander at 660-454-0031 or madison@brooksrealty. us .
-
2022-05-11soldstatus Closed 300-char remark
Show marketing remark (300 chars)
Modern duplex, 3 bedroom, 2 bath, nice open floor plan with kitchen, dining and living all open. Utility room with hookups for washer and dryer with plenty of room for a freezer. Quiet neighborhood, shade trees on west side of unit. New gutters with covers, new storage building with divided storage.
-
2022-05-10soldstatus
-
2022-03-28status Pending 300-char remark
Show marketing remark (300 chars)
Modern duplex, 3 bedroom, 2 bath, nice open floor plan with kitchen, dining and living all open. Utility room with hookups for washer and dryer with plenty of room for a freezer. Quiet neighborhood, shade trees on west side of unit. New gutters with covers, new storage building with divided storage.
-
2022-01-12status Active 300-char remark
Show marketing remark (300 chars)
Modern duplex, 3 bedroom, 2 bath, nice open floor plan with kitchen, dining and living all open. Utility room with hookups for washer and dryer with plenty of room for a freezer. Quiet neighborhood, shade trees on west side of unit. New gutters with covers, new storage building with divided storage.
-
2022-01-02historical Active Under Contract 300-char remark
Show marketing remark (300 chars)
Modern duplex, 3 bedroom, 2 bath, nice open floor plan with kitchen, dining and living all open. Utility room with hookups for washer and dryer with plenty of room for a freezer. Quiet neighborhood, shade trees on west side of unit. New gutters with covers, new storage building with divided storage.
-
2021-12-13$219,000 Active 300-char remark
Show marketing remark (300 chars)
Modern duplex, 3 bedroom, 2 bath, nice open floor plan with kitchen, dining and living all open. Utility room with hookups for washer and dryer with plenty of room for a freezer. Quiet neighborhood, shade trees on west side of unit. New gutters with covers, new storage building with divided storage.
-
2021-04-16soldstatus Closed
-
2021-04-15soldstatus
-
2021-03-22historical Active Under Contract
-
2021-03-22$165,000 Active
-
2011-12-14historical
-
2011-06-15historical
-
2010-12-14$145,000
-
2010-12-14$145,000
ⓘ Source: listings_history table (triggers on properties + properties_extension) + one-shot
backfill from property_details.listing_events for pre-trigger history.
Tax reassessment forecast MO · Resets to sale price
- Current annual tax
- $1,802 · $150/mo
- Projected year-2 tax
- $2,522 · $210/mo
- Expected delta
- +$720/yr (+$60/mo · 40.0%)
ⓘ Screening estimate from a state-policy table — verify with the county assessor before closing.
Climate risk First Street
- Flood 6/10 Major FEMA zone X (unshaded) · 70% chance over 30 yrs
- Wildfire 4/10 Moderate
- Heat 4/10 Moderate 7 d/yr ≥107°F today · 17 d/yr by 30 yrs out
- Wind 2/10 Low 100% chance of damaging wind over 30 yrs
- Air quality 1/10 Low 0 unhealthy d/yr today · 0 by 30 yrs out
Nearby sold comps map
Loading sold comps map…
Walkable amenities ~0.75 mi
Loading nearby amenities…
Taxation est. · year 1
- Rental income
- $26,580
- − Mortgage interest
- −$14,564
- − Property taxes
- −$1,802
- − Insurance
- −$1,300
- − Repairs & maintenance
- −$2,126
- − Management
- −$2,126
- − Depreciation
- −$7,564
- Taxable loss
- −$2,902
- Est. tax savings @ 24.0%
- +$697
- After-tax cash flow
- $2,231/yr
For passive investors: Depreciation is non-cash, so a rental often shows a tax loss while cash-flowing — sheltering income. Rental losses are passive: they offset passive income freely, and up to $25,000/yr can offset ordinary (W-2) income if you actively participate and your MAGI is under $100k (phasing out to $0 by $150k); unused losses carry forward. On sale, claimed depreciation is recaptured at up to 25%, and gains may owe capital-gains tax (a 1031 exchange can defer both). Figures are a year-1 estimate at your 24.0% rate — not tax advice; consult a CPA.
Schools (NCES district)
- District
- Holden R-III
- NCES district ID
- 2914490
- Math proficiency
- 33% ▲ 2.00%
- Reading proficiency
- 41% ▲ 1.00%
- Median HH income
- $53,033
- Composite
- 32.27/100
- National rank
- #5759
- State rank
- #176 of 324 in MO
Livability — Holden
- Score
- 69/100
- State rank
- #167
- US rank
- #8986
Category grades
Schools grade is shown separately in the Schools card above.
Census & demographics
- Census place
- Holden, MO
- City population
- 5,968
- Population (ZIP)
- 5,968
Population outlook (Johnson County) Hauer SSP2
- Today (2025)
- 55,794 people
- By 2030
- 56,861 · +1.9%
- By 2040
- 58,239 · +4.4%
- By 2050
- 59,168 · +6.0%
- By 2075
- 62,222 · +11.5%
- By 2100
- 60,118 · +7.7%
Race, ethnicity, and origin ACS 2023
- Neighborhood character
- Predominantly White (92%)
- Race & ethnicity
- White 92% Two or more races 6% Hispanic / Latino 4%
- Common ancestry
- Iranian 6% Italian 2% Portuguese 2%
- Foreign-born
- 2% · Canada
- Languages at home
- 96% English-only · Spanish 3%
Political lean MEDSL · Johnson
- 2024 margin
- Solid R (+39.6) · D 29.5% · R 69.1% · Other 1.4%
- 2008→2024 swing
- -27.3pp toward R · 2008: -12.2pp · 2024: -39.6pp
- All cycles
- 2024: R+39.6 2020: R+36.8 2016: R+36.9 2012: R+24.2 2008: R+12.2
Not yet ingested
- Civics
- —
Market trends
- HPI YoY
- ▲ 19.92%
- Current HPI
- 342.75
- Rent YoY
- —
- Metro
- —
- State GDP YoY
- ▲ 1.84%
- F500 in state
- 20
Industry mix (Fortune 500 HQ in MO)
| Industry | F500 HQs | Revenue |
|---|---|---|
| Healthcare | 1 | $163B |
|
||
| Insurance | 1 | $21B |
|
||
| Industrial Technology | 1 | $17B |
|
||
| Retail | 1 | $16B |
|
||
| Industrial Distribution | 1 | $10B |
|
||
| Utilities | 1 | $9B |
|
||
Price history
+79.3% since first listed15 events — show timeline
- 2026-01-30 Listed $260,000 Heartland MLS as Distributed by MLS Grid
- 2022-05-11 Sold (MLS) — Heartland MLS as Distributed by MLS Grid
- 2022-05-10 Sold (Public Records) — Public Records
- 2022-03-28 Pending — Heartland MLS as Distributed by MLS Grid
- 2022-01-12 Relisted — Heartland MLS as Distributed by MLS Grid
- 2022-01-02 Contingent — Heartland MLS as Distributed by MLS Grid
- 2021-12-13 Listed $219,000 Heartland MLS as Distributed by MLS Grid
- 2021-04-16 Sold (MLS) — Heartland MLS as Distributed by MLS Grid
- 2021-04-15 Sold (Public Records) — Public Records
- 2021-03-22 Contingent — Heartland MLS as Distributed by MLS Grid
- 2021-03-22 Listed $165,000 Heartland MLS as Distributed by MLS Grid
- 2011-12-14 Listing Removed — Heartland MLS as Distributed by MLS Grid
- 2011-06-15 Listing Removed — Heartland MLS as Distributed by MLS Grid
- 2010-12-14 Listed $145,000 Heartland MLS as Distributed by MLS Grid
- 2010-12-14 Listed $145,000 Heartland MLS as Distributed by MLS Grid
Property tax history
+1.6%/yrLatest (2025): $1,802 · +9.0% YoY. Source: county tax records.
Cash-flow waterfall
monthlySold comps — $/sqft
last 12 mo · ≤1 miLoading sold comps…