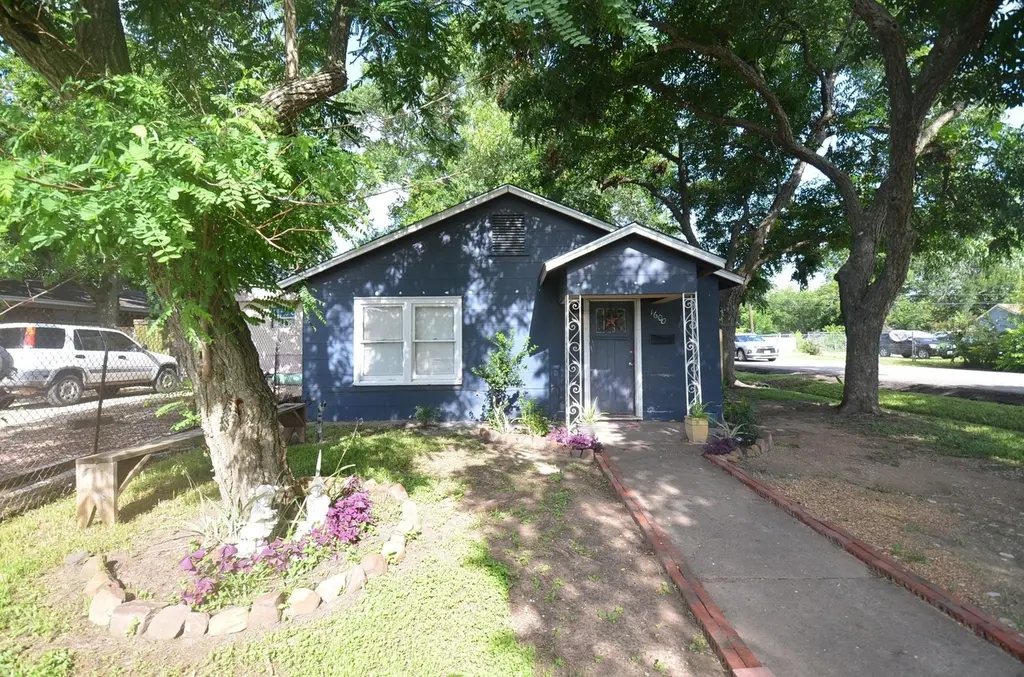
1600 5th St · Rosenberg, TX
Flood risk 4/10 · Minor
- FEMA flood zone
- X (unshaded)
- Chance of flooding over 30 yrs
- 0.22%
- Est. flood insurance / yr
- $507 – $1,088
Fire risk 3/10 · Minor
- Est. fire insurance / yr
- $1,222 – $2,270
Heat risk 9/10 · Severe
- Hot days now (above 110°F)
- 7 days/yr
- Hot days in 30 yrs
- 21 days/yr
Wind risk 9/10 · Severe
- Chance of severe wind over 30 yrs
- 99.0%
Air-quality risk 2/10 · Minimal
- Unhealthy air days now
- 1 days/yr
- Unhealthy air days in 30 yrs
- 1 days/yr
Risk factors via First Street. Map © Google.
Why this score? — see what drove the C grade
The composite is a weighted blend of 9 inputs, each scored 0–100. Each bar is that input's sub-score; the figure is the points it added to the 100-point composite (weight × sub-score).
- Cash flow +17.1/30.0
- ARV discount +15.0/15.0
- 1% rule +5.3/10.0
- DSCR +5.3/10.0
- Schools +4.6/10.0
- Livability +3.1/5.0
- Condition / age +2.5/5.0
- Rent growth +2.3/5.0
- Appreciation +0.0/10.0
$130,000
🖨 Deal sheet 📄 Offer letter ✓ Due diligence
Listing remarks
Charming cottage style home situated on a spacious corner lot in the heart of Rosenberg. Nestled beneath mature shade trees, this 2 bedroom, 1 bathroom residence offers 992 square feet of comfortable living space with a bright and inviting layout. The formal living room is filled with natural light, while the kitchen and dining area provide a functional space for everyday living. Both bedrooms feature updated flooring, ceiling fans, and generous windows. The full bathroom includes an updated vanity and a tub and shower combination. Outside, enjoy a large fenced backyard with room for pets, gardening, or outdoor recreation, plus a patio area and convenient side yard access. Located near shop
Key facts
- Patio area
- Mature shade trees
- Fenced backyard
Tags
Property features AI
Finance
- Financial info: Lease considered
Exterior
- Parking: Additional parking available
- Utilities: Public water; Public sewer
- Home design: Residential property; Built in 1953; Slab foundation; Composition roof
- Construction: Wood siding construction
- Exterior features: Deck; Patio; Private yard; Fenced backyard; Corner lot; Subdivision setting; Asphalt road access
Interior
- Kitchen: Electric range; Oven
- Flooring: Carpet
- Bathrooms: 1 full bathroom
- Heating & cooling: Central heating (gas); Central electric air conditioning
- Interior features: Tub with shower; Ceiling fans; Kitchen/dining combo; 5 total rooms
- Laundry & utility: Washer hookup; Electric dryer hookup
Neighborhood map
What this means for you Summary
Snapshot
- This is a 2-bed/1.0-bath single-family listed at $130k.
Deal economics
- At list price, monthly cash flow is $91 ($1k/yr) — positive.
- The deal already cash-flows at list — no discount required.
- Meets the 1% rule at list price ($1k rent vs $130k).
- Cap rate 7.1% vs local median 3.4% in Rosenberg — top-decile yield for the area; either an underpriced asset or a hidden risk that comps aren't pricing in. Stress-test before assuming the spread holds.
Location & tenants
- Location reads 62/100 on livability (#922 in TX) — a middle-class / working-renter tenant base. Strengths: cost of living A+, housing A+, crime B; Watch: schools D-, amenities F, commute F.
- Lamar CISD (suburban): math 50% / reading 53% proficiency, ranked #116 of 826 in TX (top 14%) — acceptable for families but not a draw, mixed tenant base, ~2y average lease.
- Market conditions: Rents soft (-1.0%/yr); 716 active listings in the ZIP; 4 comparable units currently listed for rent nearby; rentals lingering (median 44d on market — plan ~5-8 weeks vacancy on turnover, expect pricing pressure); 50% of comp listings sitting > 30 days — soft ceiling on asking rent; 12,093 units permitted in Fort Bend County in 2024 (815 in 5+ unit buildings).
Forward outlook
- Local home prices are declining (-3.0%/yr); year-one equity from $899 of loan paydown is wiped out by about $4k of value loss. Plan a longer hold.
- Fort Bend County population projected at +75% by 2050 — long-run rental-demand tailwind backs the buy-and-hold thesis.
Negotiation context
- Only 1 days on market — expect competitive offers; lowballing is unlikely to land.
- 2 sale attempts with the ask held roughly flat each time — persistent listings suggest the price (not the market) is what's stuck; bring a comps-based counter.
Risks & watch-outs
- Watch-outs: built in 1953 — expect roof / HVAC / electrical / plumbing capex.
- Climate carrying-cost: severe wind risk, 99% chance of damaging wind over 30y; extreme-heat days projected 7→21/yr by 2055 (HVAC capex compounding) — expect insurance premiums to compound above CPI over the hold.
Questions for the listing agent
- Built in 1953 — when were the roof, HVAC, electrical panel, plumbing, and water heater last replaced?
- Is there a deadline driving the sale (1031 exchange, divorce, estate, relocation)? That informs how much negotiation room exists.
- Schools are D-rated, which usually means shorter tenancies and higher turnover. Who's the typical renter profile here, and what's been the actual vacancy rate?
- What's the average days-on-market for RENTAL listings here right now (not sales)? A rising rental-DOM trend means longer vacancies and softer asking-rent achievability than the comps imply.
- What's the recent tenant-quality profile in this submarket — average credit score on applications, eviction rate, late-payment / NSF rate, and stable-employment percentage? A property-management company in the area should have these aggregated.
- How much new for-sale + rental construction is in the pipeline within 1–3 miles? Heavy new supply typically softens prices + rents 12–24 months out; constrained supply supports both.
Investment metrics
- 1% rule
- 1.03% ✓
- Cap rate
- 7.13%
- Cash-on-cash
- 3.00%
- DSCR
- 1.13
- GRM
- 8.1
CMA / ARV
- ARV (on-the-fly)
- $178,560
- Comps found
- 9
Show comp detail 9 sales within ~0.75 mi
| Address | Dist | Beds/Ba | Sqft | Sold | Price | $/sf | Match |
|---|---|---|---|---|---|---|---|
| 1205 2nd St | 0.32mi | 3/1.0 (+1) | 1,034 (+4%) | 7mo | $164,990 | $160 | 67 |
| 1508 7th St | 0.14mi | 3/1.0 (+1) | 954 (-4%) | 20mo | $205,000 | $215 | 66 |
| 1613 Mulcahy St | 0.43mi | 2/2.0 | 1,052 (+6%) | 0mo | $190,000 | $181 | 66 |
| 1119 Avenue K | 0.69mi | 2/1.0 | 1,010 (+2%) | 12mo | $185,000 | $183 | 54 |
| 1614 Avenue L | 0.37mi | 2/1.0 | 912 (-8%) | 22mo | $159,000 | $174 | 51 |
| 1615 Brazos St | 0.49mi | 2/1.0 | 1,092 (+10%) | 16mo | $175,000 | $160 | 47 |
| 1116 Austin St | 0.60mi | 2/1.0 | 872 (-12%) | 12mo | $184,900 | $212 | 42 |
| 1808 George St | 0.73mi | 3/1.0 (+1) | 1,056 (+6%) | 10mo | $189,900 | $180 | 42 |
| 2003 2nd St | 0.46mi | 2/2.0 | 1,120 (+13%) | 16mo | $129,900 | $116 | 39 |
Match score weights: distance 35% · size 25% · config 20% · recency 20%. Top-matched comps best support the ARV.
Projected returns pro-forma
-3.0% appreciation · 0.0% rent growth · sell at horizon
- IRR
- -15.2%
- Equity multiple
- 0.47×
- Total profit
- $-19,128
- Equity at exit
- $19,383
- IRR
- -13.3%
- Equity multiple
- 0.34×
- Total profit
- $-24,083
- Equity at exit
- $11,240
Cash invested: $36,400 (down + closing). Projections, not guarantees.
Landlord ↔ Tenant lean methodology
- Overall (STATE)
- 87 Strongly Landlord-Friendly
- State Texas
- 87 Strongly Landlord-Friendly · R+5
- County
- — inherits STATE
- City
- — inherits STATE
ZIP-level market 77471
- Home prices YoY
- -19.3%
- Rents YoY
- -1.0%
- Active inventory
- 716
- Price-to-rent
- 8.1×
Monthly cashflow live
- Estimated rent
- $1,336 medium interval (Pro) →
- Mortgage (P&I)
- −$682
- Tax from tax record
- −$229 /mo · $2,745/yr
- Insurance
- −$54
- HOA
- −$0
- Vacancy / Maint / Mgmt
- −$281
- Net cashflow
- $91
Break-even live
UW: 25.0% down · 7.5% · 30yr · 1.5% tax · 5.0% vac · 8.0% maint · 8.0% mgmt
Financing live
Cash to close
- Down payment
- $32,500
- Closing costs
- $3,900
- Reserves months
- —
- Total cash needed
- —
Loan-product check · same deal, 3 products live
Conventional
25% down · 7.5% · 30yr
- Down + closing
- —
- Monthly P&I
- —
- Monthly cashflow
- —
- DSCR
- —
- Eligible?
- —
Personal DTI + credit; lowest rate.
DSCR
20% down · 8.5% · 30yr
- Down + closing
- —
- Monthly P&I
- —
- Monthly cashflow
- —
- DSCR
- —
- Eligible?
- —
No personal income docs; deal must DSCR.
Hard money
10% down · 12.0% · 12mo
- Down + closing
- —
- Monthly P&I
- —
- Monthly cashflow
- —
- DSCR
- —
- Eligible?
- —
Short-term bridge; refi at stabilization.
Rent comps 4 comps
| Address | Beds | Baths | Sqft | Rent | $/sqft | DOM | Units | Dist |
|---|---|---|---|---|---|---|---|---|
| 1747 5th St Rosenberg, TX | 2.0 | 1.0 | 660 | $1,400 | $2.12 | 43d | 1 | 0.19mi |
| 1811 City Hall Dr Rosenberg, TX | 1.0 | 1.0 | 587 | $1,049 | $1.79 | 5d | 6 | 0.41mi |
| 1209 Mulcahy St Unit 1205 Rosenberg, TX | 2.0 | 1.0 | 700 | $1,075 | $1.54 | 1d | 1 | 0.47mi |
| 2907 Airport Ave Rosenberg, TX | 2.0 | 1.0 | 865 | $1,105 | $1.28 | 43d | 1 | 0.85mi |
Listing history 2 events
-
2026-06-18remarks 699-char remark
-
2026-06-18$130,000 Active 1 DOM
ⓘ Source: listings_history table (triggers on properties + properties_extension) + one-shot
backfill from property_details.listing_events for pre-trigger history.
Tax reassessment forecast TX · Resets to sale price
- Current annual tax
- $2,745 · $229/mo
- Projected year-2 tax
- $2,745 · $229/mo
- Expected delta
- $0/yr ($0/mo · 0.0%)
ⓘ Screening estimate from a state-policy table — verify with the county assessor before closing.
Climate risk First Street
- Flood 4/10 Moderate FEMA zone X (unshaded) · 22% chance over 30 yrs
- Wildfire 3/10 Moderate
- Heat 9/10 Extreme 7 d/yr ≥110°F today · 21 d/yr by 30 yrs out
- Wind 9/10 Extreme 99% chance of damaging wind over 30 yrs
- Air quality 2/10 Low 1 unhealthy d/yr today · 1 by 30 yrs out
Nearby sold comps map
Loading sold comps map…
Walkable amenities ~0.75 mi
Loading nearby amenities…
Taxation est. · year 1
- Rental income
- $16,034
- − Mortgage interest
- −$7,282
- − Property taxes
- −$2,745
- − Insurance
- −$650
- − Repairs & maintenance
- −$1,283
- − Management
- −$1,283
- − Depreciation
- −$3,782
- Taxable loss
- −$990
- Est. tax savings @ 24.0%
- +$238
- After-tax cash flow
- $1,329/yr
For passive investors: Depreciation is non-cash, so a rental often shows a tax loss while cash-flowing — sheltering income. Rental losses are passive: they offset passive income freely, and up to $25,000/yr can offset ordinary (W-2) income if you actively participate and your MAGI is under $100k (phasing out to $0 by $150k); unused losses carry forward. On sale, claimed depreciation is recaptured at up to 25%, and gains may owe capital-gains tax (a 1031 exchange can defer both). Figures are a year-1 estimate at your 24.0% rate — not tax advice; consult a CPA.
Schools (NCES district)
- District
- Lamar CISD
- NCES district ID
- 4826580
- Math proficiency
- 50% ▼ -12.00%
- Reading proficiency
- 53% ▼ -4.00%
- Median HH income
- $75,213
- Composite
- 46.43/100
- National rank
- #2452
- State rank
- #116 of 826 in TX
Livability — Rosenberg
- Score
- 62/100
- State rank
- #922
- US rank
- #16414
Category grades
Schools grade is shown separately in the Schools card above.
Census & demographics
- Census place
- Rosenberg, TX
- County
- Fort Bend County · 836,777 people
- City population
- 115,151
- Metro
- Houston-The Woodlands-Sugar Land, TX
- Population (ZIP)
- 45,325
- Household income
- $73,186
- Rent vs Own
- Severe rent burden
- 1688.0
Population outlook (Fort Bend County) Hauer SSP2
- Today (2025)
- 1,004,526 people
- By 2030
- 1,153,104 · +14.8%
- By 2040
- 1,453,718 · +44.7%
- By 2050
- 1,753,781 · +74.6%
- By 2075
- 2,455,772 · +144.5%
- By 2100
- 2,930,528 · +191.7%
Race, ethnicity, and origin ACS 2023
- Neighborhood character
- Diverse neighborhood (Simpson 0.61)
- Race & ethnicity
- Hispanic / Latino 56% White 23% Two or more races 21% Black 12% Asian 7%
- Hispanic origin (detail)
- Mexican 46%
- Common ancestry
- Romanian 1% Lithuanian 1% Slovak 1%
- Foreign-born
- 18% · Canada, China, Vietnam
- Languages at home
- 57% English-only · Spanish 35% Tagalog/Filipino 2% Other Indo-European 1%
Political lean MEDSL · Fort Bend
- 2024 margin
- Toss-up / Even · D 49.5% · R 47.9% · Other 2.6%
- 2008→2024 swing
- +4.0pp toward D · 2008: -2.4pp · 2024: 1.6pp
- All cycles
- 2024: D+1.6 2020: D+10.6 2016: D+6.6 2012: R+6.8 2008: R+2.4
Not yet ingested
- Civics
- —
Market trends
- HPI YoY
- ▼ -74.06%
- Current HPI
- 309.5425
- Rent YoY
- ▼ -0.97%
- Metro
- Houston-The Woodlands-Sugar Land, TX
- State GDP YoY
- ▲ 3.95%
- F500 in state
- 110
Industry mix (Fortune 500 HQ in TX)
| Industry | F500 HQs | Revenue |
|---|---|---|
| Energy | 16 | $1,198B |
|
||
| Technology | 5 | $198B |
|
||
| Engineering / Construction | 4 | $72B |
|
||
| Energy Services | 3 | $60B |
|
||
| Utilities | 3 | $41B |
|
||
| Healthcare | 2 | $330B |
|
||
Price history
+8566.7% since first listed3 events — show timeline
- 2026-06-18 Listed $130,000 HARMLS
- 2026-06-17 Listed for Rent $1,500 HARMLS
- 1999-04-30 Sold (Public Records) — Public Records
Property tax history
+4.0%/yrLatest (2025): $2,745 · -22.8% YoY. Source: county tax records.
Cash-flow waterfall
monthlySold comps — $/sqft
last 12 mo · ≤1 miLoading sold comps…