657 Lebec #27 · Lebec, CA
Flood risk 7/10 · Major
- FEMA flood zone
- X (shaded)
- Chance of flooding over 30 yrs
- 0.78%
- Est. flood insurance / yr
- $507 – $1,088
Fire risk 9/10 · Severe
- Est. fire insurance / yr
- $659 – $1,223
Heat risk 4/10 · Minor
- Hot days now (above 93°F)
- 8 days/yr
- Hot days in 30 yrs
- 20 days/yr
Wind risk 1/10 · Minimal
- Chance of severe wind over 30 yrs
- —
Air-quality risk 7/10 · Major
- Unhealthy air days now
- 13 days/yr
- Unhealthy air days in 30 yrs
- 15 days/yr
Risk factors via First Street. Map © Google.
Why this score? — see what drove the B grade
The composite is a weighted blend of 9 inputs, each scored 0–100. Each bar is that input's sub-score; the figure is the points it added to the 100-point composite (weight × sub-score).
- Cash flow +30.0/30.0
- 1% rule +10.0/10.0
- DSCR +10.0/10.0
- ARV discount +7.5/15.0
- Appreciation +5.1/10.0
- Rent growth +2.5/5.0
- Schools +2.5/10.0
- Condition / age +2.5/5.0
- Livability +2.4/5.0
$75,000
🖨 Deal sheet 📄 Offer letter ✓ Due diligence
Listing remarks MLS
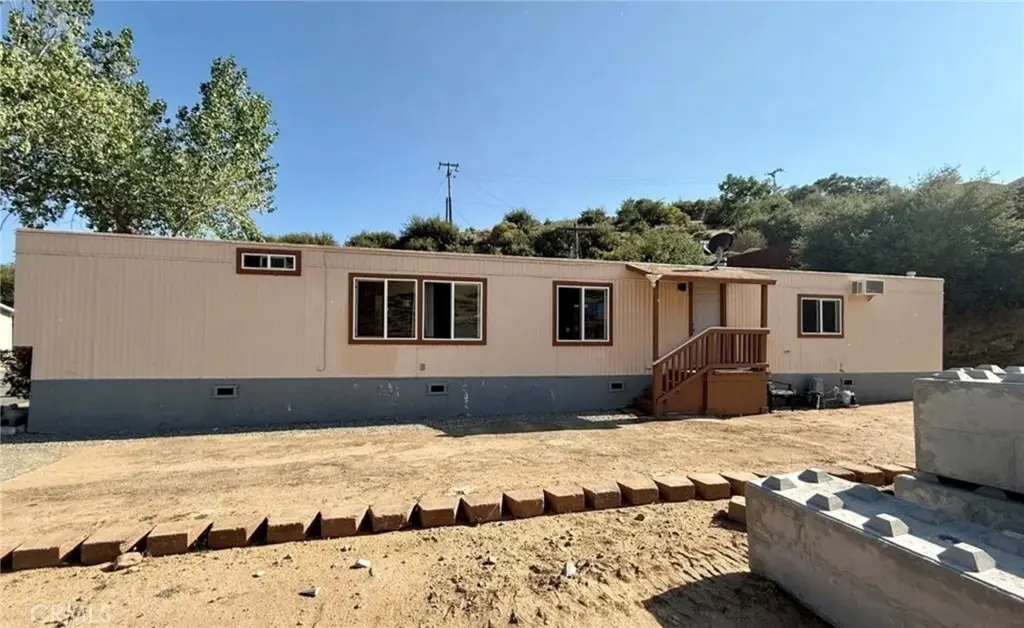
Don’t miss this incredible opportunity to own a charming two-bedroom, one-bath manufactured home in a peaceful, well-maintained community. Perfectly positioned near Interstate 5, this home offers effortless commuting while keeping you close to everything that matters. Enjoy being just minutes from premier shopping at Tejon Outlets and great dining options, including Hard Rock Cafe. Whether you’re a first-time buyer, downsizing, or looking for a smart investment, this move-in-ready home checks all the boxes.
Key facts
- Built 1977
- Listed 57 days
Neighborhood map
What this means for you Summary
Snapshot
- This is a 2-bed/1.0-bath manufactured listed at $75k.
Deal economics
- At list price, monthly cash flow is $620 ($7k/yr) — positive.
- The deal already cash-flows at list — no discount required.
- Meets the 1% rule at list price ($2k rent vs $75k).
- Recommended offer: $73k (3.0% below list) — sets the bar for market timing.
Location & tenants
- Location reads 48/100 on livability (#1,210 in CA) — a working-class tenant base; expect higher turnover. Strengths: crime B+; Watch: cost of living C-, housing D+, schools F.
- El Tejon Unified (rural): math 13% / reading 45% proficiency, ranked #361 of 517 in CA (top 70%) — low school quality limits family demand, transient renter base, plan for 1-2y turnover.
- Market conditions: 26 active listings in the ZIP; 3,244 units permitted in Kern County in 2024 (73 in 5+ unit buildings).
Forward outlook
- In year one you build about $738 of equity ($519 loan paydown + $219 appreciation (0.3% local appreciation)).
- Kern County population projected at +17% by 2050 — long-run rental-demand tailwind backs the buy-and-hold thesis.
- At projected returns (0.3% appreciation + 3.0% rent growth), your $21k cash investment doubles in ~3 years — after that, you're playing with house money.
Negotiation context
- It's been on market 58 days — a 3% lower offer ($73k) is reasonable based on typical stale-listing flexibility.
- 5 sale attempts since 2y ago with the ask held roughly flat each time — persistent listings suggest the price (not the market) is what's stuck; bring a comps-based counter.
Risks & watch-outs
- Watch-outs: flood insurance adds $66/mo.
- Climate carrying-cost: major flood risk; severe wildfire risk — expect insurance premiums to compound above CPI over the hold.
Questions for the listing agent
- It's been on market 58 days. Have you received any prior offers? Is the seller open to a 3% concession, seller financing, or rate buy-down credit?
- Built in 1977 — when were the roof, HVAC, electrical panel, plumbing, and water heater last replaced?
- What's the actual annual flood-insurance premium (NFIP or private), and is the property in a SFHA with mandatory coverage?
- Is there a deadline driving the sale (1031 exchange, divorce, estate, relocation)? That informs how much negotiation room exists.
- Schools are F-rated, which usually means shorter tenancies and higher turnover. Who's the typical renter profile here, and what's been the actual vacancy rate?
- What's the average days-on-market for RENTAL listings here right now (not sales)? A rising rental-DOM trend means longer vacancies and softer asking-rent achievability than the comps imply.
- What's the recent tenant-quality profile in this submarket — average credit score on applications, eviction rate, late-payment / NSF rate, and stable-employment percentage? A property-management company in the area should have these aggregated.
- How much new for-sale + rental construction is in the pipeline within 1–3 miles? Heavy new supply typically softens prices + rents 12–24 months out; constrained supply supports both.
Investment metrics
- 1% rule
- 2.03% ✓
- Cap rate
- 17.27%
- Cash-on-cash
- 39.20%
- DSCR
- 2.74
- GRM
- 4.1
CMA / ARV
- ARV (on-the-fly)
- $45,144
- Comps found
- 1
Show comp detail 1 sale within ~0.75 mi
| Address | Dist | Beds/Ba | Sqft | Sold | Price | $/sf | Match |
|---|---|---|---|---|---|---|---|
| 657 Lebec Rd #42 | 0.00mi | 3/1.0 (+1) | 900 (+14%) | 18mo | $50,850 | $57 | 57 |
Match score weights: distance 35% · size 25% · config 20% · recency 20%. Top-matched comps best support the ARV.
Projected returns pro-forma
0.29% appreciation · 3.0% rent growth · sell at horizon
- IRR
- 36.7%
- Equity multiple
- 2.83×
- Total profit
- $38,364
- Equity at exit
- $22,878
- IRR
- 39.7%
- Equity multiple
- 5.55×
- Total profit
- $95,499
- Equity at exit
- $28,394
Cash invested: $21,000 (down + closing). Projections, not guarantees.
Landlord ↔ Tenant lean methodology
- Overall (STATE)
- 18 Strongly Tenant-Friendly
- State California
- 18 Strongly Tenant-Friendly · D+13
- County
- — inherits STATE
- City
- — inherits STATE
ZIP-level market 93243
- Home prices YoY
- 0.1%
- Active inventory
- 26
- Price-to-rent
- 4.1×
Monthly cashflow live
- Estimated rent
- $1,524 medium interval (Pro) →
- Mortgage (P&I)
- −$393
- Tax est. 1.5%
- −$94 /mo · $1,125/yr
- Insurance
- −$31
- Flood insurance flood zone
- −$66 /mo · $798/yr
- HOA
- −$0
- Vacancy / Maint / Mgmt
- −$320
- Net cashflow
- $620
Break-even live
UW: 25.0% down · 7.5% · 30yr · 1.5% tax · 5.0% vac · 8.0% maint · 8.0% mgmt
Financing live
Cash to close
- Down payment
- $18,750
- Closing costs
- $2,250
- Reserves months
- —
- Total cash needed
- —
Loan-product check · same deal, 3 products live
Conventional
25% down · 7.5% · 30yr
- Down + closing
- —
- Monthly P&I
- —
- Monthly cashflow
- —
- DSCR
- —
- Eligible?
- —
Personal DTI + credit; lowest rate.
DSCR
20% down · 8.5% · 30yr
- Down + closing
- —
- Monthly P&I
- —
- Monthly cashflow
- —
- DSCR
- —
- Eligible?
- —
No personal income docs; deal must DSCR.
Hard money
10% down · 12.0% · 12mo
- Down + closing
- —
- Monthly P&I
- —
- Monthly cashflow
- —
- DSCR
- —
- Eligible?
- —
Short-term bridge; refi at stabilization.
Listing history 25 events
-
2026-06-18days on market $75,000 Active 58 DOM
-
2026-06-17days on market $75,000 Active 57 DOM
-
2026-06-16days on market $75,000 Active 56 DOM
-
2026-06-15days on market $75,000 Active 55 DOM
-
2026-06-14days on market $75,000 Active 53 DOM
-
2026-06-13days on market $75,000 Active 52 DOM
-
2026-06-10days on market $75,000 Active 50 DOM
-
2026-06-09days on market $75,000 Active 49 DOM
-
2026-06-08days on market $75,000 Active 48 DOM
-
2026-06-07days on market $75,000 Active 47 DOM
-
2026-06-05days on market $75,000 Active 44 DOM
-
2026-06-03days on market $75,000 Active 43 DOM
-
2026-06-03days on market $75,000 Active 42 DOM
-
2026-06-01days on market $75,000 Active 41 DOM
-
2026-05-31days on market $75,000 Active 40 DOM
-
2026-04-21$75,000 Active 524-char remark
Show marketing remark (524 chars)
Don’t miss this incredible opportunity to own a charming two-bedroom, one-bath manufactured home in a peaceful, well-maintained community. Perfectly positioned near Interstate 5, this home offers effortless commuting while keeping you close to everything that matters. Enjoy being just minutes from premier shopping at Tejon Outlets and great dining options, including Hard Rock Cafe. Whether you’re a first-time buyer, downsizing, or looking for a smart investment, this move-in-ready home checks all the boxes.
-
2026-03-27historical
-
2026-03-13status Active
-
2026-02-19status Pending Sale
-
2026-01-25status Active
-
2025-12-11status Pending Sale
-
2025-08-18price $75,000
-
2025-07-09$85,000 Active
-
2024-11-12historical
-
2024-08-15$85,000 Active
ⓘ Source: listings_history table (triggers on properties + properties_extension) + one-shot
backfill from property_details.listing_events for pre-trigger history.
Climate risk First Street
- Flood 7/10 Severe FEMA zone X (shaded) · 78% chance over 30 yrs
- Wildfire 9/10 Extreme
- Heat 4/10 Moderate 8 d/yr ≥93°F today · 20 d/yr by 30 yrs out
- Wind 1/10 Low
- Air quality 7/10 Severe 13 unhealthy d/yr today · 15 by 30 yrs out
Nearby sold comps map
Loading sold comps map…
Walkable amenities ~0.75 mi
Loading nearby amenities…
Taxation est. · year 1
- Rental income
- $18,294
- − Mortgage interest
- −$4,201
- − Property taxes
- −$1,125
- − Insurance
- −$1,172
- − Repairs & maintenance
- −$1,463
- − Management
- −$1,463
- − Depreciation
- −$2,182
- Taxable income
- $6,686
- Est. tax owed @ 24.0%
- −$1,605
- After-tax cash flow
- $5,830/yr
For passive investors: Depreciation is non-cash, so a rental often shows a tax loss while cash-flowing — sheltering income. Rental losses are passive: they offset passive income freely, and up to $25,000/yr can offset ordinary (W-2) income if you actively participate and your MAGI is under $100k (phasing out to $0 by $150k); unused losses carry forward. On sale, claimed depreciation is recaptured at up to 25%, and gains may owe capital-gains tax (a 1031 exchange can defer both). Figures are a year-1 estimate at your 24.0% rate — not tax advice; consult a CPA.
Schools (NCES district)
- District
- El Tejon Unified
- NCES district ID
- 0600026
- Math proficiency
- 13% ▼ -12.00%
- Reading proficiency
- 45% ▼ -2.00%
- Median HH income
- $49,019
- Composite
- 25.15/100
- National rank
- #7519
- State rank
- #361 of 517 in CA
Livability — Lebec
- Score
- 48/100
- State rank
- #1210
- US rank
- #26134
Category grades
Schools grade is shown separately in the Schools card above.
Census & demographics
- Census place
- Lebec, CA
- Population (ZIP)
- 900
Population outlook (Kern County) Hauer SSP2
- Today (2025)
- 947,286 people
- By 2030
- 978,984 · +3.3%
- By 2040
- 1,045,018 · +10.3%
- By 2050
- 1,105,232 · +16.7%
- By 2075
- 1,229,538 · +29.8%
- By 2100
- 1,238,059 · +30.7%
Race, ethnicity, and origin ACS 2023
- Neighborhood character
- Diverse neighborhood (Simpson 0.61)
- Race & ethnicity
- White 54% Hispanic / Latino 31% Two or more races 11% Asian 10% Native American 4%
- Hispanic origin (detail)
- Mexican 25% Cuban 5%
- Common ancestry
- Scottish 7% German 5% Portuguese 3%
- Foreign-born
- 16% · South Korea, Canada
- Languages at home
- 74% English-only · Spanish 15% Korean 9% Tagalog/Filipino 2%
Political lean MEDSL · Kern
- 2024 margin
- Strong R (+21.1) · D 38.2% · R 59.3% · Other 2.5%
- 2008→2024 swing
- -3.3pp toward R · 2008: -17.8pp · 2024: -21.1pp
- All cycles
- 2024: R+21.1 2020: R+10.2 2016: R+15.0 2012: R+20.9 2008: R+17.8
Not yet ingested
- Civics
- —
Market trends
- HPI YoY
- ▲ 0.29%
- Current HPI
- 343.2452
- Rent YoY
- —
- Metro
- —
- State GDP YoY
- ▲ 3.21%
- F500 in state
- 116
Industry mix (Fortune 500 HQ in CA)
| Industry | F500 HQs | Revenue |
|---|---|---|
| Technology | 27 | $1,492B |
|
||
| Financial Services | 3 | $174B |
|
||
| Retail | 3 | $44B |
|
||
| Insurance | 3 | $26B |
|
||
| Media / Entertainment | 2 | $115B |
|
||
| Pharmaceuticals / Biotech | 2 | $62B |
|
||
Price history
-11.8% since first listed10 events — show timeline
- 2026-04-21 Listed $75,000 CRMLS
- 2026-03-27 Listing Removed — CRMLS
- 2026-03-13 Relisted — CRMLS
- 2026-02-19 Pending — CRMLS
- 2026-01-25 Relisted — CRMLS
- 2025-12-11 Pending — CRMLS
- 2025-08-18 Price Changed $75,000 CRMLS
- 2025-07-09 Listed $85,000 CRMLS
- 2024-11-12 Listing Removed — CRMLS
- 2024-08-15 Listed $85,000 CRMLS
Cash-flow waterfall
monthlySold comps — $/sqft
last 12 mo · ≤1 miLoading sold comps…