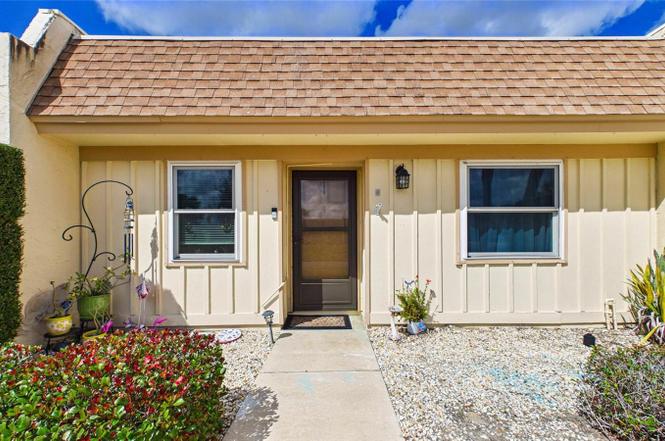
11117 Pembridge Ct #2 · Bayonet Point, FL
Flood risk 1/10 · Minimal
- FEMA flood zone
- X (unshaded)
- Chance of flooding over 30 yrs
- 0.0%
- Est. flood insurance / yr
- $507 – $1,088
Fire risk 2/10 · Minimal
- Est. fire insurance / yr
- $947 – $1,759
Heat risk 10/10 · Severe
- Hot days now (above 108°F)
- 7 days/yr
- Hot days in 30 yrs
- 25 days/yr
Wind risk 10/10 · Severe
- Chance of severe wind over 30 yrs
- 99.0%
Air-quality risk 2/10 · Minimal
- Unhealthy air days now
- 1 days/yr
- Unhealthy air days in 30 yrs
- 3 days/yr
Risk factors via First Street. Map © Google.
Why this score? — see what drove the C- grade
The composite is a weighted blend of 9 inputs, each scored 0–100. Each bar is that input's sub-score; the figure is the points it added to the 100-point composite (weight × sub-score).
- Cash flow +16.8/30.0
- 1% rule +10.0/10.0
- ARV discount +7.5/15.0
- DSCR +5.2/10.0
- Schools +4.3/10.0
- Livability +3.5/5.0
- Rent growth +2.8/5.0
- Condition / age +2.5/5.0
- Appreciation +0.0/10.0
$96,000
🖨 Deal sheet 📄 Offer letter ✓ Due diligence
Listing remarks MLS
PERFECT SNOWBIRD RETREAT OR YEAR-ROUND RESIDNECE. FOYER ENTRY WITH CERAMIC TILE. BERBER CARPET, MIRRORED WALL IN DR. LR OPENS TO SCREENED PORCH. MBR HAS WALK-IN CLOSET & STACKABLE W/ D. SPACIOUS BATH. NEW GLASS-TOP RANGE IN KITCHEN W/ SPACE FOR SMALL BREAKFAST TABLE. MAINE FEE COVERS EVERYTHING EXCEPT ELECTRIC & PHONE. MUST OWN 2 YRS BEFORE RENTING. NOT HOMESTEADED FOR 2010. ENJOY POOL JUST DOWN THE STREET OR THE LARGE CLUBHOUSE & HEATED POOL & ALL THE ACTIVITIES INTHIS ACTIVE RETIREMENT COMMUNITY. FURNISHINGS INCLUDED
Key facts
- Clubhouse
- In ground spa
- Screened porch
Tags
Property features AI
Finance
- Other: Unfurnished; Homestead exemption indicated
- Financial info: Total monthly fees: $608; Total annual fees: $7,296; Lease restrictions apply
- HOA & community: Monthly HOA fee of $558; Additional monthly maintenance $50; Association amenities: cable TV, clubhouse, fitness center, pool; Association includes: cable TV, pool, electricity, insurance, internet, structure and grounds maintenance, management; Buyer approval required for association; Association recreation owned, clubhouse, deed restrictions, sidewalks, street lights; Pets not allowed; Association approval required
Exterior
- Parking: Has carport (1 space)
- Utilities: Public water; Public sewer; Electricity connected; Cable connected; Internet available; Sewer connected; Water connected
- Home design: Residential condominium; Planned unit development (PUD); One story; Faces south; Floor 1 unit
- Construction: Block construction; Built-up roof; Shingle roof; Block foundation; Built in 1 story
- Exterior features: Lighting; Private mailbox; Storage; Asphalt road access
Interior
- Kitchen: Range; Refrigerator
- Bedrooms: 2 bedrooms (1st floor)
- Flooring: Ceramic tile
- Bathrooms: 1 full bathroom
- Heating & cooling: Central heating; Central air conditioning
- Interior features: Ceiling fans; Living room / dining room combo; Exhaust fan
- Laundry & utility: Washer; Dryer; Laundry closet; Electric water heater
Neighborhood map
What this means for you Summary
Snapshot
- This is a 2-bed/1.0-bath condo listed at $96k.
Deal economics
- At list price, monthly cash flow is $62 ($746/yr) — positive.
- The deal already cash-flows at list — no discount required.
- Meets the 1% rule at list price ($2k rent vs $96k).
- Recommended offer: $87k (9.0% below list) — sets the bar for market timing.
- Cap rate 7.1% vs local median 5.3% in Bayonet Point — top-decile yield for the area; either an underpriced asset or a hidden risk that comps aren't pricing in. Stress-test before assuming the spread holds.
Location & tenants
- Location reads 69/100 on livability (#485 in FL) — a middle-class / working-renter tenant base. Strengths: cost of living A+, housing A+, health & safety A+; Watch: crime D+, amenities D+, schools F.
- Pasco (suburban): math 50% / reading 52% proficiency, ranked #32 of 73 in FL (top 44%) — acceptable for families but not a draw, mixed tenant base, ~2y average lease.
- Market conditions: Rents rising (+1.3%/yr); 577 active listings in the ZIP; 35 comparable units currently listed for rent nearby; rentals at typical pace (median 24d on market — plan ~3-4 weeks tenant-placement turnaround); 6,765 units permitted in Pasco County in 2024 (1,250 in 5+ unit buildings).
- This rent runs 41% of the median local income ($47k/yr) — at the standard rent-burdened threshold; future hikes will face affordability resistance.
Forward outlook
- Local home prices are declining (-3.0%/yr); year-one equity from $664 of loan paydown is wiped out by about $3k of value loss. Plan a longer hold.
- Pasco County population projected at +29% by 2050 — long-run rental-demand tailwind backs the buy-and-hold thesis.
Negotiation context
- It's been on market 118 days — a 9% lower offer ($87k) is reasonable based on typical stale-listing flexibility.
- 6 sale attempts since 22y ago; this cycle's ask has dropped $18k (16%) from the opening price — seller is motivated, your offer sets the floor, not the list.
- Current owner paid $29k; list at $96k implies a 231% gain — meaningful room to come down on a strong offer.
Risks & watch-outs
- Watch-outs: HOA is 37% of rent.
- Climate carrying-cost: severe wind risk, 99% chance of damaging wind over 30y; extreme-heat days projected 7→25/yr by 2055 (HVAC capex compounding) — expect insurance premiums to compound above CPI over the hold.
Questions for the listing agent
- It's been on market 118 days. Have you received any prior offers? Is the seller open to a 9% concession, seller financing, or rate buy-down credit?
- Built in 1974 — when were the roof, HVAC, electrical panel, plumbing, and water heater last replaced?
- What does the HOA fee cover, when was the last increase, and are there any pending special assessments or reserve-fund shortfalls?
- Any open or pending special assessments — roof, HVAC, plumbing, elevator, façade? What's the per-unit balance and payoff schedule, and is the seller paying it off at close or rolling it to the buyer?
- Why hasn't it sold? Are there any deal-killer items the seller is aware of (foundation, flood, title, zoning, code violations)?
- Is there a deadline driving the sale (1031 exchange, divorce, estate, relocation)? That informs how much negotiation room exists.
- Schools are F-rated, which usually means shorter tenancies and higher turnover. Who's the typical renter profile here, and what's been the actual vacancy rate?
- Crime grade is D in this area — have there been break-ins, vandalism, or insurance claims at this property in the last 3 years? What carrier currently insures it and at what premium?
- What's the average days-on-market for RENTAL listings here right now (not sales)? A rising rental-DOM trend means longer vacancies and softer asking-rent achievability than the comps imply.
- What's the recent tenant-quality profile in this submarket — average credit score on applications, eviction rate, late-payment / NSF rate, and stable-employment percentage? A property-management company in the area should have these aggregated.
- How much new apartment / multifamily construction is in the pipeline within 1–3 miles? Heavy new supply (>2% of stock underway) typically softens rents 12–24 months out; light construction supports rent growth.
Investment metrics
- 1% rule
- 1.70% ✓
- Cap rate
- 7.07%
- Cash-on-cash
- 2.77%
- DSCR
- 1.12
- GRM
- 4.9
CMA / ARV
No comps found within radius.
Projected returns pro-forma
-3.0% appreciation · 1.28% rent growth · sell at horizon
- IRR
- -15.0%
- Equity multiple
- 0.48×
- Total profit
- $-14,002
- Equity at exit
- $14,314
- IRR
- -11.8%
- Equity multiple
- 0.38×
- Total profit
- $-16,587
- Equity at exit
- $8,300
Cash invested: $26,880 (down + closing). Projections, not guarantees.
Landlord ↔ Tenant lean methodology
- Overall (STATE)
- 87 Strongly Landlord-Friendly
- State Florida
- 87 Strongly Landlord-Friendly · R+3
- County
- — inherits STATE
- City
- — inherits STATE
ZIP-level market 34668
- Home prices YoY
- -17.4%
- Rents YoY
- 1.3%
- Active inventory
- 577
- Price-to-rent
- 4.9×
Monthly cashflow live
- Estimated rent
- $1,630 high interval (Pro) →
- Mortgage (P&I)
- −$503
- Tax from tax record
- −$74 /mo · $892/yr
- Insurance
- −$40
- HOA
- −$608
- Vacancy / Maint / Mgmt
- −$342
- Net cashflow
- $62
Break-even live
UW: 25.0% down · 7.5% · 30yr · 1.5% tax · 5.0% vac · 8.0% maint · 8.0% mgmt
Financing live
Cash to close
- Down payment
- $24,000
- Closing costs
- $2,880
- Reserves months
- —
- Total cash needed
- —
Loan-product check · same deal, 3 products live
Conventional
25% down · 7.5% · 30yr
- Down + closing
- —
- Monthly P&I
- —
- Monthly cashflow
- —
- DSCR
- —
- Eligible?
- —
Personal DTI + credit; lowest rate.
DSCR
20% down · 8.5% · 30yr
- Down + closing
- —
- Monthly P&I
- —
- Monthly cashflow
- —
- DSCR
- —
- Eligible?
- —
No personal income docs; deal must DSCR.
Hard money
10% down · 12.0% · 12mo
- Down + closing
- —
- Monthly P&I
- —
- Monthly cashflow
- —
- DSCR
- —
- Eligible?
- —
Short-term bridge; refi at stabilization.
Rent comps 35 comps
| Address | Beds | Baths | Sqft | Rent | $/sqft | DOM | Units | Dist |
|---|---|---|---|---|---|---|---|---|
| 11138 Yellowwood Ln Unit NA Port Richey, FL | 3.0 | 1.0 | 1000 | $1,800 | $1.80 | 24d | 1 | 0.19mi |
| 8161 Braddock Cir #1 Port Richey, FL | 2.0 | 2.0 | 1000 | $1,595 | $1.59 | 17d | 1 | 0.22mi |
| 10802 Laburnum Dr Port Richey, FL | 2.0 | 2.0 | 1002 | $1,545 | $1.54 | 24d | 1 | 0.47mi |
| 7804 Topay Ln Port Richey, FL | 3.0 | 2.0 | 1125 | $1,811 | $1.61 | 5d | 1 | 0.50mi |
| 11611 Constance Dr Port Richey, FL | 3.0 | 1.0 | 984 | $1,540 | $1.57 | 24d | 1 | 0.54mi |
| 11611 Constance Dr Port Richey, FL | 3.0 | 1.0 | 984 | $1,540 | $1.57 | 11d | 1 | 0.54mi |
| 7715 Sue Ellen Dr Port Richey, FL | 2.0 | 2.0 | 1080 | $1,495 | $1.38 | 3d | 1 | 0.60mi |
| 7808 Talisman Dr Port Richey, FL | 3.0 | 2.0 | 1063 | $2,100 | $1.98 | 24d | 1 | 0.63mi |
| 7839 Canna Dr Port Richey, FL | 2.0 | 2.0 | 1095 | $1,450 | $1.32 | 11d | 1 | 0.66mi |
| 10502 Laburnum Dr Port Richey, FL | 2.0 | 2.0 | 1002 | $1,545 | $1.54 | 24d | 1 | 0.67mi |
| 11635 Salmon Dr Port Richey, FL | 2.0 | 1.5 | 816 | $1,500 | $1.84 | 24d | 1 | 0.68mi |
| 7539 Gulf Highlands Dr Port Richey, FL | 2.0 | 1.5 | 936 | $1,550 | $1.66 | 5d | 1 | 0.75mi |
| 7438 Coventry Dr Port Richey, FL | 2.0 | 1.0 | 985 | $1,600 | $1.62 | 12d | 1 | 0.78mi |
| 10803 Hyssop St Port Richey, FL | 3.0 | 1.0 | 1120 | $1,500 | $1.34 | 11d | 1 | 0.78mi |
| 12200 Hudson Ridge Dr Port Richey, FL | 2.0–3.0 | 2.0 | 1107 | $1,468 | $1.33 | 2d | 10 | 0.80mi |
| 11103 Harding Dr Unit 2 Port Richey, FL | 2.0 | 1.0 | 760 | $1,450 | $1.91 | 20d | 1 | 0.84mi |
| 10303 Gardenia Ln Port Richey, FL | 3.0 | 2.0 | 1054 | $1,950 | $1.85 | 24d | 1 | 0.91mi |
| 7213 Seward Dr Port Richey, FL | 2.0 | 1.0 | 700 | $1,500 | $2.14 | 24d | 1 | 0.94mi |
| 10225 Gardenia Ln Port Richey, FL | 3.0 | 1.0 | 1042 | $1,495 | $1.43 | 14d | 1 | 0.96mi |
| 10401 Oleander Dr Port Richey, FL | 2.0 | 1.0 | 887 | $1,250 | $1.41 | 24d | 1 | 0.99mi |
| 12027 Hoosier Ct #203 Hudson, FL | 2.0 | 2.0 | 1103 | $1,550 | $1.41 | 24d | 1 | 1.02mi |
| 11031 Hassle Ave Port Richey, FL | 3.0 | 1.0 | 1006 | $1,595 | $1.59 | 24d | 1 | 1.03mi |
| 12041 Hoosier Ct #204 Hudson, FL | 2.0 | 2.0 | 1103 | $1,495 | $1.36 | 24d | 1 | 1.05mi |
| 12041 Hoosier Ct #204 Hudson, FL | 2.0 | 2.0 | 1103 | $1,495 | $1.36 | 17d | 1 | 1.05mi |
| 8019 Portage Dr Port Richey, FL | 2.0 | 2.0 | 1078 | $2,000 | $1.86 | 16d | 1 | 1.12mi |
| 7110 Tudor Ln Port Richey, FL | 1.0 | 1.0 | 676 | $1,310 | $1.94 | 2d | 1 | 1.14mi |
| 7110 Tudor Ln Port Richey, FL | 1.0 | 1.0 | 676 | $1,310 | $1.94 | 24d | 1 | 1.14mi |
| 8422 Paxton Dr Port Richey, FL | 2.0 | 1.0 | 744 | $1,800 | $2.42 | 24d | 1 | 1.26mi |
| 12221 Holbrook Dr Bayonet Point, FL | 1.0–2.0 | 1.0–2.0 | 761 | $1,685 | $2.21 | 1d | 59 | 1.27mi |
| 7616 Danube Dr Hudson, FL | 2.0 | 2.0 | 1125 | $1,350 | $1.20 | 24d | 1 | 1.31mi |
| 7602 Danube Dr Unit 7602 Hudson, FL | 2.0 | 2.0 | 1125 | $1,600 | $1.42 | 24d | 1 | 1.32mi |
| 8304 Mill Creek Ln Hudson, FL | 2.0 | 2.0 | 1000 | $1,650 | $1.65 | 24d | 1 | 1.33mi |
| 9440 Bourbon St Unit 9 New Port Richey, FL | 2.0 | 1.0 | 700 | $1,275 | $1.82 | 24d | 1 | 1.38mi |
| 6731 Sandra Dr Port Richey, FL | 2.0 | 1.0 | 816 | $1,575 | $1.93 | 24d | 1 | 1.39mi |
| 8437 Luray Dr Port Richey, FL | 2.0 | 1.0 | 1038 | $1,595 | $1.54 | 4d | 1 | 1.46mi |
HOA detail condo
- Monthly dues
- $608 · $7,296/yr
- Likely covers
- electricpool
- Assessments
- None detected in remarks — confirm with the listing agent.
Listing history 31 events
-
2026-06-18days on market $96,000 Active 118 DOM
-
2026-06-17days on market $96,000 Active 117 DOM
-
2026-06-16days on market $96,000 Active 116 DOM
-
2026-06-15days on market $96,000 Active 115 DOM
-
2026-06-13days on market $96,000 Active 113 DOM
-
2026-06-09days on market $96,000 Active 109 DOM
-
2026-06-08days on market $96,000 Active 108 DOM
-
2026-06-07days on market $96,000 Active 107 DOM
-
2026-06-04days on market $96,000 Active 104 DOM
-
2026-06-03days on market $96,000 Active 103 DOM
-
2026-06-02days on market $96,000 Active 102 DOM
-
2026-06-01days on market $96,000 Active 101 DOM
-
2026-05-31days on market $96,000 Active 100 DOM
-
2026-05-13price $96,000
-
2026-04-14price $105,000
-
2026-02-20$114,000 Active
-
2010-10-12soldstatus $29,000
-
2010-10-01soldstatus $29,000 549-char remark
Show marketing remark (549 chars)
PERFECT SNOWBIRD RETREAT OR YEAR-ROUND RESIDNECE. FOYER ENTRY WITH CERAMIC TILE. BERBER CARPET, MIRRORED WALL IN DR. LR OPENS TO SCREENED PORCH. MBR HAS WALK-IN CLOSET & STACKABLE W/ D. SPACIOUS BATH. NEW GLASS-TOP RANGE IN KITCHEN W/ SPACE FOR SMALL BREAKFAST TABLE. MAINE FEE COVERS EVERYTHING EXCEPT ELECTRIC & PHONE. MUST OWN 2 YRS BEFORE RENTING. NOT HOMESTEADED FOR 2010. ENJOY POOL JUST DOWN THE STREET OR THE LARGE CLUBHOUSE & HEATED POOL & ALL THE ACTIVITIES INTHIS ACTIVE RETIREMENT COMMUNITY. FURNISHINGS INCLUDED
-
2010-03-22$29,900 549-char remark
Show marketing remark (549 chars)
PERFECT SNOWBIRD RETREAT OR YEAR-ROUND RESIDNECE. FOYER ENTRY WITH CERAMIC TILE. BERBER CARPET, MIRRORED WALL IN DR. LR OPENS TO SCREENED PORCH. MBR HAS WALK-IN CLOSET & STACKABLE W/ D. SPACIOUS BATH. NEW GLASS-TOP RANGE IN KITCHEN W/ SPACE FOR SMALL BREAKFAST TABLE. MAINE FEE COVERS EVERYTHING EXCEPT ELECTRIC & PHONE. MUST OWN 2 YRS BEFORE RENTING. NOT HOMESTEADED FOR 2010. ENJOY POOL JUST DOWN THE STREET OR THE LARGE CLUBHOUSE & HEATED POOL & ALL THE ACTIVITIES INTHIS ACTIVE RETIREMENT COMMUNITY. FURNISHINGS INCLUDED
-
2010-03-04historical
-
2009-12-29$34,900
-
2009-12-18historical
-
2009-10-26$49,900
-
2008-04-28$74,900
-
2004-10-05soldstatus $70,000
-
2004-09-30soldstatus $70,000
-
2004-08-27historical
-
2004-08-23$71,900
-
2003-02-11soldstatus $48,500
-
1997-10-22soldstatus $41,000
-
1994-12-15soldstatus $32,500
ⓘ Source: listings_history table (triggers on properties + properties_extension) + one-shot
backfill from property_details.listing_events for pre-trigger history.
Tax reassessment forecast FL · Resets to sale price
- Current annual tax
- $892 · $74/mo
- Projected year-2 tax
- $892 · $74/mo
- Expected delta
- $0/yr ($0/mo · 0.0%)
ⓘ Screening estimate from a state-policy table — verify with the county assessor before closing.
Climate risk First Street
- Flood 1/10 Low FEMA zone X (unshaded) · 0% chance over 30 yrs
- Wildfire 2/10 Low
- Heat 10/10 Extreme 7 d/yr ≥108°F today · 25 d/yr by 30 yrs out
- Wind 10/10 Extreme 99% chance of damaging wind over 30 yrs
- Air quality 2/10 Low 1 unhealthy d/yr today · 3 by 30 yrs out
Nearby sold comps map
Loading sold comps map…
Walkable amenities ~0.75 mi
Loading nearby amenities…
Taxation est. · year 1
- Rental income
- $19,563
- − Mortgage interest
- −$5,377
- − Property taxes
- −$892
- − Insurance
- −$480
- − Repairs & maintenance
- −$1,565
- − Management
- −$1,565
- − HOA
- −$7,296
- − Depreciation
- −$2,793
- Taxable loss
- −$405
- Est. tax savings @ 24.0%
- +$97
- After-tax cash flow
- $843/yr
For passive investors: Depreciation is non-cash, so a rental often shows a tax loss while cash-flowing — sheltering income. Rental losses are passive: they offset passive income freely, and up to $25,000/yr can offset ordinary (W-2) income if you actively participate and your MAGI is under $100k (phasing out to $0 by $150k); unused losses carry forward. On sale, claimed depreciation is recaptured at up to 25%, and gains may owe capital-gains tax (a 1031 exchange can defer both). Figures are a year-1 estimate at your 24.0% rate — not tax advice; consult a CPA.
Schools (NCES district)
- District
- Pasco
- NCES district ID
- 1201530
- Math proficiency
- 50% ▼ -10.00%
- Reading proficiency
- 52% ▼ -5.00%
- Median HH income
- $45,039
- Composite
- 43.14/100
- National rank
- #3074
- State rank
- #32 of 73 in FL
Livability — Bayonet Point
- Score
- 69/100
- State rank
- #485
- US rank
- #8934
Category grades
Schools grade is shown separately in the Schools card above.
Census & demographics
- Census place
- Bayonet Point, FL
- County
- Pasco County · 524,098 people
- Metro
- Tampa-St. Petersburg-Clearwater, FL
- Population (ZIP)
- 49,442
- Household income
- $47,401
- Rent vs Own
- Severe rent burden
- 2699.0
Population outlook (Pasco County) Hauer SSP2
- Today (2025)
- 570,045 people
- By 2030
- 605,844 · +6.3%
- By 2040
- 674,806 · +18.4%
- By 2050
- 736,022 · +29.1%
- By 2075
- 862,900 · +51.4%
- By 2100
- 906,364 · +59.0%
Race, ethnicity, and origin ACS 2023
- Neighborhood character
- Predominantly White (70%)
- Race & ethnicity
- White 70% Hispanic / Latino 23% Two or more races 14% Black 4%
- Hispanic origin (detail)
- Mexican 3% Puerto Rican 10% Cuban 5% Dominican 1%
- Common ancestry
- Romanian 3% Lithuanian 3% Slovak 2%
- Foreign-born
- 11% · Canada, Jamaica
- Languages at home
- 82% English-only · Spanish 14% Other Indo-European 1% French/Haitian/Cajun 1%
Political lean MEDSL · Pasco
- 2024 margin
- Strong R (+25.2) · D 36.9% · R 62.1% · Other 1.0%
- 2008→2024 swing
- -21.6pp toward R · 2008: -3.6pp · 2024: -25.2pp
- All cycles
- 2024: R+25.2 2020: R+20.1 2016: R+21.6 2012: R+6.7 2008: R+3.6
Not yet ingested
- Civics
- —
Market trends
- HPI YoY
- ▼ -75.64%
- Current HPI
- 359.7163
- Rent YoY
- ▲ 1.28%
- Metro
- Tampa-St. Petersburg-Clearwater, FL
- State GDP YoY
- ▲ 3.28%
- F500 in state
- 36
Industry mix (Fortune 500 HQ in FL)
| Industry | F500 HQs | Revenue |
|---|---|---|
| Industrial Technology | 2 | $29B |
|
||
| Insurance | 2 | $17B |
|
||
| Retail | 1 | $60B |
|
||
| Technology Distribution | 1 | $58B |
|
||
| Homebuilding | 1 | $35B |
|
||
| Technology Manufacturing | 1 | $35B |
|
||
Price history
+195.4% since first listed18 events — show timeline
- 2026-05-13 Price Changed $96,000 Stellar MLS as Distributed by MLS Grid
- 2026-04-14 Price Changed $105,000 Stellar MLS as Distributed by MLS Grid
- 2026-02-20 Listed $114,000 Stellar MLS as Distributed by MLS Grid
- 2010-10-12 Sold (Public Records) $29,000 Public Records
- 2010-10-01 Sold (MLS) $29,000 Stellar MLS as Distributed by MLS Grid
- 2010-03-22 Listed $29,900 Stellar MLS as Distributed by MLS Grid
- 2010-03-04 Listing Removed — Stellar MLS as Distributed by MLS Grid
- 2009-12-29 Listed $34,900 Stellar MLS as Distributed by MLS Grid
- 2009-12-18 Listing Removed — Stellar MLS as Distributed by MLS Grid
- 2009-10-26 Listed $49,900 Stellar MLS as Distributed by MLS Grid
- 2008-04-28 Listed $74,900 Stellar MLS as Distributed by MLS Grid
- 2004-10-05 Sold (Public Records) $70,000 Public Records
- 2004-09-30 Sold (MLS) $70,000 Stellar MLS as Distributed by MLS Grid
- 2004-08-27 Listing Removed — Stellar MLS as Distributed by MLS Grid
- 2004-08-23 Listed $71,900 Stellar MLS as Distributed by MLS Grid
- 2003-02-11 Sold (Public Records) $48,500 Public Records
- 1997-10-22 Sold (Public Records) $41,000 Public Records
- 1994-12-15 Sold (Public Records) $32,500 Public Records
Property tax history
+18.8%/yrLatest (2025): $892 · +2.7% YoY. Source: county tax records.
Cash-flow waterfall
monthlySold comps — $/sqft
last 12 mo · ≤1 miLoading sold comps…