 🏗️ New Construction
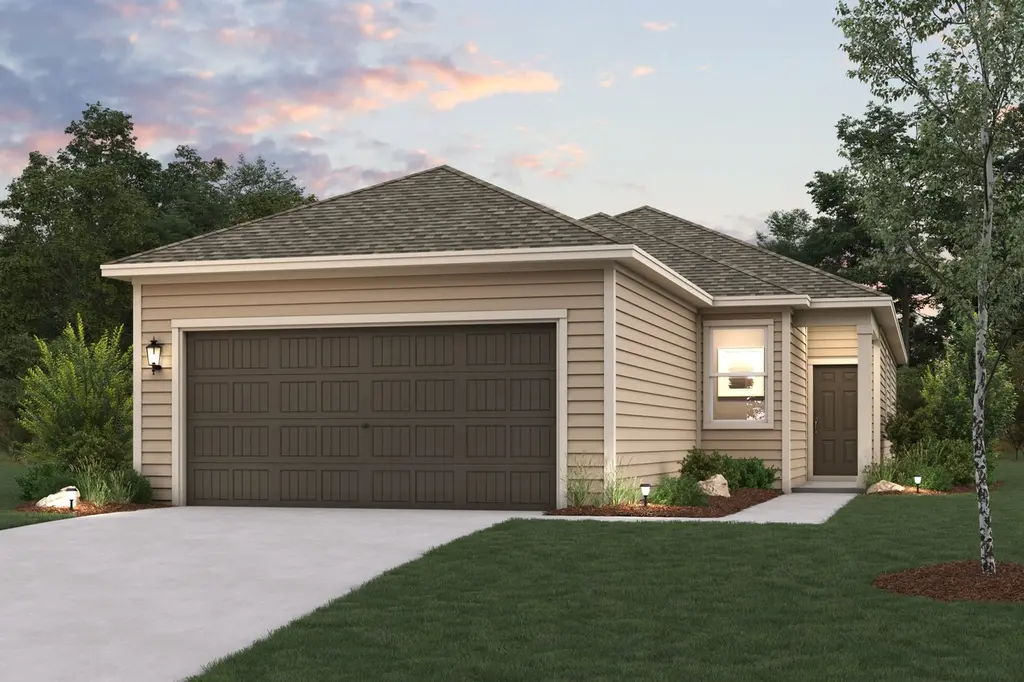
Isabella - 1585 Plan · San Antonio, TX
Flood risk No data
- FEMA flood zone
- —
- Chance of flooding over 30 yrs
- —
- Est. flood insurance / yr
- —
Fire risk No data
- Est. fire insurance / yr
- —
Heat risk No data
- Hot days now (above threshold)
- —
- Hot days in 30 yrs
- —
Wind risk No data
- Chance of severe wind over 30 yrs
- —
Air-quality risk No data
- Unhealthy air days now
- —
- Unhealthy air days in 30 yrs
- —
Risk factors via First Street. Map © Google.
Why this score? — see what drove the D grade
The composite is a weighted blend of 9 inputs, each scored 0–100. Each bar is that input's sub-score; the figure is the points it added to the 100-point composite (weight × sub-score).
- Appreciation +10.0/10.0
- Cash flow +7.7/30.0
- ARV discount +7.5/15.0
- Livability +4.0/5.0
- Rent growth +2.7/5.0
- Condition / age +2.5/5.0
- 1% rule +2.3/10.0
- Schools +2.2/10.0
- DSCR +1.8/10.0
$254,990
🖨 Deal sheet 📄 Offer letter ✓ Due diligence
Listing remarks MLS
Welcome to the Isabella at Park Place, where elegance meets versatility in a single-story floor plan. This home embraces the open-concept lifestyle, with its seamlessly connected great room, dining area, and kitchen-a layout perfect for everything from entertaining to game night. The owner's suite features a private bathroom and a large walk-in closet, and the remaining three bedrooms share a bath with dual vanities. Options may include: Covered patio PLEASE NOTE: PHOTOS OF THE HOME ABOVE ARE NOT THE ACTUAL HOME, BUT A REPRESENTATION OF THE FLOOR PLAN. Prices, plans, and terms are effective on the date of publication and subject to change without notice. Square footage/dimensions shown is only an estimate and actual square footage/dimensions will differ. Buyer should rely on his or her own evaluation of usable area. Depictions of homes or other features are artist conceptions. Hardscape, landscape, and other items shown may be decorator suggestions that are not included in the purchase price and availability may vary. No view is promised. Views may also be altered by subsequent development, construction, and landscaping growth. ©2025 Century Communities,
Key facts
- Covered patio
- Open-concept layout
- 2 garage spots
Tags
Neighborhood map
What this means for you Summary
Snapshot
- This is a 4-bed/2.0-bath single-family listed at $255k.
Deal economics
- At list price, monthly cash flow is $-298 ($-4k/yr) — negative.
- To cash-flow at today's rent, offer at most $213k (16.3% below list).
- To meet the 1% rule (rent ≥ 1% of price), the offer needs to be $187k (26.8% below list).
- Recommended offer: $187k (26.8% below list) — sets the bar for 1% rule.
- Cap rate 4.9% vs local median 3.8% in San Antonio — meaningfully above typical; check what's discounted (condition, days-on-market, listing class) to confirm the premium yield is real.
Location & tenants
- Location reads 80/100 on livability (#31 in TX, #1,616 nationally) — a professional / high-income tenant draw. Strengths: amenities A+, commute A+, cost of living A+; Watch: schools C-, crime F.
- Southwest ISD (rural): math 21% / reading 31% proficiency, ranked #701 of 826 in TX (top 85%) — low school quality limits family demand, transient renter base, plan for 1-2y turnover; 75% free/reduced lunch — lower-income household profile, screen leases tightly.
- Market conditions: Rents flat; 274 active listings in the ZIP; 40 comparable units currently listed for rent nearby; rentals lingering (median 44d on market — plan ~5-8 weeks vacancy on turnover, expect pricing pressure); 50% of comp listings sitting > 30 days — soft ceiling on asking rent; 8,308 units permitted in Bexar County in 2024 (2,506 in 5+ unit buildings).
- This rent runs 37% of the median local income ($60k/yr) — at the standard rent-burdened threshold; future hikes will face affordability resistance.
Forward outlook
- In year one you build about $27k of equity ($2k loan paydown + $26k appreciation (10.0% local appreciation)).
- Bexar County population projected at +50% by 2050 — long-run rental-demand tailwind backs the buy-and-hold thesis.
- By year 2, paydown + projected appreciation supports a ~$44k cash-out refi (75% LTV) — recoverable capital for the next deal without selling this one.
Negotiation context
- It's been on market 650 days — a 12% lower offer ($224k) is reasonable based on typical stale-listing flexibility.
Questions for the listing agent
- What do current leases actually rent for vs. the listed asking? Can we see a recent rent roll and the last 12 months of T-12 income?
- It's been on market 650 days. Have you received any prior offers? Is the seller open to a 27% concession, seller financing, or rate buy-down credit?
- Why hasn't it sold? Are there any deal-killer items the seller is aware of (foundation, flood, title, zoning, code violations)?
- Is there a deadline driving the sale (1031 exchange, divorce, estate, relocation)? That informs how much negotiation room exists.
- Crime grade is F in this area — have there been break-ins, vandalism, or insurance claims at this property in the last 3 years? What carrier currently insures it and at what premium?
- The area grade is low — what's the realistic commute time and amenity access for the typical tenant pool here? Any planned neighborhood developments (good or bad) we should know about?
- What's the average days-on-market for RENTAL listings here right now (not sales)? A rising rental-DOM trend means longer vacancies and softer asking-rent achievability than the comps imply.
- What's the recent tenant-quality profile in this submarket — average credit score on applications, eviction rate, late-payment / NSF rate, and stable-employment percentage? A property-management company in the area should have these aggregated.
- How much new for-sale + rental construction is in the pipeline within 1–3 miles? Heavy new supply typically softens prices + rents 12–24 months out; constrained supply supports both.
Investment metrics
- 1% rule
- 0.73% ✗
- Cap rate
- 4.90%
- Cash-on-cash
- -4.98%
- DSCR
- 0.78
- GRM
- 11.5
CMA / ARV
- ARV (median comp)
- $256,624
- List price
- $254,990
- Delta
- -0.64%
- Verdict
- FAIR
- Comps
- 20 within 1.0 mi
Show comp detail 12 sales within ~0.75 mi
| Address | Dist | Beds/Ba | Sqft | Sold | Price | $/sf | Match |
|---|---|---|---|---|---|---|---|
| 2515 Dry Moss Way | 0.18mi | 4/2.0 | 1,590 (+0%) | 4mo | $279,990 | $176 | 88 |
| 10311 Eve Gdns | 0.27mi | 3/2.5 (-1) | 1,624 (+2%) | 4mo | $252,990 | $156 | 73 |
| 10318 Liberty Grv | 0.25mi | 4/2.5 | 1,745 (+10%) | 4mo | $280,990 | $161 | 67 |
| 10323 Fuji Ct | 0.17mi | 3/2.5 (-1) | 1,360 (-14%) | 1mo | $239,990 | $176 | 61 |
| 2518 Rambo Dr | 0.29mi | 4/2.5 | 1,802 (+14%) | 2mo | $289,990 | $161 | 60 |
| 2502 Rambo Dr | 0.31mi | 4/2.5 | 1,802 (+14%) | 3mo | $296,990 | $165 | 58 |
| 2503 Rambo Dr | 0.27mi | 3/2.0 (-1) | 1,388 (-12%) | 4mo | $263,265 | $190 | 58 |
| 2506 Rambo Dr | 0.30mi | 3/2.0 (-1) | 1,388 (-12%) | 4mo | $259,240 | $187 | 57 |
| 3027 Mission Gate | 0.27mi | 3/2.0 (-1) | 1,357 (-14%) | 4mo | $199,000 | $147 | 55 |
| 2006 Fishing Stone | 0.72mi | 4/2.0 | 1,692 (+7%) | 2mo | $230,000 | $136 | 53 |
| 2311 Crisp Gln | 0.50mi | 3/2.0 (-1) | 1,388 (-12%) | 3mo | $266,725 | $192 | 48 |
| 2302 Crisp Gln | 0.55mi | 4/2.5 | 1,802 (+14%) | 3mo | $299,990 | $166 | 47 |
Match score weights: distance 35% · size 25% · config 20% · recency 20%. Top-matched comps best support the ARV.
Projected returns pro-forma
10.0% appreciation · 0.83% rent growth · sell at horizon
- IRR
- 20.1%
- Equity multiple
- 2.63×
- Total profit
- $116,806
- Equity at exit
- $231,187
- IRR
- 18.0%
- Equity multiple
- 5.89×
- Total profit
- $351,567
- Equity at exit
- $498,563
Cash invested: $71,855 (down + closing). Projections, not guarantees.
Landlord ↔ Tenant lean methodology
- Overall (STATE)
- 87 Strongly Landlord-Friendly
- State Texas
- 87 Strongly Landlord-Friendly · R+5
- County
- — inherits STATE
- City
- — inherits STATE
ZIP-level market 78224
- Home prices YoY
- 12.4%
- Rents YoY
- 0.8%
- Active inventory
- 274
- Price-to-rent
- 11.4×
Monthly cashflow live
- Estimated rent
- $1,867 high interval (Pro) →
- Mortgage (P&I)
- −$1,346
- Tax est. 1.5%
- −$321 /mo · $3,849/yr
- Insurance
- −$107
- HOA
- −$0
- Vacancy / Maint / Mgmt
- −$392
- Net cashflow
- $-298
Break-even live
UW: 25.0% down · 7.5% · 30yr · 1.5% tax · 5.0% vac · 8.0% maint · 8.0% mgmt
Financing live
Cash to close
- Down payment
- $64,156
- Closing costs
- $7,699
- Reserves months
- —
- Total cash needed
- —
Loan-product check · same deal, 3 products live
Conventional
25% down · 7.5% · 30yr
- Down + closing
- —
- Monthly P&I
- —
- Monthly cashflow
- —
- DSCR
- —
- Eligible?
- —
Personal DTI + credit; lowest rate.
DSCR
20% down · 8.5% · 30yr
- Down + closing
- —
- Monthly P&I
- —
- Monthly cashflow
- —
- DSCR
- —
- Eligible?
- —
No personal income docs; deal must DSCR.
Hard money
10% down · 12.0% · 12mo
- Down + closing
- —
- Monthly P&I
- —
- Monthly cashflow
- —
- DSCR
- —
- Eligible?
- —
Short-term bridge; refi at stabilization.
Rent comps 40 comps
| Address | Beds | Baths | Sqft | Rent | $/sqft | DOM | Units | Dist |
|---|---|---|---|---|---|---|---|---|
| 2350 Redlove Dr San Antonio, TX | 3.0 | 2.5 | 1420 | $1,675 | $1.18 | 24d | 1 | 0.33mi |
| 2343 Applewhite Mdw San Antonio, TX | 4.0 | 2.5 | 1798 | $1,795 | $1.00 | 24d | 1 | 0.35mi |
| 2350 Dry Moss Way San Antonio, TX | 3.0 | 2.5 | 1420 | $1,650 | $1.16 | 43d | 1 | 0.35mi |
| 10127 State Highway 16 S San Antonio, TX | 2.0–4.0 | 2.0 | 1125 | $1,576 | $1.40 | 2d | 26 | 0.35mi |
| 2335 Applewhite Mdw San Antonio, TX | 3.0 | 2.5 | 1529 | $1,550 | $1.01 | 4d | 1 | 0.36mi |
| 2330 Redlove Dr San Antonio, TX | 3.0 | 2.5 | 1420 | $1,600 | $1.13 | 4d | 1 | 0.37mi |
| 2318 Applewhite Mdw San Antonio, TX | 4.0 | 2.5 | 1798 | $1,795 | $1.00 | 24d | 1 | 0.40mi |
| 2307 Applewhite Mdw San Antonio, TX | 4.0 | 2.5 | 1798 | $1,750 | $0.97 | 43d | 1 | 0.42mi |
| 10610 Apple Pie Rd San Antonio, TX | 3.0 | 2.5 | 1272 | $1,595 | $1.25 | 24d | 1 | 0.47mi |
| 2242 Fishing Trl San Antonio, TX | 4.0 | 2.5 | 1917 | $1,785 | $0.93 | 43d | 1 | 0.51mi |
| 2235 Fishing Trl San Antonio, TX | 4.0 | 2.5 | 1847 | $1,755 | $0.95 | 43d | 1 | 0.51mi |
| 2230 Fishing Trl San Antonio, TX | 4.0 | 2.5 | 1847 | $1,755 | $0.95 | 24d | 1 | 0.54mi |
| 2226 Fishing Trl San Antonio, TX | 3.0 | 2.5 | 1777 | $1,650 | $0.93 | 24d | 1 | 0.55mi |
| 2222 Fishing Trl San Antonio, TX | 4.0 | 2.5 | 1917 | $1,785 | $0.93 | 24d | 1 | 0.56mi |
| 12305 SW Loop 410 San Antonio, TX | 1.0–4.0 | 1.0–2.0 | 1036 | $1,607 | $1.55 | 16d | 1 | 0.60mi |
| 10527 Hunters Pond San Antonio, TX | 4.0 | 2.5 | 1510 | $1,395 | $0.92 | 43d | 1 | 0.61mi |
| 3263 Rancho Grande San Antonio, TX | 3.0 | 2.0 | 1500 | $1,650 | $1.10 | 24d | 1 | 0.62mi |
| 2115 Bigmouth Rod San Antonio, TX | 4.0 | 2.5 | 1847 | $1,755 | $0.95 | 43d | 1 | 0.63mi |
| 2111 Bigmouth Rod San Antonio, TX | 4.0 | 2.5 | 1917 | $1,700 | $0.89 | 43d | 1 | 0.64mi |
| 2107 Bigmouth Rod San Antonio, TX | 3.0 | 2.5 | 1777 | $1,675 | $0.94 | 43d | 1 | 0.64mi |
| 2026 Bigmouth Rod San Antonio, TX | 4.0 | 2.5 | 1383 | $1,650 | $1.19 | 4d | 1 | 0.67mi |
| 3322 Rancho Grande San Antonio, TX | 4.0 | 2.5 | 2094 | $1,895 | $0.90 | 11d | 1 | 0.68mi |
| 11318 Clearmine St #101 San Antonio, TX | 3.0 | 2.5 | 1362 | $1,700 | $1.25 | 12d | 1 | 0.70mi |
| 11318 Clearmine St Unit 104 South Southwest, TX | 3.0 | 2.5 | 1362 | $1,700 | $1.25 | 43d | 1 | 0.70mi |
| 11318 Clearmine St Unit 103 South Southwest, TX | 3.0 | 2.5 | 1362 | $1,514 | $1.11 | 43d | 1 | 0.70mi |
| 10119 Jardin Verde San Antonio, TX | 3.0 | 2.5 | 1944 | $1,750 | $0.90 | 43d | 1 | 0.72mi |
| 10719 Butterfly Pass San Antonio, TX | 3.0 | 2.5 | 1645 | $1,640 | $1.00 | 43d | 1 | 0.73mi |
| 10723 Butterfly Pass San Antonio, TX | 4.0 | 2.5 | 1687 | $1,675 | $0.99 | 43d | 1 | 0.73mi |
| 11326 Clearmine St Unit 104 San Antonio, TX | 3.0 | 2.5 | 1362 | $1,614 | $1.19 | 43d | 1 | 0.73mi |
| 10523 Goose Way San Antonio, TX | 4.0 | 2.5 | 1917 | $1,785 | $0.93 | 43d | 1 | 0.73mi |
| 10710 Butterfly Pass San Antonio, TX | 4.0 | 2.5 | 1917 | $1,785 | $0.93 | 43d | 1 | 0.74mi |
| 10723 Goose Way San Antonio, TX | 4.0 | 2.5 | 1917 | $1,785 | $0.93 | 43d | 1 | 0.77mi |
| 3331 Rosita Way San Antonio, TX | 3.0 | 2.5 | 1848 | $1,800 | $0.97 | 43d | 1 | 0.81mi |
| 10414 Espada Pass San Antonio, TX | 3.0 | 2.0 | 1416 | $1,600 | $1.13 | 43d | 1 | 0.82mi |
| 11327 Clearmine San Antonio, TX | 3.0 | 2.5 | 1362 | $1,650 | $1.21 | 1d | 2 | 0.84mi |
| 3434 Hacienda Way San Antonio, TX | 4.0 | 2.5 | 2141 | $2,000 | $0.93 | 22d | 1 | 0.85mi |
| 3434 Hacienda Way San Antonio, TX | 4.0 | 2.5 | 2141 | $1,900 | $0.89 | 16d | 1 | 0.85mi |
| 3411 Avoca Dr San Antonio, TX | 3.0 | 2.0 | 1426 | $1,460 | $1.02 | 4d | 1 | 0.86mi |
| 3411 Avoca Dr San Antonio, TX | 3.0 | 2.0 | 1426 | $1,460 | $1.02 | 17d | 1 | 0.86mi |
| 1347 Neria LOOP San Antonio, TX | 4.0 | 2.5 | 2173 | $1,699 | $0.78 | 43d | 1 | 0.95mi |
Listing history 15 events
-
2026-06-18days on market $254,990 Active 650 DOM
-
2026-06-17days on market $254,990 Active 649 DOM
-
2026-06-16days on market $254,990 Active 648 DOM
-
2026-06-15days on market $254,990 Active 647 DOM
-
2026-06-13days on market $254,990 Active 645 DOM
-
2026-06-09days on market $254,990 Active 641 DOM
-
2026-06-08days on market $254,990 Active 640 DOM
-
2026-06-07days on market $254,990 Active 639 DOM
-
2026-06-04days on market $254,990 Active 636 DOM
-
2026-06-03days on market $254,990 Active 635 DOM
-
2026-06-02days on market $254,990 Active 634 DOM
-
2026-06-01days on market $254,990 Active 633 DOM
-
2026-05-31days on market $254,990 Active 632 DOM
-
2025-06-13price $254,990 1177-char remark
Show marketing remark (1177 chars)
Welcome to the Isabella at Park Place, where elegance meets versatility in a single-story floor plan. This home embraces the open-concept lifestyle, with its seamlessly connected great room, dining area, and kitchen-a layout perfect for everything from entertaining to game night. The owner's suite features a private bathroom and a large walk-in closet, and the remaining three bedrooms share a bath with dual vanities. Options may include: Covered patio PLEASE NOTE: PHOTOS OF THE HOME ABOVE ARE NOT THE ACTUAL HOME, BUT A REPRESENTATION OF THE FLOOR PLAN. Prices, plans, and terms are effective on the date of publication and subject to change without notice. Square footage/dimensions shown is only an estimate and actual square footage/dimensions will differ. Buyer should rely on his or her own evaluation of usable area. Depictions of homes or other features are artist conceptions. Hardscape, landscape, and other items shown may be decorator suggestions that are not included in the purchase price and availability may vary. No view is promised. Views may also be altered by subsequent development, construction, and landscaping growth. ©2025 Century Communities,
-
2024-09-06$272,990 Active 1177-char remark
Show marketing remark (1177 chars)
Welcome to the Isabella at Park Place, where elegance meets versatility in a single-story floor plan. This home embraces the open-concept lifestyle, with its seamlessly connected great room, dining area, and kitchen-a layout perfect for everything from entertaining to game night. The owner's suite features a private bathroom and a large walk-in closet, and the remaining three bedrooms share a bath with dual vanities. Options may include: Covered patio PLEASE NOTE: PHOTOS OF THE HOME ABOVE ARE NOT THE ACTUAL HOME, BUT A REPRESENTATION OF THE FLOOR PLAN. Prices, plans, and terms are effective on the date of publication and subject to change without notice. Square footage/dimensions shown is only an estimate and actual square footage/dimensions will differ. Buyer should rely on his or her own evaluation of usable area. Depictions of homes or other features are artist conceptions. Hardscape, landscape, and other items shown may be decorator suggestions that are not included in the purchase price and availability may vary. No view is promised. Views may also be altered by subsequent development, construction, and landscaping growth. ©2025 Century Communities,
ⓘ Source: listings_history table (triggers on properties + properties_extension) + one-shot
backfill from property_details.listing_events for pre-trigger history.
Nearby sold comps map
Loading sold comps map…
Walkable amenities ~0.75 mi
Loading nearby amenities…
Taxation est. · year 1
- Rental income
- $22,409
- − Mortgage interest
- −$14,375
- − Property taxes
- −$3,849
- − Insurance
- −$1,283
- − Repairs & maintenance
- −$1,793
- − Management
- −$1,793
- − Depreciation
- −$7,465
- Taxable loss
- −$8,150
- Est. tax savings @ 24.0%
- +$1,956
- After-tax cash flow
- $-1,623/yr
For passive investors: Depreciation is non-cash, so a rental often shows a tax loss while cash-flowing — sheltering income. Rental losses are passive: they offset passive income freely, and up to $25,000/yr can offset ordinary (W-2) income if you actively participate and your MAGI is under $100k (phasing out to $0 by $150k); unused losses carry forward. On sale, claimed depreciation is recaptured at up to 25%, and gains may owe capital-gains tax (a 1031 exchange can defer both). Figures are a year-1 estimate at your 24.0% rate — not tax advice; consult a CPA.
Schools (NCES district)
- District
- Southwest ISD
- NCES district ID
- 4840950
- Math proficiency
- 21% ▼ -21.00%
- Reading proficiency
- 31% ▼ -5.00%
- Median HH income
- $43,362
- Composite
- 22.22/100
- National rank
- #8153
- State rank
- #701 of 826 in TX
Livability — San Antonio
- Score
- 80/100
- State rank
- #31
- US rank
- #1616
Category grades
Schools grade is shown separately in the Schools card above.
Census & demographics
- Census place
- San Antonio, TX
- County
- Bexar County · 1,990,555 people
- City population
- 1,806,925
- Metro
- San Antonio-New Braunfels, TX
- Population (ZIP)
- 22,232
- Household income
- $59,891
- Rent vs Own
- Severe rent burden
- 721.0
Population outlook (Bexar County) Hauer SSP2
- Today (2025)
- 2,336,851 people
- By 2030
- 2,560,728 · +9.6%
- By 2040
- 3,020,569 · +29.3%
- By 2050
- 3,493,522 · +49.5%
- By 2075
- 4,668,459 · +99.8%
- By 2100
- 5,533,242 · +136.8%
Race, ethnicity, and origin ACS 2023
- Neighborhood character
- Predominantly Hispanic (90%)
- Race & ethnicity
- Hispanic / Latino 90% Two or more races 24% White 6% Native American 2% Asian 2%
- Hispanic origin (detail)
- Mexican 75%
- Common ancestry
- Italian 1%
- Foreign-born
- 18% · Canada, Vietnam, China
- Languages at home
- 44% English-only · Spanish 55% Chinese 1%
Political lean MEDSL · Bexar
- 2024 margin
- Lean D (+9.8) · D 54.3% · R 44.6% · Other 1.1%
- 2008→2024 swing
- +4.2pp toward D · 2008: 5.6pp · 2024: 9.8pp
- All cycles
- 2024: D+9.8 2020: D+18.2 2016: D+13.5 2012: D+4.6 2008: D+5.6
Not yet ingested
- Civics
- —
Market trends
- HPI YoY
- ▲ 29.95%
- Current HPI
- 272.0709
- Rent YoY
- ▲ 0.83%
- Metro
- San Antonio-New Braunfels, TX
- State GDP YoY
- ▲ 3.95%
- F500 in state
- 110
Industry mix (Fortune 500 HQ in TX)
| Industry | F500 HQs | Revenue |
|---|---|---|
| Energy | 16 | $1,198B |
|
||
| Technology | 5 | $198B |
|
||
| Engineering / Construction | 4 | $72B |
|
||
| Energy Services | 3 | $60B |
|
||
| Utilities | 3 | $41B |
|
||
| Healthcare | 2 | $330B |
|
||
Price history
-6.6% since first listed2 events — show timeline
- 2025-06-13 Price Changed $254,990 Zillow
- 2024-09-06 Listed $272,990 Zillow
Cash-flow waterfall
monthlySold comps — $/sqft
last 12 mo · ≤1 miLoading sold comps…